
Registered User
Joined: 6/6/2005
Posts: 1,157
|
How do we miss stocks like these?
Okay...not SO earnest, but worth discussing. When we focus too much attention on "the market" we miss stocks like these. When we worry about what the fed is doing and what "the economy is doing we miss stocks like these. During the middle of the 2000-2003 bear market (not a correction but a growling BEAR) 342 stocks gained over 100%.
Yes, important economic matters that affect us all are worthy of discussion, but the stock market is not the economy. We come here to make money. And it's important for me to remind myself of that as much as I think it's important to study these powerhouse stocks and see what makes them tick.
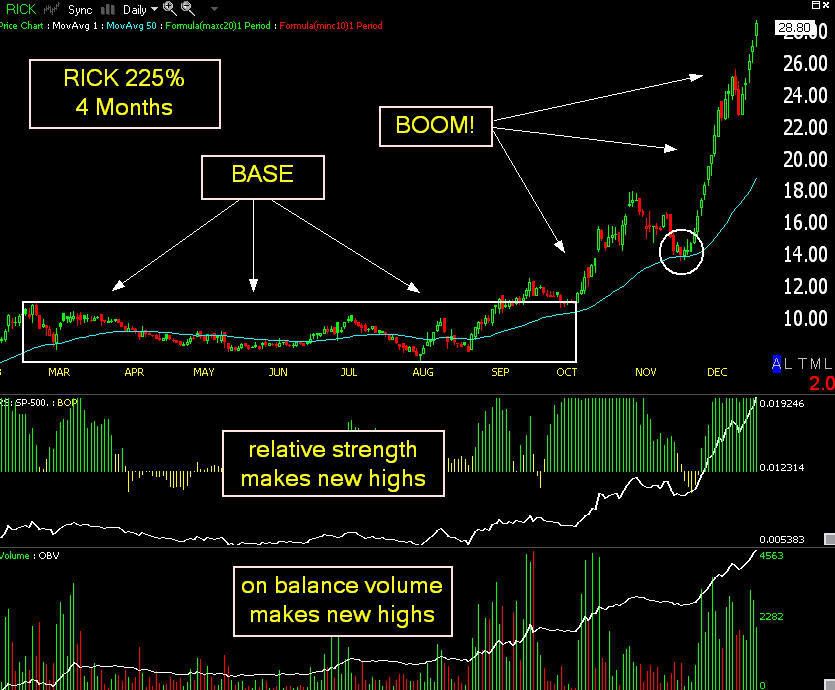
For one -- look at all that BOP -- and those chuncks of green buying bars. And yet it creeps up without me on it.
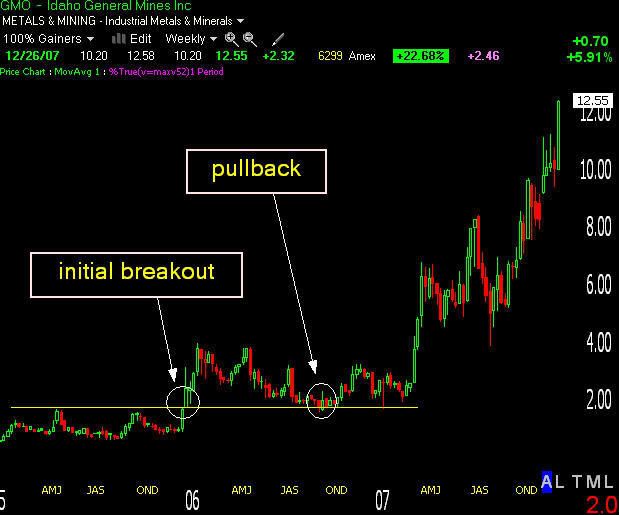
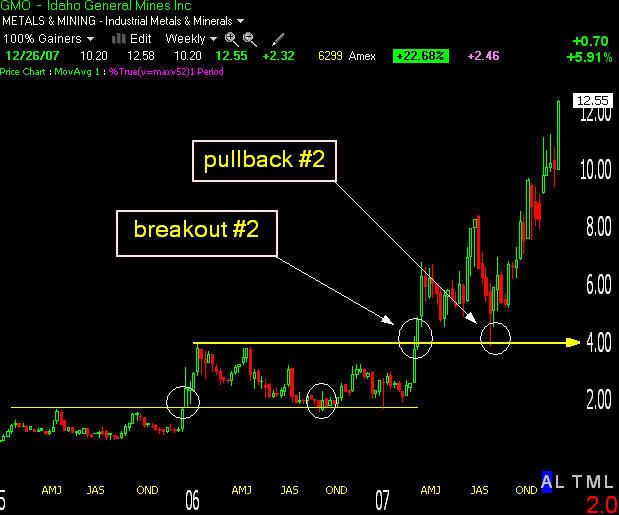
Where would one enter such a stock? Rick gave 4 (where was I during this time?) count 'em 4 possible entries...
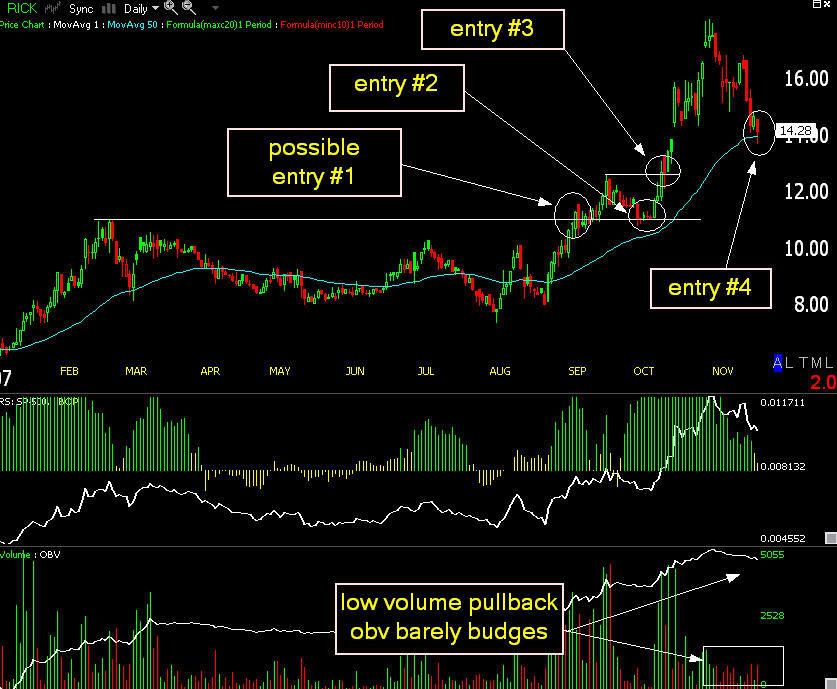
You had the first entry at the break out which occured on great volume -- any simple volume surge, 52 week high scan would have cought it. Then the pullback to the break out zone which was met with more volume. Then you had a confirmation breakout when price blasted through the high of the prior breakout. And finally, you had the fund managers refuling depot -- otherwise known as the 50 day MA.
Hope everyone gets that I'm not lecturing anyone but myself on this one. No more economy for me. No more Fed. Just stocks that are going up. On great volume. With high relative strength and on balance volume.
If you guys don't mind I'd like to post a few candidates when i find them. As I'm normally a short term 1-5 day swing trader and/or reversal system trader, I'm sure many of the picks will just be plain wrong. but I think a lot will be learned dissecting them.
Thanks for listening!
David John Hall
|
|
Registered User
Joined: 9/25/2007
Posts: 1,506
|
David ...
I'm not sure that RICK was missed ... I think I remember discussing it with Apsll just a few weeks ago ....
I don't see many momentum traders around here ...
Most of the talk here is about finding that perfect entry on a pullback ... at a support level ... coming up off the bottom ... etc ...
And sometimes ... stocks like seem to RICK provide those opportunities only in retrospect ...
There are a lot of successful traders who only buy off the "52 week high" list ...
But ... the general market direction is crucial for that kind of strategy ....

|
|

Registered User
Joined: 2/5/2006
Posts: 1,148
|
and how many stocks with similiar patterns failed during the correction? plenty. pretty darn low volume stock, to boot. never much cared for topless bars, maybe a brothel stock would be more interesting.
|
|
Registered User
Joined: 10/7/2004
Posts: 426
|
David,
I hate to sound like a broken record but here is my way of catching these stocks. If you look at your chart and see the first test of the lows and a failure to make a new low would be the latter part of Aug with the previous low being the first of Aug. Also notice that volume has picked up since that failed test because that is where the smart money enters. It is very difficult to detect this with indicators but is never missed with the good old eyeball.
|
|
Registered User
Joined: 6/6/2005
Posts: 1,157
|
Funny money...The topic here is not stocks that failed during a correction...I am not sure my mission is to find those. Instead, it is to review stocks that work. As I am sure that most traders are in the market to make money, I thought that stocks that have shown very positive returns in any market climate might be a fantastic wat to, i don't know, find others making similar moves. If you would like to post a few that failed maybe we can get a clearer understanding of why they did. Many stocks did not fail during the correction. And that is my focus. And as far as volume goes...what do you consider low volume? Rick is trading over 200k and that is my cut off. I am pretty sure i would buy a stock trading 5 shares a day if I could look forward to a 200% gain. And as for topless bars being some sort of reason not to buy a stock...that is an interesting take on the subject of making money...
Reality...thanks for your insight...I understand there are not a lot of momentum players here. I am also not one of them. However...after my last foray into market research, backtesting strength and large momentum stocks over the last 10 years, i see that many of the massive ones begin in market climates that are less than hospitable. There might be a reason for this. I thought studying them would prove very interesting. Provided the response, maybe not.
Everyone knows what they know. I understand.
David John Hall
|
|
Registered User
Joined: 2/5/2006
Posts: 1,148
|
david without a lot of blathering, the point is that stocks with technicals, like ricks, have a higher probabilty of working when the market trend is with you. and your hindsight is 20/20.
|
|

Registered User
Joined: 3/21/2006
Posts: 4,308
|
Realitycheck is correct. This stock was not missed it showed up on my scans a while back and myself and I believe a couple others commented that we made some good profits from this one. Early warning volume indicator set-ups is how I found it.
I do not know what funnybunny is talking about. The Volume is just fine for this stock and it has it has good institutional support. I have not seen any stocks that show this type of pattern fail. I also agree with Realitycheck that this is a perfect momentum stock and very rare in this Market condition. lets hope that the momentum continues as I still have some share in this one.
David please share all the stock that you can with us, so that we can all participate in there analysis.
Thanks Apsll..
|
|
Registered User
Joined: 2/5/2006
Posts: 1,148
|
apesil,
don't quit your day job. btw, i did years ago, and with well over a million bucks.
cheers
|
|
Registered User
Joined: 6/6/2005
Posts: 1,157
|
wow,
I had no idea that one simple battlecry to myself would stir up such name slinging.
funnymoney, blather away. I don't mind opposing viewpoints. I have traded for quite some time, created some very profitable short term systems, and am now looking at momentum stocks. I have backtested every corner of the market, and can tell you with 100% conviction that the winners all look the same and the loosers all look the same and the criteria for finding them is available...and that the general market condition plays only a small rose. For instance, during the last "correction", 39 stocks gained 50% or greater. There is always a place to make money and I was reminding myself of that because I had been getting too caught up in the news of the day.
I believe my post stated as much. As far as quitting your day job and making a million, congrats. you don't need to worry about making money any more. excellent work.
Apsll,
i will certainly continue to share. this board is richly rewarding and stimulating.
David John Hall
|
|
Registered User
Joined: 3/21/2006
Posts: 4,308
|
It must be nice to inherit that kind of money, I congradualate you on your winfall. One thing is clear, you did not aquire said fortune by trading stocks. You better not waste your families hard earned money in the Stock market.
I am not quite ready to give up my day job just yet but soon. David, I will not sully this fine thread further (I appologize to you). It just irratates me when I read un-qualified statements by wannabee's.
|
|
Registered User
Joined: 6/6/2005
Posts: 1,157
|
And I will pay closer attention to your posts, Apsll. Keep up the good work. And thanks for posting your charts with annotations. It certainly is a good way to get into the head of another trader. It's much appreciated.
David John Hall
|
|

Registered User
Joined: 10/7/2004
Posts: 2,181
|
I'm not so sure that "catching" these is the issue so much as "exiting". Now, I must say that I would not buy this stock for moral reasons but I realize the point of this thread is tech analysis so I'll stick to that.
On the short term, the only way to evaluate this is that hindsight is 20/20. But there are some definite indications that this was going to go (although no one but God in heaven would have known how high).
First of all, Jan 2005 this broke above its very long term downtrend. And ever since late 2004 TSV26 and its BB13 had been spent some significant time above the 0 line.
By the time you get to Aug 2005, TSV26/BB13 was almost always above the 0 line. At that point, you pretty much know it's a stock you should add to your list of "Regulars". I've discussed this before as a way to make "regular money" on some stocks that just keep sideways trending. Why not take advantage of these? After all, it's good, regular money you can add to your 2, 3 or 5 baggers you hit upon.
Once a stock like this starts heating up, it's always good to get a wide angle view and see where you are in the bigger scheme of things. The chart below shows, on a weekly scale that Jan 2005 was a pretty clear breakout from a long term trend. Always a really good sign that the probabilities (another factor I've discussed before) are in your favor. Now decision making becomes much easier because you've seen the macro view, not just the micro.
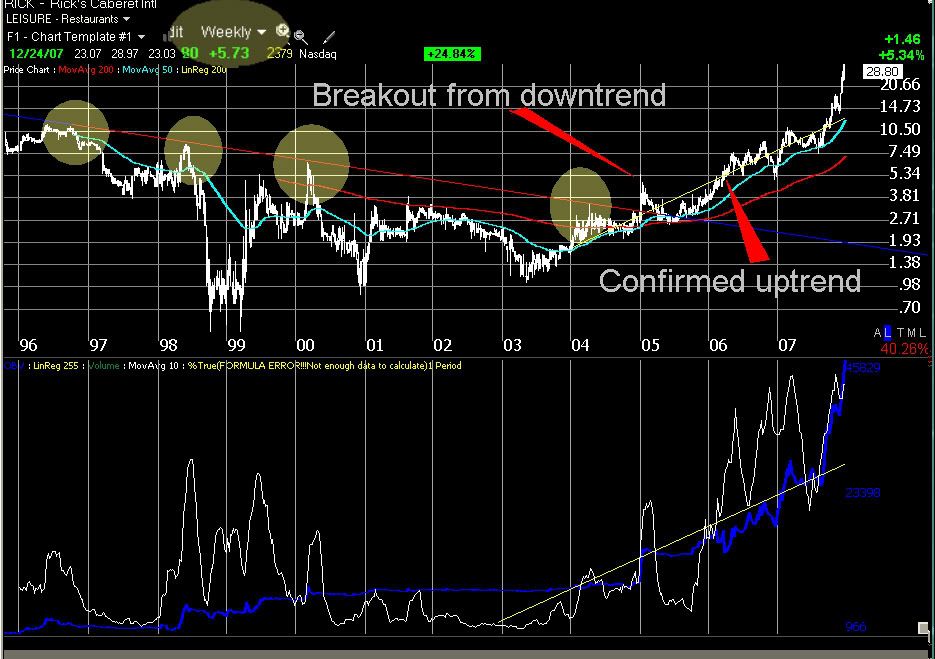
Early April 2006 confirms the breakout, then you really know it's a good time to be in this stock. From there, any hot signals are just a darn good reason to go for it. Establish a support trendline as quickly as possible and keep updating it regularly. Trade off the bounces or just stay in as long as the stock doesn't violate that supporting trendline.
Let the profits run or mulitply them by putting in the extra time to put your money into one of your other regulars that is going up while the first one is going back down to its support, then flip flop the money when the "regulars" swap directions.
Again, I think the issue is that too many of us exit too soon. This stock was mentioned weeks ago. Had it been managed correctly, no one in should have missed this entire move.
By the way, there were some indications that this stock was getting hotter and hotter. Looking back over the timeline, I had any number of confirmed buy signals (which, indeed, would have lead to good short term profits). But those signals got better and better just before the big breakout; first a "W" pattern with the 2nd leg below the first, then a "W" pattern with the 2nd leg higher than the first on good volume and all the trimmings.
Just my thoughts, hope it helps. I know most of the refined traders either don't need this info or may take a different tack; I write this mostly for the newer traders that need some additional insights.
Here's to a very prosperous New Year, let's make it happen together.
|
|
Registered User
Joined: 6/6/2005
Posts: 1,157
|
Thanks tobydad for your excellent post! I, for one, am always reading and rereading books, posts, etc. as it's the only way to stay fresh. I agree with you 100% that it's the exits that are important as well. As I look over my list of trades in 2007 I see several were in hot stocks that were excited much too soon. Granted, i was trading on a shorter time frame but still, I have to agree with Livermore: the big money is in the big moves. That's why i'd like to see how and if i can fashion strength in the momentum area.
Keep the great posts coming.
David John Hall
|
|
Registered User
Joined: 9/25/2007
Posts: 1,506
|
I agree tobydad ...
The longer term picture is very important ...
Particularly as it applies to the violation of longer tern uptrends and downtrends ...
Great post ...
|
|

Registered User
Joined: 4/18/2005
Posts: 4,090
|
It's a great chart and It came across my desk a few times.. But all I need is for their investor relations packet to show up in the mail. The first few times it hwpened was kinda confusing .. I coulden't figure out who what how and waht was going on . Then I checked my records and found that i'd been whipsawed ona little company for a 2 day holl ... for what ever reason still got "propoganda" in the mail.
|
|
Registered User
Joined: 4/18/2005
Posts: 4,090
|
A view with my template. I have some petterns i'm still tinkering with that I think will have given other signals... 'and there are the obvious "W" and breakout patterns mentioned above. Also your Entry "2" is a classic "C" entry point acccording to the breakout methodologies Stan Weinstein teaches.... this according to him is the lowest risk entry point... BUT prior points shouldn't be turned down becasue often the "C" entry is never given so it should be a place for a 2nd purchase. The key ingredients are teh high volume breakout and the low volume pullback to the breakout range.
My view: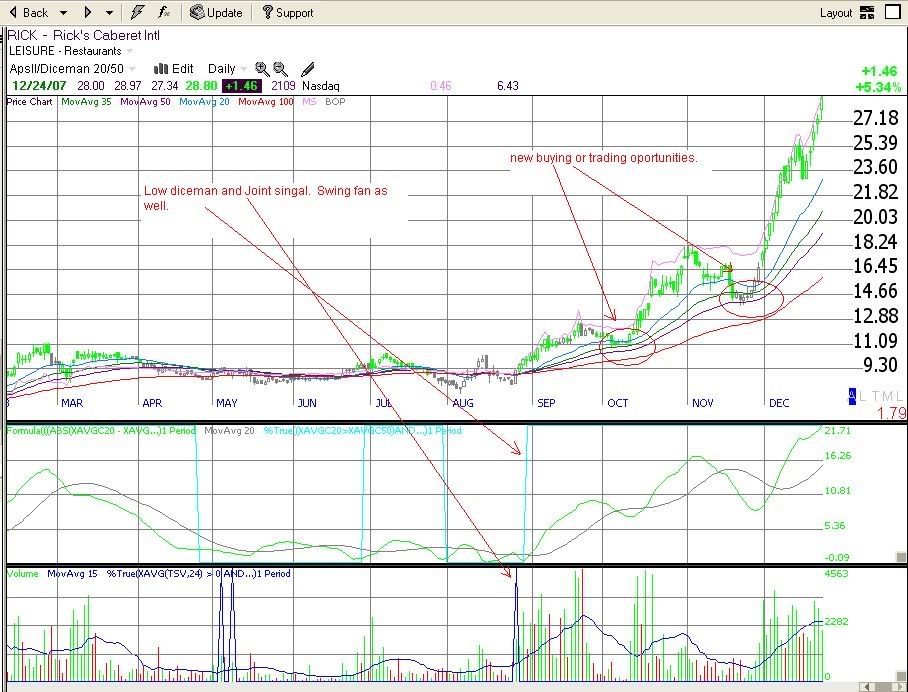
|
|
Registered User
Joined: 4/18/2005
Posts: 4,090
|
This is one plotted as a % true that would have done a great job ofcatchign the bottom... scary time to buy 
C < C8 AND L > AVGL3 AND (H - L) < (H1 - L1) AND (H - L) < (H2 - L2) AND (H - L) < (H3 - L3) AND C < AVGH3 AND TSV18 > TSV18.5
this and another are in my "playing with Patterns Thread".
|
|
Registered User
Joined: 6/6/2005
Posts: 1,157
|
thanks Scott - I'm rereading one of oneil's books again - his focus on simple charts - volume - and relative strength is refreshing. He says 75 percent of monster stocks are younger than 10 years old. I now have a watchlist of the 700 or so stocks incorporated within the last 10 years and trading below $50 - as my own backtesting has proven that the number of stocks trading above this amount that go onto massive gains is so small that I'm happy to chop them out in an effort to trim the universe of possibles.
|
|
Registered User
Joined: 9/25/2007
Posts: 1,506
|
QUOTE (davidjohnhall) thanks Scott - I'm rereading one of oneil's books again - his focus on simple charts - volume - and relative strength is refreshing. He says 75 percent of monster stocks are younger than 10 years old. I now have a watchlist of the 700 or so stocks incorporated within the last 10 years and trading below $50 - as my own backtesting has proven that the number of stocks trading above this amount that go onto massive gains is so small that I'm happy to chop them out in an effort to trim the universe of possibles.
This was something that I touched on in a previous post ....
Of course ... what you are theortetically watching in these patterns is a shift in psychology ....
And some of these psychologies ... like a cup w/handle are indicative of the process that occurs between idetifying a scalable idea ... getting funding ... and then actually having it come to fruition ....
And this seems to happen more often in newer issues ... and are thus more readily found following times of large numbers of IPOs ....
Take a look at this ... for example ...
http://moneycentral.msn.com/investor/charts/chartdl.aspx?showchartbt=Redraw+chart&D4=1&DD=1&D5=2&DCS=2&MA0=0&MA1=0&CF=1&symbol=SSRX&nocookie=1&SZ=2&CP=0&PT=7
If I recall O'Niels philosophy correctly ... he would rate this a "buy" when clearing old overhead ...
|
|
Registered User
Joined: 6/6/2005
Posts: 1,157
|
hi reality - which symbol was the chart for - it came up blank when I clicked the link. And yes - I do recall that post - I think cup and handles look great but as you said - seemed to work better in the roaring 90s - and I'm not sure about anyone else - after awhile everything looks like a cup and handle to me. :)
|
|
Registered User
Joined: 9/25/2007
Posts: 1,506
|
It's for SSRX ... try a Cut & Paste on the quote below and see if that doesn't work better ...
This crazy board does crazy things sontimes ... in this case ... it truncated the hyperlink ...
|
|

Registered User
Joined: 10/7/2004
Posts: 319
|
David - my scans would have come up with this stock........except for volume. There seems to be a difference of opinion here of minimum volume requirements. Funnymoney indicated this stock has low volume, apsil indicated the volume was fine.
As I initially said, my scans would have picked up this stock on 8/27, 10,28, 10/10, and 11/26 - 11/28....except the 50 sma of volume was below my scan settings. The 50 sma of volume on those dates ran between 65,900 and 133,900 shares/day. I limit my stock selections to a market rank >= 50 which equates to roughly 150,000 shares/day.
You have defintely given me something to reconsider here, namely minimum volume values. Out of curiosity, what volume criteria do you guy generally use for you stock and ETF scans?
Thx,
survivor
|
|
Registered User
Joined: 6/6/2005
Posts: 1,157
|
hi survivor - believe it or not - after my recent reading and studying I have all but abandoned volume criteria in regards to an average volume - now I pull anything above 100k into my watchlist and then sort by what I believe is a more important volume criteria - and that is a 1 day volume surge - I want to see big volume (2x avg plus) come in and then watch what happens. I have noticed that many big movers are creeping along on tiny volume and then they explode - the surge will pick that up - the avg volume filter might take them out
|
|
Registered User
Joined: 3/21/2006
Posts: 4,308
|
Survivor, I know that you are directing your question at this time towards David, and I am sure that he will respond soon, but I hope that you do not mind if I give some input here. I used to find myself at odds with some of the old time vets (HNC, Memorableproducts), we have all since mended our fences. But I have found through research that although Volume is very important, if you are filtering out charts due to high volume requirments than you will be missing out on some very good oppertunities. A lot of good momentum running stocks when traced back to their bottom formations were sporting very low volume levels. A lot of the samantics concerning volume is really based on the type of stock you wish to trade, and I could not agree more with you that a stock that is traded in the millions of shares per day is more reliable and of higher quality than say a stock that is traded in the thousands of shares per day. But I submit that there are equal oppertunities in both arena's.
Now I too have volume standards of course - (V > 500) AND (V1 > 500) AND (AVGV100 > 300). I Will not trade the very low volume penny stocks, I guess that we all have our standards. But Volume anomalies are what catch my eye, and this is what I scan for...
All just my opinions.
Apsll.
|
|
Registered User
Joined: 6/6/2005
Posts: 1,157
|
good to see we're on the same page apsll! How do you feel about on balance volume?
|
|
Registered User
Joined: 12/9/2005
Posts: 24
|
David,
I have been mining in a similar vein and have found the following, for what it's worth;
Scan: All Stocks, C260 > $2 AND AVGV90.260 > 10K
Sort by % change 12/27/2006 - 12/26/2007
Of the results, 163 > 100%
Of the 163 sub-set:
Share Price (C260)
23 < $5
105 < $20
150 < $50
Volume (AVGV90.260)
14 < 20K
32 < 50K
50 < 100K
74 < 200K
Sectors
23 Industry Groups Represented ( out of 31)
1 Single stock Industry Group
68 Sub-Industry Groups ( out of 209)
29 single stock sub-industry
|
|
Registered User
Joined: 6/6/2005
Posts: 1,157
|
Thanks pkbldr – very useful information and inline with what I am seeing! I have decided to spend the year ahead focusing only on plays like this while I trade the index ETFs back and forth. I have spent a lot of time looking at before and after charts of the big movers and I must say that the before charts are all over the place at times. I am beginning to favor break out pull backs on these types of stocks and I think that O’neil (obviously I don’t know for sure) favors the cup with handle for that reason.
I was wondering, have you come across any price volume moves that might give a hint to pending breakouts? I think it would be good to look at stocks within 5% of their 250 day highs. I also understand that weekly charts are better for this type of analysis. Once again, thank you for valued input. I find that this type of market research (looking for the big winners as opposed to trading small profits week in week out) engages me on every level.
David John Hall
|
|
Registered User
Joined: 3/21/2006
Posts: 4,308
|
Good question David, I like to use OBV as a measuring tool that tells me who has the stronger controll of stock price, the Bears or the Bulls. I use it in most of my volume based templates. The more green volume bars there are the higher OBV goes and the more red volume bars there are then the lower OBV goes.
I have heard arguments on this forum for its use and against. I would never trade soley on the condition of any one indicator, rather I use them all to help tell me the story of what is going on with the price trend, volume vs price, pattern development, Market condition, accumulation vs distribution.
David if you have the time you have been making refrence to a trimed univers of stocks. When you have that criteria set in stone could you please share it with me, I would love to test this univers of stocks out on my Templates and see what we can come up with.
Thanks, Apsll..
|
|
Registered User
Joined: 6/6/2005
Posts: 1,157
|
Absolutely Apsll,
I would also love for us all to analyze any aspects of possible criteria to discover what might work or not work as far as that universe goes. I am very excited to see what turns up.
David John Hall
|
|
Registered User
Joined: 12/7/2004
Posts: 393
|
DJH, you initiated a very interesting thread, thanks.
|
|
Registered User
Joined: 6/6/2005
Posts: 1,157
|
You're welcome laphill,
I'm glad you think so. i wasn't so sure at the beginnng though!
Also, if anyone has charts of great breakout stocks that have gained 100% or greater with important items to take note of i would very interested in looking. Also, the failures. Those that broke out and came back and what some of the warning signs may be. Personally, I am going to attempt one momentum trade a month. That will give me 12 trades on the year and a very valuable learnng experience. If I find myself in a winner I will obviously keep it as it goes up. But if i stop out on my proposed momentum play i will spend the rest of the month researching and studying them.
David John Hall
|
|
Registered User
Joined: 10/7/2004
Posts: 319
|
Thanks for your thoughts David John Hall and Apsil............actually my volume question was meant to be directed at everyone on this thread, not just David.....so I appreciate your input Apsil.
Half of my scans are basicallly momentum scans whereby two of the scan criteria are % change 1 yr (Rank >90) and % change 6 mo (Rank > 90). in addition, I have been using the volume criteria advocated by William O'Neal, that being average daily volume greater than several hundred thousand shares.
However, applying O'Neal's guidelines to stocks and especially ETFs just eliminates way too many good ones so I've been messing around with different volume settings.
I guess the bottom line is I don't want to get myself into positions that are too thinly traded. It just seems that buying 500 or more shares of an ETF trading <40,000 shares per day may not be a good idea, but I haven't figured out how to quantify that into its affect on my buy limit price or sell stop price.
Any thoughts from any of you guys is greatly appreciated.
Thanks,
survivor
|
|
Registered User
Joined: 10/7/2004
Posts: 319
|
pkbidr, terrifc post........thanks. Very interesting analysis as it pertains to volume. 45% (74/163) of those stocks gaining >100% during that time period had an average volume < 200,000.
survivor
|
|
Registered User
Joined: 6/6/2005
Posts: 1,157
|
Another side to this same line is...when in a momentum stock, what is good time to look for the exit...or how long will they continue to rise. here's a stock that has shown up on a relative strength scan of the Russell 3000. GMO.
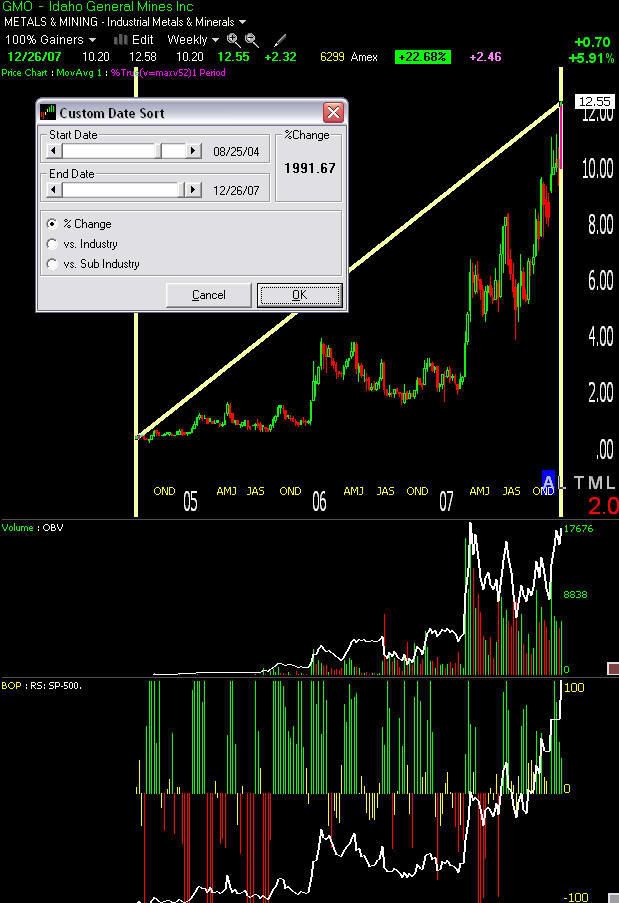
IPO'd in late 2005 -- it's up nearly 2000%! Wouldn't need many trades like that to make me happy! It gave two distinct buy points.
And....
As you can see from the very first chart volume was thin and then exploded. there was ample time to get on board once volume exploded. Also, BOP was looking hot. OBV even broke out before price. 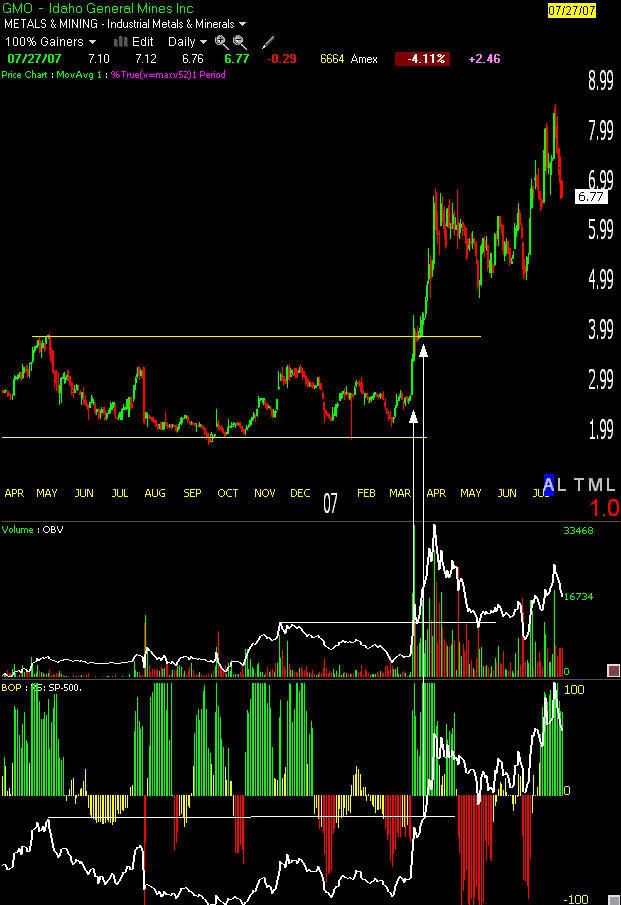
What gets me is their ellusive nature. GMO is also up 6% today.
Aspll, I think you have a lot of experience in this area. How would you enter this stock. And how would it make it onto a watchlist. Pleanty of stocks have volume surges that go nowehere.
David John Hall
|
|
Registered User
Joined: 6/6/2005
Posts: 1,157
|
I am also beginning to understand that this approach requires a LOT of patience and emotional fortitude.
|
|
Registered User
Joined: 12/9/2005
Posts: 24
|
QUOTE=davidjohnhall]
I was wondering, have you come across any price volume moves that might give a hint to pending breakouts? I think it would be good to look at stocks within 5% of their 250 day highs. I also understand that weekly charts are better for this type of analysis.
David John Hall
[/QUOTE]
In my review of the 163 stocks 100%+, I've found several things meaningful to me.
I need to do a lot more weekly timeframe, zoom 1, review of potential candidates. I've made this resolution before. The picture is very informative.
The 20 period SMA seems to work really well on weekly charts defining sustainable trends. I'd never used 20 much, having learned 10, 50 and 200. I followed the thread here, (I believe introduced by Diceman), on the 20/50 crossover and have since adopted it for daily analysis.
While certainly not a revelation if you have ever subscribed to O'neil's strategy and others; most trends began with consolidation, drop in ADR and especially a significant drop in weekly average volume. (AVGV10, Weekly) A significant number had some small divergence between OBV and AVGV10 on these weekly charts.
The support / resistance relationships, as already stated here, are definitely key in my view as well.
The hard part for me (and I suspect many others) is when I slash the chart to just preceeding the momentum uptrend. Would I have taken the trade? In most cases I would have to say no. Not with the tools I have now, or with the way I currently see them. Thus this exercise. But then I suppose that, like most things, if it was easy, everyone could do it and it wouldn't pay much.
Thanks to all of you for your contributions to my learning.
|
|
Registered User
Joined: 3/21/2006
Posts: 4,308
|
Lets put it this way David I never should have exited this stock -
http://www.worden.com/training/default.aspx?g=posts&t=16750
But now back to recent events. My currently reliable Template tells me that early October this year would have been a good time to enter this one. It would have poped up on one or two of my various Templates at some point (clearly I missed it).

|
|
Registered User
Joined: 6/6/2005
Posts: 1,157
|
Wow Apsll, I think I have found my new momentum trading system -- it's YOU. :) Seems like you have caught many of these. Fantastic work. let me know when you've finished writing that book.
Is there a post where you have have your template settings defined?
pkbldr,
i have to agree with you and thanks for your honesty -- when I roll the chart back it's hard for me to find a definitive spot where i can say YES, that is where i would be a buyer. They look pretty terrifying at the best entry points. But also...what seperates the winners from the multitude of others? At this point I cannot tell. If you're entering on the breakout it looks like a wild scary ride. If you're entering on the pullback you have to be sure it won't crash and burn.
Realitycheck has a point when he talks about general market direction. Fusing this with Oneil who says watch for the market turn around after a correction, then look for the strongest stocks during that period. Those will be the leaders.
Years ago when i began surfing, the big waves, which were always the best ones, were terrifying to enter. I simply could see no way to do it. A few more experienced friends were having the rides of their lives on waves I had no hope of catching. What I soon discovered is that you have to simply go for it and wipe out a few times before you get the nerve and the confidance to trust your instincts. Without the things I learned during those wipeouts my nerves would never have been steady enough to catch those big waves...which i did eventually learn to do.
I am certain that trading these monster stocks is a lot like that.
Here's to catching the big waves of 2008!
David John Hall

|
|

Registered User
Joined: 12/19/2004
Posts: 108
|
David,
Could you tell me who you print the charts on here? I have tried many times but were unsuccessful. I wanted to show charts also, but I am not familiar with the entire procedure. Do I need a certain software to post charts?
Thanks in advance.
|
|
Registered User
Joined: 6/6/2005
Posts: 1,157
|
hi iihart52 (not sure if those are i's or j's),
I'm not at home at the moment so i can't offer any visuals on how to do this so hopefully I can walk you through:
you will first need to open a free account at an image hosting website. i use photobucket.com
To capture your telechart screen you can either purchase a screen capture tool (I use hyper snap) or you can ctrl+alt+prt scr on your keyboard.
Once you have done this you cdan open microsoft paint and edit-paste it into the program. From there you can annotate it and save it.
Top upload it into photobucket, go to the website. They have a "browse" feature that will allow you to find and select the file.
once you have it selected, hit the upload button and your file is stored on their server. Highlight the "direct link" line under the chart and, at the worden post area click the icon that looks like a picture. It has mountains and a sun. you can then left click and paste and hit okay. the image should come up.
It's hard for me to explain this without images, so if it doesn't work, let me know and I'll do a post that shows how to do it step by step.
|
|
|
Guest-1 |