| jjhart52 |
|
Beta Testers, Gold User, Member, TeleChart
|
| Registered User |
|
|
|
|
| Unsure |
|
| Sunday, December 19, 2004 |
| Thursday, December 21, 2017 12:53:55 PM |
108
[0.04% of all post / 0.01 posts per day] |
|
|
I agree. I have tried to set up a scan similar based on your suggestion of the Dragon Incubator and my scan has returned over hundreds too. Many look promising however in my scan, I am seeing resistance on many of them. Perhaps your scan catches them right at the resistant level before the consolidation process begins?(Or I am not having the settings correct). I will have to do some tweaking possibly adding a few more criteria to see how it works for my trading strategy. If I come up with anything, I will definitely share my findings with you and the forum.Thanks for your contributions.
|
BigBlock~
Nothing dilusional about the Market. how I call patters when I see them. How long it last? That will be determine by many factors. If sectors tend to lead the economy out of recessions, in my opinion it generally starts with Technology Sectors to lead the change.
Ptolemy~
I agree as some decision with be neeeded as it approaches the 2600 mark. So far the charts are the supporting the movement.
Funnymony~
I don't really think we will see the 5000 mark any time soon. There will never be another rally like the one in the "Dot.Com" era. However I am optismistic that a short term rally is foreseable.
|
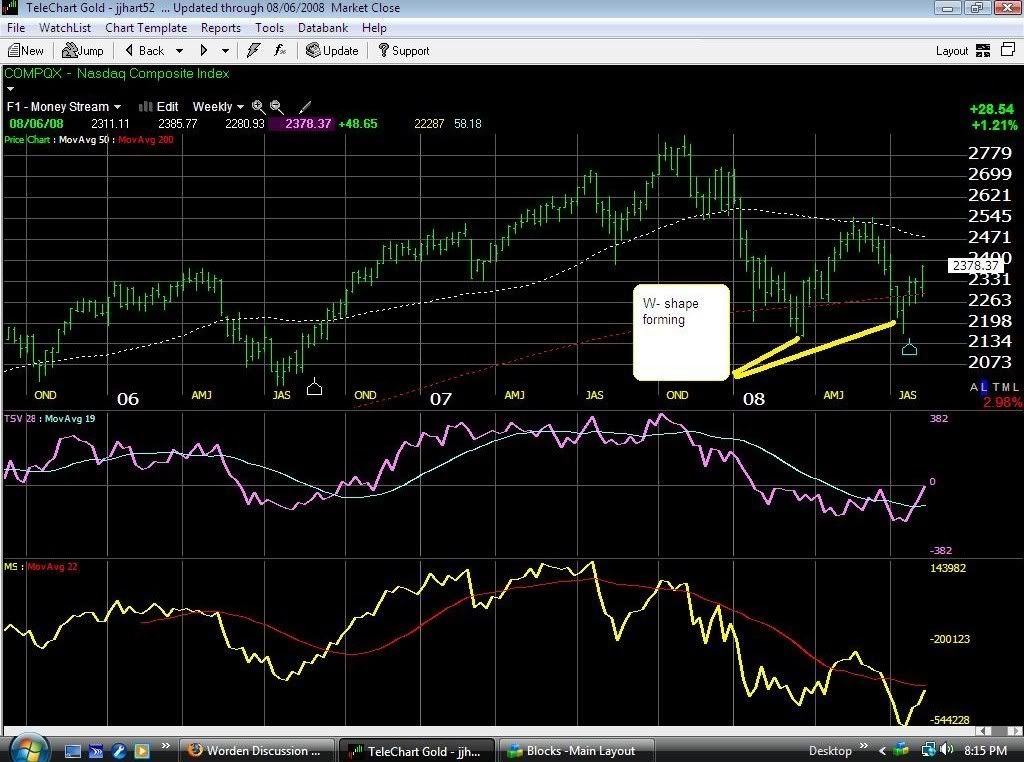
The rally in the 2nd Quarter could of lasted as TSV and Moneystream were negative as price went up. However this time around look how TSV and Moneystream favor Price.
I think an upward trend could happen here.
Any inputs?
|
Look at the Nasdaq Composite shaping up nicely. a W shape is forming. More importantly take a look at TSV and Moneystream Both looking good with TSV breaking through its Moving Average. Also look at the support level of 200 for the bottom of the W shape.
|
|
David John Hall~
Thanks for posting your "Dragon" charting. I have aquestions as I followed your link and did the custom indicators you mention as well as the regression lines however i notice my chart didn't quite look like yours when following AMR. I had trouble configuring the Regressions as they didn't match well and also the Custom indicator parameters overlapped each other at multiple points. Iwondering if you would be kind enough to share a little more insight?
Yes I would like to saee those PCFs also.
Got a questions... wondering what your take is on SQNM? The news sounds pretty good once they getting everything lined up. it has had a nice run the last two months, but right now i feel it is in Pullback mode. I'm looking a support at around $18 . before buying back in. What your take?
|
I think we may be at the bottom. I'm not saying that there will not be more down turn, however if you do a weekly chart of the Dow and do a zoom #3 you'll get the above chart. What i found interesting is that if you press the [ button you will be able to move through time. It you follow the time frame all the back to the Dot.com Bubble and from 9/11 you will see that the dow fell mearly 3,000 point. before building a consolidation.
My point is this, we have already fallen 3,000 point since the Dow's all time highs. The market has been beaten up enough that the Market expects bad news from companies, especially from earnings stand point. Oil prices, Unwmployment figures etc.
What made the Dow rebound back in was Monet Streams MA back in late 2002, (from a technical point). The Moving Average started to "curve" up. So far this current down trend I do not believe I have seen a curving up the the MS Moving Average yet.
Obviously further unepected terrible news will make the Dow slide more, however a 3,000 point drop is my take. (I could be proven wrong as after all, no one can predict the the Market, it goes where it wants to go.
We have Elections coming and of course we have the Holiday seasons approaching. Generally speaking a New Year with new Leaderships can bring optimism in the Market. Holdays generally mean money is spent on businesses.
This is just my speculation on a little more optimistice view point, yet still being a realist.
|

|
|
Yes the daily 50-day moving has been below the 200 day since the begining of the year. The months that followed, after the begining of the year, reflect what most would call a recession in my opinion. However to me a fulling integreted Bear Market isn't until the longer term views are showing the 50-day change as mentioned above. the termology used to call a bear market, (when dow looses 20% of value), is what most consider, however stocks had lost 20% of there values only to gain it back plus more.
I know the overall economy isn't so "rosey." However not all sectors has been afflicted by the Dows down turn.
|
We clearly broke through the lows of 2007 and are now headin toward the lows of 2006. Next support level is around 10,800. Also weekly chart shows Dow is now below the 200-day moving average. Won't be a Bear Market to me unless the 50-day crosses below the 200-day. Definitely a troubled mmarket though. We could start to see some consolidation towards the next support level.
|
|