
Registered User
Joined: 7/1/2008
Posts: 889
|
Ok, there's a lot of complicated indicators and methods out there that attempt to find high probability turning point.
Here is one that is SIMPLE and EFFECTIVE.
Are you ready for this wonder of quantitative wizardry?
The 10 day low.
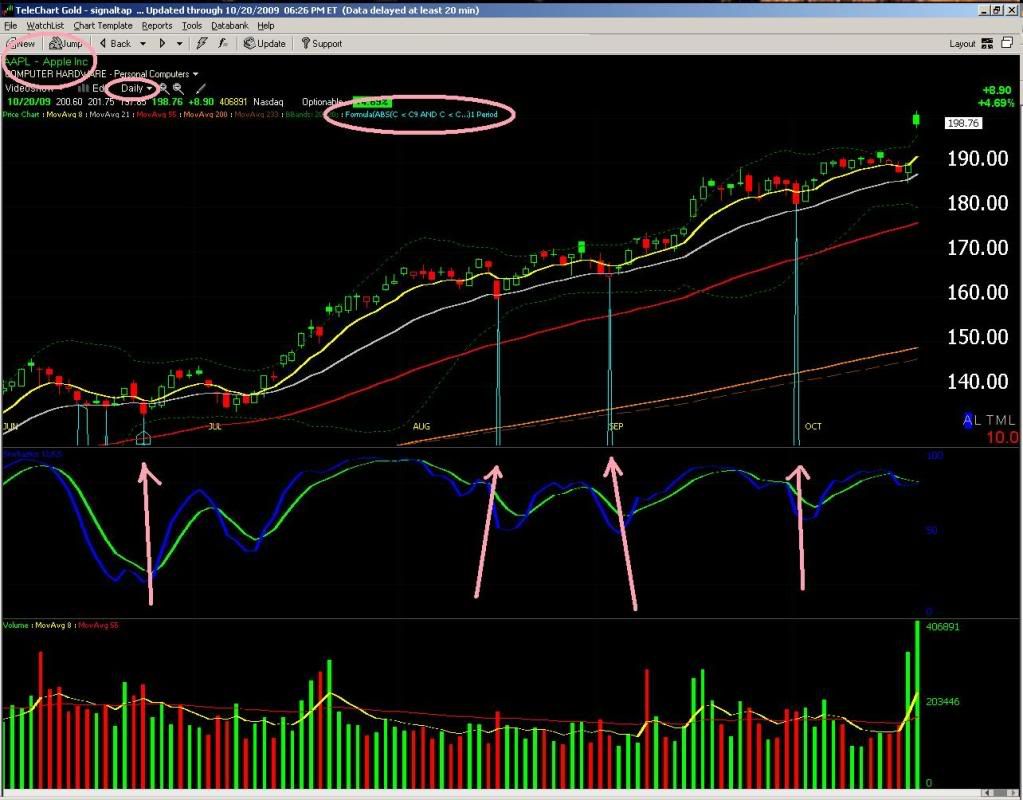
I programmed in a %true indicator with the 10 day low PCF
C < C9 AND C < C8 AND C < C7 AND C < C6 AND C < C5 AND C < C4 AND C < C3 AND C < C2 AND C < C1
this gives me a pink spike whenever the stock is at a 10 day low. The rules are that the security is above the 200 day avg. Buy near the close when this spike occurs. You're own your own with the exits.
Use this for strong stocks & market leaders to get in at a short term low.
Check it out...

I expect you all to buy me a nice steak dinner now. :)
|
|
Registered User
Joined: 1/30/2009
Posts: 267
|
This looks really good Ben. Have you tried this on other securities as well? And, where would you like your steak dinner?
|
|
Registered User
Joined: 7/1/2008
Posts: 889
|
it works pretty well on everything. Here's the S&P500

|
|

Registered User
Joined: 12/31/2005
Posts: 266
|
this system is a start, although entries and exits are the most difficult part of the trade. i think i'd rather be looking at the intraday charts to gather more techical information. and use some type of a volume based technical indicator to spot underlying technical strength as well as confirm the breakout.
|
|
Registered User
Joined: 12/31/2005
Posts: 2,499
|
In StockFinder it is a very simple
If Price.low < price.minlow(9,1) then
pass
endif
A simple buy next day open and hold for 5 days might be revealing of 2,000 days
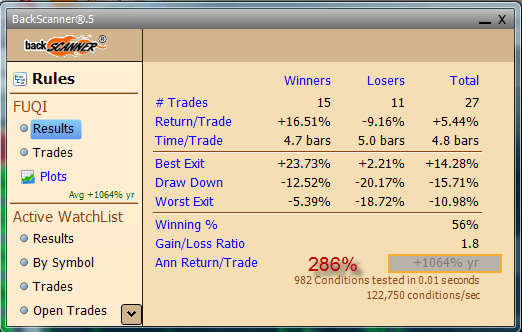
Here is FUQI's result
Here is Russel 1000 with FUQI's chart in the background.
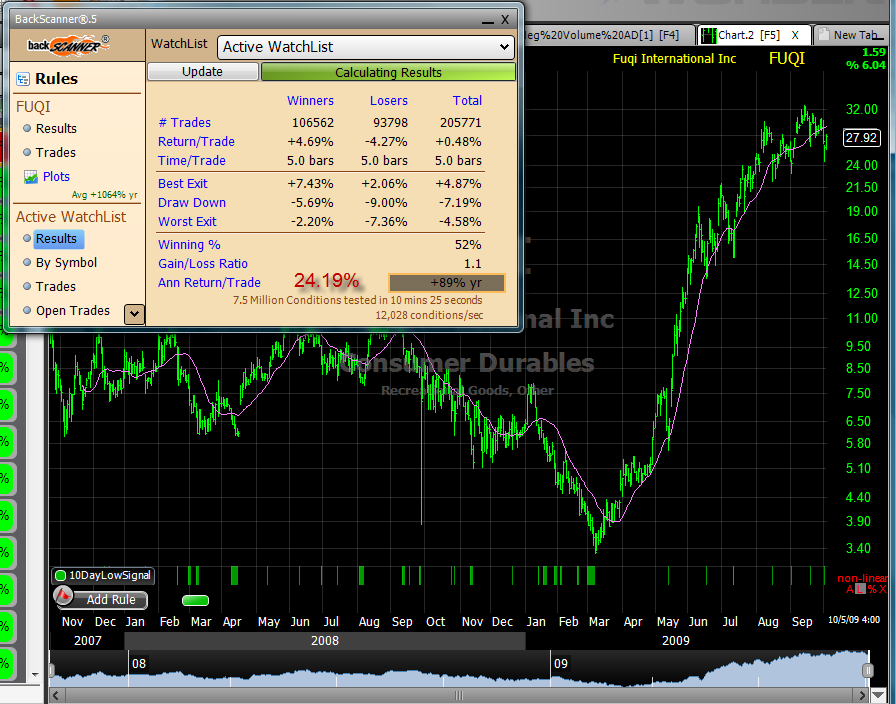
Norte this is buy next day when new 10 day low occurs and exit after 5 days. So consecutive lows won't perform very well. A longer hold period might overcome this. This is just a very quick survey. No judgement, just curious.
As a benchnmark, a set of 36,000+ random trades, buy and hold for 5 days, against the Russell 1000 over the same period had an Ann Return/Trade of 16.63% as compared to 24.19%. With Win% 51%
and win/Loss = 1.1.
So the prospects look good.
|
|
Registered User
Joined: 7/1/2008
Posts: 889
|
don't forget that the security must be over the 200 day moving average in order to be considered.
change it to buy on the close
try these exits:
close above 5 day moving average
close on 7 day high
|
|
Registered User
Joined: 12/31/2005
Posts: 2,499
|
QUOTE (ben2k9) don't forget that the security must be over the 200 day moving average in order to be considered.
change it to buy on the close
try these exits:
close above 5 day moving average
close on 7 day high
I typically don't backtest using by on close, though in this case the low being the trigger would "allow" it. In other cases as in a crossover or some indicator requiring close information, buying on close is a bit of a cheat.
It may be a bit before I can experiment on this. Any other takers?
I'm intending to generate a price trajectory just to see what the average plot looks like. It does present an interesting complication, as if I use all new 10 day lows the 11 day, and 12 day, etc, would participate in the average trajectory. However since entering on the 10 day low would negate getting in on the 11 day low, I expect the trajectory of first new 10 day low would be more accurate.
Another thing I think would/could make a difference in the relative long term LRS of price. If the stock in a general uptrend, how does that change things.
Questions beget questions...
|
|
Registered User
Joined: 7/1/2008
Posts: 889
|
buying on the close is an integral part of this strategy (buying as close to the close as possible).
|
|
Registered User
Joined: 1/28/2005
Posts: 6,049
|
If you are an end of day trader.
Something like buy the lowest 10/20% of the previous days bar could be tried.
If it jumps out of the gate the next day you just skip the trade.
Thanks
diceman
|
|
Registered User
Joined: 1/28/2005
Posts: 6,049
|
"buying on the close is an integral part of this strategy (buying as close to the close as possible)."
----------------------------------------------------
Im guessing buy near the low is a better way to look at it?
Since you could hit a 10 day low intraday then rally
strongly into the close.
Thanks
diceman
|
|
Registered User
Joined: 2/13/2005
Posts: 368
|
Thanks Ben for sharing your ideas, this looks quite interesting. Sometimes the simple approach is the right approach.
|
|
Registered User
Joined: 12/31/2005
Posts: 2,499
|
QUOTE (diceman) "buying on the close is an integral part of this strategy (buying as close to the close as possible)."
----------------------------------------------------
Im guessing buy near the low is a better way to look at it?
Since you could hit a 10 day low intraday then rally
strongly into the close.
Thanks
diceman
From a backtesting perspective, I was keeping the evaluation simple. It is not possible to buy near the low currently with the backscanner using EOD. A test of buy at close:
| Return/Trade |
Time/Trade |
AnnReturn/Trade |
| 0.43% |
5.00 |
21.67% |
.
as compared to 24.19% buy on open next day. Changing to divide by 4 days yields 27.09%. I'll have to look at some trades from each run and see if they are exiting on the same day. There may be some weirdness because of the buy on close sell on open when >4 after 0 bars. Can't take the time at the moment.
|
|
Registered User
Joined: 12/31/2005
Posts: 2,499
|
Backscanner is fine with it handling of the buy on close, exit >4 at open 0 bars. So 21.67% is correct buy at close vs. 24.19% buy at open. The buy at close enter 1 day earlier and exist one day earlier.
|
|
Registered User
Joined: 1/28/2005
Posts: 6,049
|
If you don't want to take up an entire pane with the indicator.
You could also try this in the top window:
ABS(C < C9 AND C < C8 AND C < C7 AND C < C6 AND C < C5 AND C < C4 AND C < C3 AND C < C2 AND C < C1)*L
Be sure to create an indicator (not percent true) and select "plot
using price scale".
This will plot the spike to the low of the bar.
You can click on the indicator and sort a watchlist by it.
Thanks
diceman
|
|
Registered User
Joined: 7/1/2009
Posts: 97
|
In Backscanner, my two rules are: 1. Exit at next open Trailing Stop 7%; 2. Buy at next open 200-MA moving up and price history new low (10). Using S&P 500 as my watch list from 1/1/01 to 10/6/09, the results are:
--Winners/losers: 5267 / 6018
--Return/trade: +8.55% / -4.27%
--Time/trade: 36.5 bars / 13.3 bars
--DD -8.56% / -9.66%
--Profit factor (my calculation): 1.752
That seems pretty solid to me. Is this 10-day low using just EOD prices or intraday prices? Is the price in question being compared to any price points in the previous 9 days or only EOD prices in the previous 9 days?
|
|
Registered User
Joined: 7/1/2008
Posts: 889
|
diceman - that is cool!
|
|
Registered User
Joined: 12/31/2005
Posts: 266
|
QUOTE (Mark17)
In Backscanner, my two rules are: 1. Exit at next open Trailing Stop 7%; 2. Buy at next open 200-MA moving up and price history new low (10). Using S&P 500 as my watch list from 1/1/01 to 10/6/09, the results are:
--Winners/losers: 5267 / 6018
--Return/trade: +8.55% / -4.27%
--Time/trade: 36.5 bars / 13.3 bars
--DD -8.56% / -9.66%
--Profit factor (my calculation): 1.752
That seems pretty solid to me. Is this 10-day low using just EOD prices or intraday prices? Is the price in question being compared to any price points in the previous 9 days or only EOD prices in the previous 9 days?
maybe i'm not interpreting these results right and i have my doubts on how well these backstesting programs can simulate actual trades. but this just looks like glorified gambling.
|
|
Registered User
Joined: 12/31/2005
Posts: 2,499
|
Tried an additional qualifier of a normalized 21 day LRS of price >X, where X is {0,1.0%,0.5%,0.375%,0.25%,0.125%}. Normalized = LRS21/MA21. Here are the results:
| % of trades |
Trades |
Time/Trade |
Return/Trade |
AnnReturn/Trade |
Comment |
| |
36839 |
5 |
0.33% |
16.63% |
random benchmark |
| 100% |
205771 |
5 |
0.48% |
24.19% |
buy on open |
| 107.02% |
220210 |
5 |
0.43% |
21.67% |
buy on close |
| 46.39% |
95462 |
5 |
0.49% |
24.70% |
n:Lrs21d >0.0 |
| 33.81% |
69566 |
5 |
0.60% |
30.24% |
n:Lrs21d >0.125% |
| 22.75% |
46814 |
5 |
0.78% |
39.31% |
n:Lrs21d >0.250% |
| 14.79% |
30431 |
5 |
0.96% |
48.38% |
n:Lrs21d >0.375% |
| 9.57% |
19693 |
5 |
1.16% |
58.46% |
n:Lrs21d >0.500% |
| 1.84% |
3781 |
5 |
2.19% |
110.38% |
n:Lrs21d >1.00% |
Conclusion: The steeper the positive slope the better the performance and the fewer the trades.
Note: eralier post indicated 2,000 day backscan. All test have been 5,000 days or Russell 1,0000.
|
|
Registered User
Joined: 7/1/2008
Posts: 889
|
jas,
your conclusion is logical - like I said in the intro post, this technique would work best with strong stocks and market leaders. I don't think it's best applied indiscrimately across the Russell 1000 as a mechanical system.
Driger: let me know if you come up with anything interesting on the volume or what you'd be looking for intraday. As for glorified gambling: absolutely! It's playing the odds. The trick is to have them in your favor, unlike casino gambling...where the house always wins. Techniques like this help me become the "house" with the odds in my favor. If you're involved in the markets, you're speculating. If you're trading, there are probabilties in the outcome of those trades. These backtests help quantify those probabilties.
|
|
Registered User
Joined: 12/31/2005
Posts: 2,499
|
QUOTE (ben2k9) jas,
your conclusion is logical - like I said in the intro post, this technique would work best with strong stocks and market leaders. I don't think it's best applied indiscrimately across the Russell 1000 as a mechanical system.
Driger: let me know if you come up with anything interesting on the volume or what you'd be looking for intraday. As for glorified gambling: absolutely! It's playing the odds. The trick is to have them in your favor, unlike casino gam bling...where the house always wins. Techniques like this help me become the "house" with the odds in my favor. If you're involved in the markets, you're speculating. If you're trading, there are probabilties in the outcome of those trades. These backtests help quantify those probabilties.
Nor do I, however as a satistical survey this type of sampling provide an opportunity to gain insight into the general behavior of a given approach. The tests so far show clearly that an x-day LRS of price should be part of "thinking". Is it 21 days, 63 day, dependent on the market performance? Questions, questions questions. For doing a cross section of tests and deriving an understanding of what the "improvements" mean one can gain a good eye for a chart meeting the criteria and also have a good understanding of the statistical risks.
|
|
Registered User
Joined: 7/1/2008
Posts: 889
|
FYI - FUQI back at a 10 day low....
|
|
Registered User
Joined: 2/19/2008
Posts: 193
|
For your consideration you might want to note Peter Wordens' bearish comment on this stock. I looked back on the dates of the pink spikes, June, July, August, and September. There is a difference between this one and those. They all spiked while over their 50 day moving average, TSV 24 was above center and money stream was hovering around the MA 25. There was good volume just previously in the stock, and BOP was green except in September when it was increasing from red. BOP now is also slighly decreasing but TSV is below center, there is little volume, money stream is at the bottom of the chart now--don't know what that means--maybe all sellers are exhausted?
I do like the candle though--these frequently are indicators of a turn around. I will wait for confirmation of a trend change.
How do you see FUQI responding to the price of gold? It seems to have sold off as gold went higher.
|
|
Registered User
Joined: 8/3/2009
Posts: 3
|
ben,
do you buy this at the 10 day low or wait for a bounce with volume confirmation. Thanks for sharing your knowledge.
-kk
|
|
Registered User
Joined: 7/1/2008
Posts: 889
|
I buy at the 10 day low. If you wait for the bounce, you just missed a good part of the trade...
|
|
Registered User
Joined: 7/1/2008
Posts: 889
|
QUOTE (sailnadream) For your consideration you might want to note Peter Wordens' bearish comment on this stock. I looked back on the dates of the pink spikes, June, July, August, and September. There is a difference between this one and those. They all spiked while over their 50 day moving average, TSV 24 was above center and money stream was hovering around the MA 25. There was good volume just previously in the stock, and BOP was green except in September when it was increasing from red. BOP now is also slighly decreasing but TSV is below center, there is little volume, money stream is at the bottom of the chart now--don't know what that means--maybe all sellers are exhausted?
I do like the candle though--these frequently are indicators of a turn around. I will wait for confirmation of a trend change.
How do you see FUQI responding to the price of gold? It seems to have sold off as gold went higher.
FUQI is not a gold miner and does not have any correlation with gold. FUQI is still over the 200 day, which is the more important for this criteria than the 50.
|
|
Registered User
Joined: 2/19/2008
Posts: 193
|
Nice Call Ben! FUQI up 7% in 1 hr!.
My thinking is that since it is a jewelry producer that it is likely to be effected by the price of gold.
|
|
Registered User
Joined: 7/1/2008
Posts: 889
|
All you need to do is pull up gold as a comparison symbol to FUQI in telechart. You will see a history of absolutely no correlation to the price of gold.
|
|
Registered User
Joined: 7/1/2008
Posts: 889
|
Nice trade completed with FUQI.
CTRP printed a 10 day low today...
|
|
Registered User
Joined: 2/19/2008
Posts: 193
|
Ben, where do you start your count if you are doing this by eye?
|
|
Registered User
Joined: 3/16/2006
Posts: 2,214
|
Hi Diceman, just pasted that formula and looks nice over price, it works real good with great stocks on strong uptrends! Thanks everyone! here's one:
|
|
Registered User
Joined: 7/1/2008
Posts: 889
|
QUOTE (sailnadream) Ben, where do you start your count if you are doing this by eye?
just 10 bars...very simple. You have TC gold though so why not use the PCF? Just add a percent true indicator to your chart template and plug in the PCF in the formula window, and you'll be up and running. It's a nice indicator to have on the dashboard.
|
|
Registered User
Joined: 7/1/2008
Posts: 889
|
QUOTE (diceman) "buying on the close is an integral part of this strategy (buying as close to the close as possible)."
----------------------------------------------------
Im guessing buy near the low is a better way to look at it?
Since you could hit a 10 day low intraday then rally
strongly into the close.
Thanks
diceman
Buying near the low is ideal, if you can pull it off!
|
|
Registered User
Joined: 6/8/2007
Posts: 31
|
Can any one explain how to incorporate this formula into my charts
step by step
ABS(C < C9 AND C < C8 AND C < C7 AND C < C6 AND C < C5 AND C < C4 AND C < C3 AND C < C2 AND C < C1)*L
thanks for hlep
|
|
Registered User
Joined: 1/28/2005
Posts: 6,049
|
kshere75
Do you have telechart or stockfinder?
Thanks
diceman
|
|
Registered User
Joined: 1/28/2005
Posts: 6,049
|
If you do have Telechart:
Select:
Chart Template
Add Indicator
Indicator
Top
Copy the formula into the white area (Indicator Formula)
Select: "Plot using price scale"
Select a color thats visible on your chart background.
Then hit close.
You should see a vertical line on your chart going up to the low
when the condition is true.(chart should look normal when false)
You can also click on the formula (in the chart heading)
select sort by to sort a watchlist
Thanks
diceman
|
|
Registered User
Joined: 10/20/2007
Posts: 27
|
Just one small question/ With Ben2k9 formula sort, it either comes back 100 or 0. With Diceman's it comes back with a numerical value when sorting with the ABS. What sorting method does a person use? Thanks Mccl
|
|
Registered User
Joined: 1/28/2005
Posts: 6,049
|
mcci
Because its plotting the price low (on the chart) you get the value of the low.
With both formula's zero=false.
So both are true and false at the same time. It just depends if its a spike or a low.
Thanks
diceman
|
|
Registered User
Joined: 6/8/2007
Posts: 31
|
THANKS
I got it, Mr.Diceman
|
|
Registered User
Joined: 1/12/2009
Posts: 235
|
I don't get what you mean true and false. When the volume spikes it always reads 100. What in the world does true and false mean???
|
|
Registered User
Joined: 1/28/2005
Posts: 6,049
|
True means the condition is true.
(we are at the 10 day low)
If you use Bens original it draws 100 when true.
If you use the mod I made it draws the low when true.
Every spike = true.
Everything else = false.
Thanks
diceman
|
|
|
Guest-1 |