Registered User
Joined: 12/2/2004
Posts: 1,775
|
It's good to see ants crawling up your chart I just learned. 15 ants in particular as long as 12 are in synch. Seriously, I just learned of a new technique (and catchy new trader lingo) by reading excerpts of the highly rated new book, Trade Like an O'Neil Disciple, by Morales and Kacher. They mention the ant pattern as being exceptionally powerful, and on one of their websites they interview O'Neil and the ants are brought up again. Basically if you come across a chart where price is up 12 out of the past 15 days it is exhibiting unusual strength and should be bought on first pullback. The pattern should pop out at first glance as a proper one has daily candles lined up back to back as if they were ants in a column climbing up a vine. A good example imo is GSL in October. Worden trainer Bruce L has the pcf on the TC forum. Haven't read the full book yet, just excerpts from googlebooks, but I think the thesis is that a stock moving up that consistently over 15 days with little or no pullback is in control of institutional investors (not traders) and they want in now, pullback be damned. And when the pullback finally arrives jump in fast if price is not unreasonably extended, still have to use good judgment. If anyone is more familiar with this strategy and has actually traded off of it please chime in.
|
|
Registered User
Joined: 1/28/2005
Posts: 6,049
|
I just got the book, only flipped thru it.
I probably have traded the "ant pattern" but didnt know it.
( I just call it buying strength)
It depends on where we are in the move and what I have open.
That will determine if I try to catch a trend or use something like
an ATR stop with an ATR profit target.
Thanks
diceman
|
|

Registered User
Joined: 4/13/2009
Posts: 122
|
Any ideal of how one would write a PFC to use for this type of "ant"..
Thanks
|
|
Registered User
Joined: 4/13/2009
Posts: 122
|
Opps...already done....that Bruce is gooooooood
http://forums.worden.com/Default.aspx?g=posts&t=49969
|
|
Registered User
Joined: 12/2/2004
Posts: 1,775
|
Diceman, I've probably done the same too but definitely not thinking of the ant analogy. For sure it's buying strength/momentum, but I'll start being more aware of this particular characteristic. Reading at their different websites (both authors) they are heavy into using the 10-day moving average for volatile stocks, and really go indepth with their "buying in the pocket" strategy of getting in early in a base before the actual breakout, then adding maybe. They give lots of samples in the archives of pocket buys, and I think it's a very similar tactic of buying a breakout of a tight bollinger band where price has still not taken out the literal high of the base. I'm sure the book is much more indepth. Keep us posted with an early review or two of book.
Tiger, Bruce is faaaaast too...he posted that pcf in less than about a minute after I posted request.
|
|
Registered User
Joined: 10/7/2004
Posts: 426
|
Fpetry, I have the book that you mentioned but I do not remember reading anything about the expression "ant pattern", but one thing I do remember is "pocket pivot" because it is a basis of my favorite chart pattern.
Just to show you the power of this system, I ran a simple backtest of the last 10 years of the S&P 500 using only the formula that Bruce posted as an entry condition and exiting when price crossed down thru the 50ma and it produced a Net Profit of 70.51% with a winning rate of 48.39%
Limiting your universe of potential candidates to fundamentally strong stocks with constructive basing action as mentioned in the book is important as it will increase your winning percentage. They call it tight price closes and avoiding wide and loose bases. I like to call it "well behaved" stocks. Using a pullback for an entry signal and a more graceful exit condition should increase the profit and winning percent.
|
|

Registered User
Joined: 7/1/2008
Posts: 889
|
QUOTE (fpetry) It's good to see ants crawling up your chart I just learned. 15 ants in particular as long as 12 are in synch. Seriously, I just learned of a new technique (and catchy new trader lingo) by reading excerpts of the highly rated new book, Trade Like an O'Neil Disciple, by Morales and Kacher. They mention the ant pattern as being exceptionally powerful, and on one of their websites they interview O'Neil and the ants are brought up again. Basically if you come across a chart where price is up 12 out of the past 15 days it is exhibiting unusual strength and should be bought on first pullback. The pattern should pop out at first glance as a proper one has daily candles lined up back to back as if they were ants in a column climbing up a vine. A good example imo is GSL in October. Worden trainer Bruce L has the pcf on the TC forum. Haven't read the full book yet, just excerpts from googlebooks, but I think the thesis is that a stock moving up that consistently over 15 days with little or no pullback is in control of institutional investors (not traders) and they want in now, pullback be damned. And when the pullback finally arrives jump in fast if price is not unreasonably extended, still have to use good judgment. If anyone is more familiar with this strategy and has actually traded off of it please chime in.
Yep I'm familiar with this concept..
|
|
Registered User
Joined: 7/1/2008
Posts: 889
|
Hey Booker - Hope all is well!
I'll bet the first 10-day low following a 12/15 up has a super win rate. Might be interesting to backtest!
|
|
Registered User
Joined: 1/28/2005
Posts: 6,049
|
QUOTE (Booker)
Fpetry, I have the book that you mentioned but I do not remember reading anything about the expression "ant pattern", but one thing I do remember is "pocket pivot" because it is a basis of my favorite chart pattern.
Just to show you the power of this system, I ran a simple backtest of the last 10 years of the S&P 500 using only the formula that Bruce posted as an entry condition and exiting when price crossed down thru the 50ma and it produced a Net Profit of 70.51% with a winning rate of 48.39%
Your talking about the pocket piviot? (not the ant pattern)
Thanks
diceman
|
|
Registered User
Joined: 12/2/2004
Posts: 1,775
|
QUOTE (Booker)
Fpetry, I have the book that you mentioned but I do not remember reading anything about the expression "ant pattern", but one thing I do remember is "pocket pivot" because it is a basis of my favorite chart pattern.
Just to show you the power of this system, I ran a simple backtest of the last 10 years of the S&P 500 using only the formula that Bruce posted as an entry condition and exiting when price crossed down thru the 50ma and it produced a Net Profit of 70.51% with a winning rate of 48.39%
Limiting your universe of potential candidates to fundamentally strong stocks with constructive basing action as mentioned in the book is important as it will increase your winning percentage. They call it tight price closes and avoiding wide and loose bases. I like to call it "well behaved" stocks. Using a pullback for an entry signal and a more graceful exit condition should increase the profit and winning percent.
Booker, I couldn't find the "ants" mention in the book excerpt after going back, thanks for alerting. But the authors have talked about it in detail on their websites and online articles/interviews. Here's one mention at one of their websites, about third of way down in first comments/Q&A section: http://www.virtueofselfishinvesting.com/blog/2010/08/24/qa-on-working-with-o%E2%80%99neil-timing-the-market-and-the-keys-to-trading-success/ . They also use a hybrid of the 12 out of 15 days, 11 out of 13, which is easy to tweak using the pcf posted above. I'll try and find the other mentions and link here soon I hope.
We're on same page with proper base construction, tight patterns...good points, thanks.
|
|
Registered User
Joined: 12/2/2004
Posts: 1,775
|
Okay, here's another mention of 12 of 15 and 11 of 13 in a great interview of author Morales...it's at very bottom, the last Q & A. http://cedric.froment92400.free.fr/index.php/papiers/interview-gil-mores/
|
|

Registered User
Joined: 6/15/2008
Posts: 1,356
|
I'd like to incorporate this into some of my scans. I'd like to see the ant scan in sequence with either a low, as Ben2K9 suggested, or breaking (or coming of) a lateral trendline, or moving average.
If I'm correct from looking at the PCF, the only condition that needs to be true is that the close has to be higher then the close of the previous bar. it doesn't check whether the open is lower then the close of each bar?
in other words, you could have red bars, as long as the close is higher then the previous bar. correct?
|
|
Registered User
Joined: 6/15/2008
Posts: 1,356
|
ASTM, REDF
Would they qualify? Both have pulled back substantially, and look ready for a rebound.
|
|
Registered User
Joined: 12/2/2004
Posts: 1,775
|
QUOTE (pthegreat) ASTM, REDF
Would they qualify? Both have pulled back substantially, and look ready for a rebound.
Just my opinion, but I'm pretty sure those pulled back much more than what the authors are looking for. They are heavy into the O'Neil method of much shallower pullbacks over shorter period of time...think of a typical bull flag. In one of the links above Morales explains how he plays these patterns.
I believe you are correct on how the pcf is calculated. I've been playing with it and it initially spit out some patterns that were awful even though price up 12 of 15, but improved a lot with some conditions added, such as price above 50 day, 20 above 50. I like to see volume surging so I added 10-day Volume Surge ranked above average. I also made a scan for 11 of 13...and 8 of 10 to experiment, maybe try and catch them for earlier monitoring.
|
|
Registered User
Joined: 10/7/2004
Posts: 426
|
Hey Ben, things are fine here. I'll test your idea of a 10-day low after the 12 out of 15 days up later. Maybe after market close.
Diceman, The bare bones test was using Bruce's formula for a buy condition and exiting on a break of the 50ma. The pocket pivot was not used and I am still not sure about the parameters of the ant pattern.
Fpetry, thank you for the links. Although I must say; searching the links, there is mention of ants, but nothing about an "ant pattern". I like your description of the "ant pattern". Maybe you have coined a new phrase. Nice work.
|
|
Registered User
Joined: 1/28/2005
Posts: 6,049
|
QUOTE (Booker)
Diceman, The bare bones test was using Bruce's formula for a buy condition and exiting on a break of the 50ma. The pocket pivot was not used and I am still not sure about the parameters of the ant pattern.
Ok, by "Bruce's formula" I assume you mean the one linked by Tiger 1220.
I found this on the internet from a pocket pivot fan:
Scan:
(C > C1 AND V > ABS(C1 < C2) * V1 AND V > ABS(C2 < C3) * V2 AND V > ABS(C3 < C4) * V3 AND V > ABS(C4 < C5) * V4 AND V > ABS(C5 < C6) * V5 AND V > ABS(C6 < C7) * V6 AND V > ABS(C7 < C8) * V7 AND V > ABS(C8 < C8) * V8 AND V > ABS(C9 < C10) * V9 AND V > ABS(C10 < C11) * V10) AND (C1 > (XAVGC10 * .98) AND C1 < (XAVGC10 * 1.02)) AND (AVGV10 >= 1000) AND (XAVGC9 > XAVGC20) AND (H - C <= (H - L) * .50) AND (C>5) AND (C>XAVGC9) AND (C<MAXH10.1) AND (C<MAXC65.10)
This is a break down of the above scan:
Main volume criteria - (C > C1 AND V > ABS(C1 < C2) * V1 AND V > ABS(C2 < C3) * V2 AND V > ABS(C3 < C4) * V3 AND V > ABS(C4 < C5) * V4 AND V > ABS(C5 < C6) * V5 AND V > ABS(C6 < C7) * V6 AND V > ABS(C7 < C8) * V7 AND V > ABS(C8 < C8) * V8 AND V > ABS(C9 < C10) * V9 AND V > ABS(C10 < C11) * V10)
Near (within 2%) 9 Day Moving Average (yesterday) - C1 > (XAVGC10 * .98) AND C1 < (XAVGC10 * 1.02)
10 Day Volume Criteria (Above 100K shares) - AVGV10 >= 1000
Short-Term Uptrend (9 day above 20 day) - XAVGC9 > XAVGC20
Close in Upper Half of Daily Range - H - C <= (H - L) * .50
Price Criteria (Above $5 and above 9 day MA) - (C>5) AND (C>XAVGC9)
In Short-term Consolidation (10 Days) - C<MAXH10.1
Not Extended or Already Broken Out - C<MAXC65.10
By the way, I looked in the book index and dont see "ant pattern".
Also theres a typo in the 9 day average scan (its actually for 10) The book shows 10,
but the trader likes 9 and uses it already in his trading.
(so I think he just got mixed up)
Thanks
diceman
|
|
Registered User
Joined: 12/2/2004
Posts: 1,775
|
QUOTE (Booker) Fpetry, thank you for the links. Although I must say; searching the links, there is mention of ants, but nothing about an "ant pattern". I like your description of the "ant pattern". Maybe you have coined a new phrase. Nice work.
"Ant pattern" off top of head, deep thought there:) Here's another link where Morales sort of officially labels "ants" as a pattern on his website: http://www.gilmoreport.com/education/glossary.html
|
|
Registered User
Joined: 12/2/2004
Posts: 1,775
|
QUOTE (diceman) Scan:
(C > C1 AND V > ABS(C1 < C2) * V1 AND V > ABS(C2 < C3) * V2 AND V > ABS(C3 < C4) * V3 AND V > ABS(C4 < C5) * V4 AND V > ABS(C5 < C6) * V5 AND V > ABS(C6 < C7) * V6 AND V > ABS(C7 < C8) * V7 AND V > ABS(C8 < C8) * V8 AND V > ABS(C9 < C10) * V9 AND V > ABS(C10 < C11) * V10) AND (C1 > (XAVGC10 * .98) AND C1 < (XAVGC10 * 1.02)) AND (AVGV10 >= 1000) AND (XAVGC9 > XAVGC20) AND (H - C <= (H - L) * .50) AND (C>5) AND (C>XAVGC9) AND (C<MAXH10.1) AND (C<MAXC65.10)
By the way, I looked in the book index and dont see "ant pattern".
Thanks
diceman
Hey thanks for the pcf diceman. I just ran it and it gave correct results. The first one above that's linked, it doesn't work for me for some reason, gives incorrect results, but like I said this one seems to do the trick.
My mistake if I implied that "ant pattern" was a specific label by the authors...turns out the "ants" type pattern of 12 of 15 up days was mentioned several times by both in other publications or website articles and I got mixed up on where I read what. But I'm pretty sure that in the book the 12 of 15 days is mentioned if without the "ant" label.
|
|
Registered User
Joined: 1/28/2005
Posts: 6,049
|
QUOTE (fpetry)
The first one above that's linked, it doesn't work for me for some reason, gives incorrect results,
You mean the one linked by Tiger1220 ?
Thanks
diceman
|
|
Registered User
Joined: 12/2/2004
Posts: 1,775
|
QUOTE (diceman) QUOTE (fpetry)
The first one above that's linked, it doesn't work for me for some reason, gives incorrect results,
You mean the one linked by Tiger1220 ?
Thanks
diceman
My bad, the one by Tiger is for 12 of 15 days by Bruce L and it does work, my apologies to Tiger. I meant to say the pcf for the "pocket buy" on the same pcf TC forum is the one that doesn't work for me anyway. Glad you posted the alternate pcf for 'pocket buy" here, as it seems to work fine.
|
|
Registered User
Joined: 7/1/2008
Posts: 889
|
I first heard about the "ants" a while back when a friend took good notes at a CANSLIM level 4 training camp, where Bill O'Neil spoke along with some of his PMs. They said the same thing...12/15 is a show of unusual strength...worth paying attention to.
|
|
Registered User
Joined: 10/7/2004
Posts: 426
|
QUOTE (ben2k9) Hey Booker - Hope all is well!
I'll bet the first 10-day low following a 12/15 up has a super win rate. Might be interesting to backtest!
I made an error in my code for the first test I ran. As an exit I had price crossing up thru the 50ma instead of price crossing down thru the 50ma. So here is a corrected run. All test are using 10 years data of the S&P 500 and Bruce's formula for price up 12 out of past 15 days.
Entry: Price up 12 out of past 15 days
Exit: Price crossing down thru the 50ma
Net Profit: 132.34%
Winners: 40.60%
Changing the buy to a 10-day low following the 12/15 up (10 days ago) has better results. I also changed the exit to use a 5ma
Entry: Price up 12 out of past 15 days (10 days ago) with a 10-day low pullback
Exit: Price crossing down thru the 5ma
Net Profit: 205.91%
Winners: 57.25%
|
|
Registered User
Joined: 11/1/2005
Posts: 240
|
Finding ants isn't new, Robert Deel at trading school in Los Angles uses the Ants. Its been several years ago I took the class. I found it late in the trend to use. I want in on that twelve days, not in hind site???
|
|
Registered User
Joined: 2/13/2005
Posts: 368
|
Booker,
Are you running your scans with Stockfinder?? Thanks
|
|
Registered User
Joined: 12/2/2004
Posts: 1,775
|
QUOTE (jimstacy) Finding ants isn't new, Robert Deel at trading school in Los Angles uses the Ants. Its been several years ago I took the class. I found it late in the trend to use. I want in on that twelve days, not in hind site???
Jim, not sure exactly what you mean, but I think you're questioning the wisdom of entering a stock that's up 12 out of 15? I agree totally that it would be too risky at that point and the authors do too. To be clear, that signal is to alert the trader so the stock can be monitored and entered days or weeks later if a pullback or resting base sets up properly. I've been looking at some recent high momentum names to try and find a few of those 12/15 or 11/13 patterns that signaled and how the stock reacted later on. One I found is GGAL. It broke out of a base early August and commenced put in a 11of13 ant pattrn. It then based a few weeks and gave another buy signal on mid Sept. base breakout. Price broke out again late Oct. and it put in another 11 of 13. It's breaking out this morning from Nov. lateral consolidation. A bit more caution maybe as it looks like it might be a latter stage base, put price rules and early volume is excellent so far.
|
|
Registered User
Joined: 1/28/2005
Posts: 6,049
|
GGAL also triggered last night in the pocket pivot scan.
Thanks
diceman
|
|
Registered User
Joined: 1/28/2005
Posts: 6,049
|
GGAL also triggered last night in the pocket pivot scan.
Thanks
diceman
|
|
Registered User
Joined: 12/2/2004
Posts: 1,775
|
QUOTE (diceman) GGAL also triggered last night in the pocket pivot scan.
Good eye diceman, I missed that.
I think GSL on Monday had a pocket signal day too. It had a 12 of 15 ant trail in October, quiet tight action last couple days, watching.
|
|
Registered User
Joined: 1/28/2005
Posts: 6,049
|
In the book Ben talked about "The Hedge Fund Edge" there is a momentum scan
he talks about.
This is my version of it:
((2 * (((C / C5 * 100) - 100) + ((C / C25 * 100) - 100) + ((C / C40 * 100) - 100) + ((C / C65 * 100) - 100))) + ((C / C130 * 100) - 100) + ((C / C200 * 100) - 100) + ((C / C260 * 100) - 100)) / 11
Using the pocket pivot scan and sorting by the momentum.
GGAL, EGY, GSM, FNSR, RDY
were the best.
Its a pretty simple way to find strong stocks consolidating.
( I also have a "no gap up" in the scan)
Thanks
diceman
|
|
Registered User
Joined: 12/2/2004
Posts: 1,775
|
diceman, nice scan, thanks. I just loaded and ran it but no hits...I assume it only calculates for the closing price, thus does not work intraday? If so, is there a way to tweak so I could run it intraday? Regardless, thanks again.
The first pocket scan you show above in this thread does give intraday hits, XRX, MCY for example.
|
|
Registered User
Joined: 1/28/2005
Posts: 6,049
|
It should work if your updated.
Since it has this:
"((C / C260 * 100"
You need to have the "200 days history" checked for your PCF calculation.
Thanks
diceman
|
|
Registered User
Joined: 12/2/2004
Posts: 1,775
|
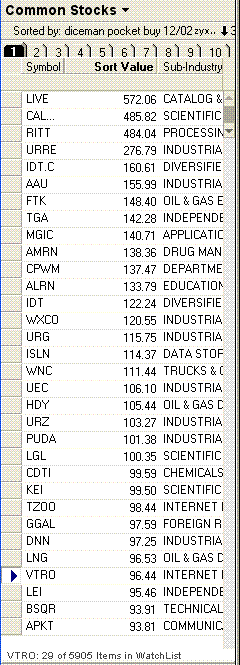
I updated TC and pcf criteria with the 250 days checked, and still no hits. I chose watchlist all common stocks, almost 6000, and then sorted by the scan, it then lists all those stocks in the sort value field by a value at top starting at 572.06. There are no "true" values listed like I get in the other scan. Near top of sorted list are stocks such as RITT. In the top 30 stocks there are some with negative price for the day, such as CDTI, VTRO for example.
|
|
Registered User
Joined: 12/2/2004
Posts: 1,775
|
Screenshot of results if it helps, thanks diceman.
|
|
Registered User
Joined: 1/28/2005
Posts: 6,049
|
I just did an update 1:59 eastern and got 4 with TEO at the top. (Common Stocks)
One thing to remember during the day stocks can fall in and out of "true".
For example theres +/- 2% of the 10 day moving average.
If you update and its +2.1% stock wll be false, update later and
stock is +1.9% it will be true.
Thanks
diceman
|
|
Registered User
Joined: 12/2/2004
Posts: 1,775
|
Okay, I've got it figured out, I got confused. This scan is not another pocket scan but a momentum scan. I think you used the pocket scan you gave earlier this week, then sort by this momentum scan? LOL, sorry.
|
|
Registered User
Joined: 12/2/2004
Posts: 1,775
|
QUOTE (fpetry) Okay, I've got it figured out, I got confused. This scan is not another pocket scan but a momentum scan. I think you used the pocket scan you gave earlier this week, then sort by this momentum scan? LOL, sorry.
I just posted above without seeing this post of yours, so I guess that comment I made was incorrect? I need a break:)
|
|
Registered User
Joined: 12/2/2004
Posts: 1,775
|
Okay, just ran scan too and got TEO second from top, HDY at top. I used the pocket scan you posted here yesterday.
|
|
Registered User
Joined: 1/28/2005
Posts: 6,049
|
QUOTE (fpetry) I think you used the pocket scan you gave earlier this week, then sort by this momentum scan?
Yep.
|
|
Registered User
Joined: 11/1/2005
Posts: 240
|
QUOTE (fpetry) QUOTE (jimstacy) Finding ants isn't new, Robert Deel at trading school in Los Angles uses the Ants. Its been several years ago I took the class. I found it late in the trend to use. I want in on that twelve days, not in hind site??? Jim, not sure exactly what you mean, but I think you're questioning the wisdom of entering a stock that's up 12 out of 15? I agree totally that it would be too risky at that point and the authors do too. To be clear, that signal is to alert the trader so the stock can be monitored and entered days or weeks later if a pullback or resting base sets up properly. I've been looking at some recent high momentum names to try and find a few of those 12/15 or 11/13 patterns that signaled and how the stock reacted later on. One I found is GGAL. It broke out of a base early August and commenced put in a 11of13 ant pattrn. It then based a few weeks and gave another buy signal on mid Sept. base breakout. Price broke out again late Oct. and it put in another 11 of 13. It's breaking out this morning from Nov. lateral consolidation. A bit more caution maybe as it looks like it might be a latter stage base, put price rules and early volume is excellent so far.
I mean its not a new theory and it didn't work for my interest.
|
|
Registered User
Joined: 7/1/2008
Posts: 889
|
QUOTE (diceman)
In the book Ben talked about "The Hedge Fund Edge" there is a momentum scan
he talks about.
how did you like the book?
|
|
|
Guest-1 |