Registered User
Joined: 7/28/2009
Posts: 4
|
I was wondering what is the best time of the day (morning or after market closes) to determine the support and resistant of a stock. I am looking to use my simulator and am very new to this.
|
|


Worden Trainer
Joined: 10/7/2004
Posts: 65,138
|
The trainers can't give setting, interpretation or investment advice. I'll move this topic to the Stock and Market Talk forum so other traders will be more likely to see it and comment.
-Bruce
Personal Criteria Formulas
TC2000 Support Articles
|
|

Registered User
Joined: 2/5/2006
Posts: 1,148
|
what time of day?
how about anytime of day.
|
|

Registered User
Joined: 7/1/2008
Posts: 889
|
I'm not 100% sure what you're asking...but I judge support and resistence levels over longer time frames on daily and weekly charts. what are you trying to do?
|
|
Registered User
Joined: 1/28/2005
Posts: 6,049
|
Your a Gold member.
So it would typically be done on the daily close.
Thanks
diceman
|
|
Registered User
Joined: 1/28/2005
Posts: 6,049
|
Ment to say daily price bars.
Thanks
diceman
|
|
Registered User
Joined: 2/5/2006
Posts: 1,148
|
drawing trendlines, support, and resistance, are more art than science. if dicemans interpretation is correct i prefer using closing prices, although if there are a lot intraday moves to particular level, i may draw a line there. but closing prices carry a little more weight with me.
|
|
Registered User
Joined: 7/28/2009
Posts: 4
|
QUOTE (ben2k9) I'm not 100% sure what you're asking...but I judge support and resistence levels over longer time frames on daily and weekly charts. what are you trying to do?
|
|
Registered User
Joined: 7/28/2009
Posts: 4
|
I guess what I was saying about resistant and support had to do with knowing where to put my stops and buy in. I may sound very green to this, no punt intented, and I am. I am taking a class on line. So if some of my questions sound a little off beat, be gentle OK... Believe it or not I am a very smart woman, just getting my feet wet here..
I have been building my portfolio a little at a time, haven't added stops and know I should. In my class (Technitrader) they speak of what I am asking (s & R)
To make it simple. i am trying to use my simulator and put the stop losses in the right place.
Some time it would be nice to talk to a real person. This is not so easy when you are first getting started.
Any one want to take this on?
Thanks for all your input too.
|
|
 Gold Customer Gold Customer
Joined: 11/11/2006
Posts: 359
|
Jackieclev74:Funnymoney is quite correct in his comment about trendlines, support and resistance.
There are many interpretations of these things.
A trendline over the highs (in a downtrend) or under the lows (in an uptrend). Using the close, or the high/low.
Johndavidhall uses 20 day price channels.
Linear Regression Channels, also. Length of LR to your preference.
You may find the Darvas method beneficial. A high (resistance) is established when a price has made a new high, followed by at least three days (or periods) of lesser highs, with none of the three periods being equal to the highest. Put a horizonal line over that price high. That would by your resistance. AFTER the high is established, wait for a low, followed then by three days of higher lows with none of the three higher lows being equal to the initial low. Put a horizonal line under this low. That is your support. When to buy? When price closes over the resistance. Guppy suggests buying as soon as the low is established (Support will be closer)
Google Darvas
Should you go to the Russell 1000, sort it by price % gain in 26 weeks, this would give you a nifty list of stocks in uptrends. The top ten are the stocks with the best gains in 26 weeks, of the 1000 or so in the Russell 1000.
Hope this helps.
Mammon
|
|
Registered User
Joined: 12/31/2005
Posts: 2,499
|
QUOTE (jackieclev74) I guess what I was saying about resistant and support had to do with knowing where to put my stops and buy in. I may sound very green to this, no punt intented, and I am. I am taking a class on line. So if some of my questions sound a little off beat, be gentle OK... Believe it or not I am a very smart woman, just getting my feet wet here..
I have been building my portfolio a little at a time, haven't added stops and know I should. In my class (Technitrader) they speak of what I am asking (s & R)
To make it simple. i am trying to use my simulator and put the stop losses in the right place.
Some time it would be nice to talk to a real person. This is not so easy when you are first getting started.
Any one want to take this on?
Thanks for all your input too.
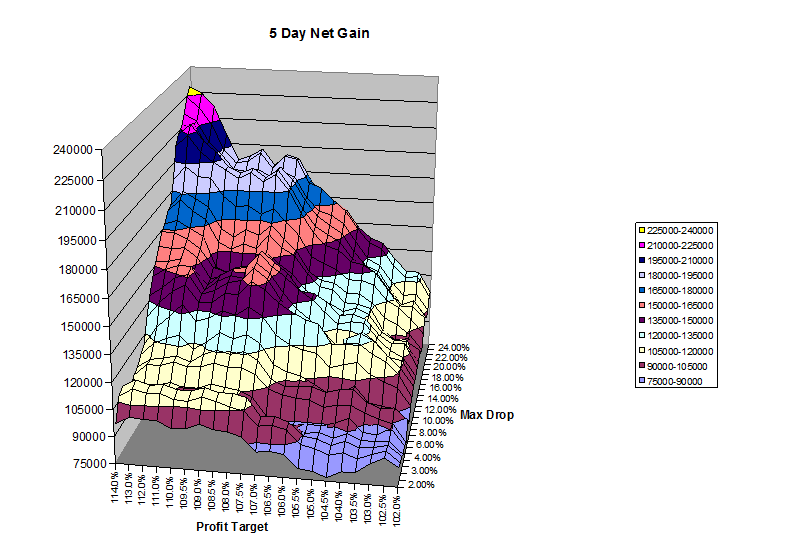
Backtesting "stop loss" settings typically reveals that they are more like "capture loss" settings. What I mean is, at between 2-8% stop loss exits typically do worse than just setting a 20% stop loss for timed exits with profit targets. That is not to says there are not some loosers at the 20% setting. It is more that the sum of the recoveries of all the stocks that would have existed with an %8 stop loss is greater that the losses incurred by those few stock hitting the 20% stop. So the bottom line, more often backtesting a 20% stop loss out performs a 6% or an 8% stop loss.
That is a backtesting result.
It is a different matter, sitting by and watching that occassional pick go down 10%, 12%, 15% etc. It can spoil one's mood and put one off her/his game.
Support & resistance level exits provide for means of constructing a clear trade plan before entering the trade and provide a way to measure your adherance to the plan. Plan the Trade - Trade the Plan. Doing this protects you money and you psychological state of mind and presents an environment for a controlled learning process. The exact settings don't amount to a significant difference in performance when compared to the losses resulting form not have a specific plan for each trade or from having an plan and not sticking to it.
|
|
Registered User
Joined: 1/28/2005
Posts: 6,049
|
Some basic stops:
A fixed percentage.
A multiple of ATR (average true range)
A MIN LOW (10 day low , 20 day low)
A moving average of the lows.
A pivot low (in an uptrend) The low of a 3 bar pattern where the
middle bar is the lowest of the 3.
Also think in terms of dollars risked as it relates to account size.
Lets say you only want to "risk" $300 on a trade. If your stop
is expected to be about $2.4 below you entry.
You can only buy about 125 shares (300/2.4)
This allows you to use wider stops with equivalent risk.
(because your buying less)
Also it easily allows you to adjust the situation. Things
aren't going well and you want to reduce risk.
Change the $300 to $150.
(now you will buy half the position)
Everything ultimatly depends on how you intend to trade
(trend, counter trend, breakout, pullback) and your
timeframes.
Thanks
diceman
|
|
Registered User
Joined: 7/1/2009
Posts: 97
|
Great posts in this thread--mammon, jas0501, and diceman.
jas0501, I agree with what you say about minimal stop-losses (IBD recommends a max 7% stop-loss, interestingly). However, I agree only anecdotally. When you say "that is a backtesting result," exactly what were your criteria for the backtest, what underlyings did you look at, and over what time frame?
|
|
Registered User
Joined: 2/5/2006
Posts: 1,148
|
QUOTE (Mark17)
Great posts in this thread--mammon, jas0501, and diceman.
jas0501, I agree with what you say about minimal stop-losses (IBD recommends a max 7% stop-loss, interestingly). However, I agree only anecdotally. When you say "that is a backtesting result," exactly what were your criteria for the backtest, what underlyings did you look at, and over what time frame?
mark, (and whatever other usernames you use)
i'm not really sure whether your intention is to compliment some or just put others down.
in case its the later, KMA.
|
|
Registered User
Joined: 12/31/2005
Posts: 2,499
|
It was based on numerous exit studies. Below is a graph, the perspective does not show the trough between 2% and 8% very as the view is perpendicular to it. This is a 5 day hold with profit tarts from 2-40% and stop loss, (max drop) of 2-24%.
|
|
Registered User
Joined: 1/28/2005
Posts: 6,049
|
jackieclev74
Take a look at Bens charts in this post:
The drawn horizontal lines represent a good illustration of support/resistance.
Notice that the same price level represents when a stock
goes down to it from above (support) and (resistance)
when approached from below.
diceman
|
|

Registered User
Joined: 6/6/2005
Posts: 1,157
|
What I mean is, at between 2-8% stop loss exits typically do worse than just setting a 20% stop loss for timed exits with profit targets.
I can't speak for the experiences of others, but I can personally say from live trading results that widening stops has had a tremendous impact on my trading.
To compensate for the wider stop-losses I position size smaller and the result has been great. Like jas I had known of this from backtesting, but I didn't take it live until this year and it's the right method for me.
Yes, you have to watch some stocks trade down and yes that can be really aggrivating. And the hold time becomes longer so there are trade offs as far as time in trade is concerned. Those are things to be considered. I just wanted to chime in from someone who's been working with stops this wide.
David John Hall
|
|
Registered User
Joined: 1/12/2009
Posts: 235
|
DJH, what percent stops do you usually take? I guess you can reduce your share size depending on the length of the stop. Do you trade pull backs or break outs mainly? Do you find yourself getting stopped out less with wider range stops?
|
|
Registered User
Joined: 12/31/2005
Posts: 2,499
|
A couple comments regarding the plot. The trough seems to indicate market controlled whipsaws for those with there conspiracy generators running. The fact that the 2% stoploss outperforms the 6% stoploss seems strange.
More importatnly!.......
Clearly setting a deep stop loss should only be done with strategies that have been confirmed via backtesting as profitiable. Setting a 20% stop loss on a stratgey that loses money will just loose money faster!
|
|
Registered User
Joined: 1/28/2005
Posts: 6,049
|
"The trough seems to indicate market controlled whipsaws for those with there conspiracy generators running."
--------------------------------------------------------------------------
jas501
What do you mean exactly by market controlled whipsaws?
(random?)
Is the plot representing results a long and short strategy?
Were any (market,stock) timing/(market,stock) filters involved or were
all valid trades taken regardless of market/stock conditions?
Thanks
diceman
|
|
Registered User
Joined: 6/6/2005
Posts: 1,157
|
DJH, what percent stops do you usually take? I guess you can reduce your share size depending on the length of the stop. Do you trade pull backs or break outs mainly? Do you find yourself getting stopped out less with wider range stops?
I have traded stops all the way from 5-50% because I wanted to see how I emotionally respond to all of them. I hate tight stops. Just can't trade them. 50% stops were for very volatile stocks and had a few trade down to -45% before shooting up to +100%. I am currently most comfortable with stops in the 25% range. These types of stops aren't for everyone, but for me they've meant the difference between a world of frustration and a new winning method.
Do I get stopped out less? Yes. Much less. But it's strange, now with wider stops I care less about getting stopped out. If I have a 25% stop and price trades down there and I get stopped out -- I gladly take it. If price turns around and rockets up, I can either get back on or let it go. It's weird, the whole widening of stops has made me a much more relaxed trader.
Typically I trade breakouts from consolidations, (pennants and triangles) and W bottom reversals. These are both patterns. And through my backtesting I have found that the entry is only part of the equation. How many positions you hold, your position size, the volatility of the stocks you trade, your exits, your method's expectancy, drawdowns, highest consecutive wins and losses, average consecutive wins and losses, all play very important roles. The great thing is you don't even need to know how to backtest to get these numbers. You can get it all from you live trades if you keep good records. At any point in time you can see how well your method is working or not.
Also, more and more I've been trading from weekly charts because I like the noise reduction and they just look cleaner to me. Here's a weekly chart of dig...
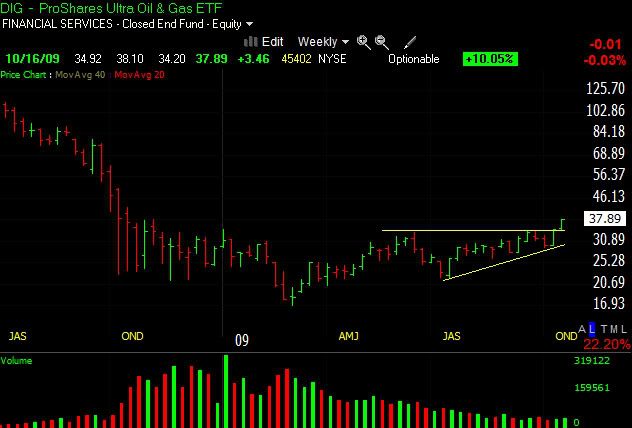
To me that just looks more relaxing. I can get in something like that near the breakout, set my stop below the nearest swing low (it's around $27), position size based on that, and see what happens. For me there is no better way to trade. Typically I will have more positions on, but that's okay. When I sense the market getting a little dicesy I protect my portfolio with a hedge.
A final thing to note is drawdown. You can expect a drawdown in line with how much you are risking. If my stops are at 25%, then i can expect my system will have a drawdown that deep. In fact, when I was trading larger stop losses my entire equity suffered a "controlled" drawdown of over 30%. The important thing is to trust your method and I knew this going in. As the syetm picked up I returned to new equity highs and beyond.
|
|
Registered User
Joined: 12/31/2005
Posts: 2,499
|
QUOTE (diceman)
"The trough seems to indicate market controlled whipsaws for those with there conspiracy generators running."
--------------------------------------------------------------------------
jas501
What do you mean exactly by market controlled whipsaws?
(random?) With the conspiricy gererator running does not mean rational thinking, that said, the trough appears to indicate that someone, the conspiritor's They, Them, controlled the dip to steal some "cheap" shares. The plot seems to indicate that the price generally recovers even when the price drops past the 2-8% zone.
A more rational explanation is that the strategy found a solid investment that has normal price swimgs large enough to cause 'tight" stoploss settings to be triggered.
Is the plot representing results a long and short strategy? That was a long only.
Were any (market,stock) timing/(market,stock) filters involved or were
all valid trades taken regardless of market/stock conditions? No, no market filters, though the study was done prior to the end of 08.
Thanks
diceman
|
|
Registered User
Joined: 1/12/2009
Posts: 235
|
QUOTE (davidjohnhall) DJH, what percent stops do you usually take? I guess you can reduce your share size depending on the length of the stop. Do you trade pull backs or break outs mainly? Do you find yourself getting stopped out less with wider range stops?
I have traded stops all the way from 5-50% because I wanted to see how I emotionally respond to all of them. I hate tight stops. Just can't trade them. 50% stops were for very volatile stocks and had a few trade down to -45% before shooting up to +100%. I am currently most comfortable with stops in the 25% range. These types of stops aren't for everyone, but for me they've meant the difference between a world of frustration and a new winning method.
Do I get stopped out less? Yes. Much less. But it's strange, now with wider stops I care less about getting stopped out. If I have a 25% stop and price trades down there and I get stopped out -- I gladly take it. If price turns around and rockets up, I can either get back on or let it go. It's weird, the whole widening of stops has made me a much more relaxed trader.
Typically I trade breakouts from consolidations, (pennants and triangles) and W bottom reversals. These are both patterns. And through my backtesting I have found that the entry is only part of the equation. How many positions you hold, your position size, the volatility of the stocks you trade, your exits, your method's expectancy, drawdowns, highest consecutive wins and losses, average consecutive wins and losses, all play very important roles. The great thing is you don't even need to know how to backtest to get these numbers. You can get it all from you live trades if you keep good records. At any point in time you can see how well your method is working or not.
Also, more and more I've been trading from weekly charts because I like the noise reduction and they just look cleaner to me. Here's a weekly chart of dig...
To me that just looks more relaxing. I can get in something like that near the breakout, set my stop below the nearest swing low (it's around $27), position size based on that, and see what happens. For me there is no better way to trade. Typically I will have more positions on, but that's okay. When I sense the market getting a little dicesy I protect my portfolio with a hedge.
A final thing to note is drawdown. You can expect a drawdown in line with how much you are risking. If my stops are at 25%, then i can expect my system will have a drawdown that deep. In fact, when I was trading larger stop losses my entire equity suffered a "controlled" drawdown of over 30%. The important thing is to trust your method and I knew this going in. As the syetm picked up I returned to new equity highs and beyond.
Thanks for sharing this. No disrespect or anything but a 25% stop seems kind of insane. Something that drops that low, how would one know if it will come back up? I suppose if you have a stop that wide then you can adjust your position size accordingly by taking the percentage of stop loss to position size. I guess it works out the same. I also like your idea of trading the weekly chart as it reduces noise. You have given me food for thought. I have found recently that by adjusting my stops or giving the stock more room to run I get stopped out less. It normally means taking less shares but it all adds up. I assume volume also plays a factor in your trades. Going down on heavy volume or up as to when getting out of the trade might be best.
|
|
Registered User
Joined: 6/6/2005
Posts: 1,157
|
Hey Traderm,
No disrespect taken at all. If 25% stops seem insane to you then they seem insane to you. I never try and tell someone what they should be thinking. Your statement is a true statement to you.
The main goal for me has been net profitability. I have never limited myself as to what I will try or accept as a possibility to achieve net profitability. So somewhere along the way I got the idea that I would just test anything and wider stops were on the menu. When I saw the results I decided to pay closer attention.
Then I tried them with a full position of course I was not happy becuase the size was too big. Then I decided index confirmation was needed. And it all worked out. Well, sort of. I was only somewhat happy because now I was bored. Wide stops means once I have my positions on I'm not doing anything. So i decided to short term trade a small portion of my equity just so I could stay active and involved. That works for me.
The thing is you never know if something is coming back up. And I realized that that type of prediction was not part of my trading. i had a method. i knew there would be a certain amount of winners and losers and that over time the net was supposed to be positive and I could have no idea which was going to be which at the signal level. It was and is just my job to take signals.
All i can do is have a system or method and apply different parameters and see what works best. What works the best, even if it appears crazy, is what works the best. I don't think it's up to me to question why it works the best -- i think it's up to me to open my mind as far as possible so i can accept that it works the best.
You also have to look at time frame. How long you're willing to hold a trade. If you're day trading or carrying trades over 5 days or so -- 25% stops don't make much sense. In my trades holding over a few days I'll be looking at 15 - 60 minute bars and using stops based on the volatility over those time frames. Still, my stops are pretty wide there -- about 5-10% which is wide for an intraday time frame. But again, works for me.
Regarding volume -- the only way I really use it lately is at exhaustion points. If a stock is careening down and I think one day it'll make a great reversal candidate -- then I wait for that high volume climax as everyone sells out. Then I just wait for the higher lows.
Or if a stock is going parabolic and there is a row of wide range bars one after the other and volume is 4-6x average I am going to be looking for an exit or at least partial exit.
In the end you have to temper what works for you with what works. And your profit targets have to be in line with your stops. I can create a system that has 2% targets and 25% stops and it will have a 85-90% wins -- but what about the 10% of times the 25% stop is taken out -- you will need more than 12 wins to get that back.
That's why I like to look for stocks at trend reversal areas where I can get in early.
David John Hall
|
|
Registered User
Joined: 2/27/2005
Posts: 59
|
I have just joined this discussion. DJH I've really enjoyed your line of reasoning. Could you tell me what you are using to simulate the trading patterns you graphed. For what it is worth, I've built my own simulator over the last few years and I spend an enormous amount of time looking at exit strategies. My results point me to trailing stop losses that are in the 15%+ range for momentum stocks. I don't have enough real life experience as a trader to support any trailing stop loss...and I fear it's a difficult real life test to truly understand if one or another trailing stop loss is the best. But my backtesting points to wider stops as producing better results compared to tighter stops. I would be happy to try to share results with you or others...but not sure how to do it in the forum format.
|
|
Registered User
Joined: 6/6/2005
Posts: 1,157
|
Hi Marc, thanks. I have been using Ameritrade's strategy desk. You have to do a lot of work on your own to analyze the results, (for some reason they decided to leave that whole part out of their backtester) but it's free if you have an account, so the price is right.
I agree with you on the importance of exit strategies, along with proper money management they can make or break a method.
Regarding forward testing, I usually go live with a test with a very small amount of capital. I'll take 10 trades and see how I feel. It's not the most scientific method, but those 10 trades will let me see if I am experiencing anything similar to backtested results. If I am I continue longer and apply a little more equity to the trades.
David John Hall
|
|
Registered User
Joined: 2/27/2005
Posts: 59
|
Thanks for getting back. The thing I wanted to discuss with you is how you handle small trailing stop losses. Let me explain. I use end of day data(OHLC)to perform my backtesting...again using a system that I have built. For a trailing stop loss (TSL) in the range of say 6% or better, I'm not concerned about intraday fluctuations. My program sets the TSL at the end of the trading day based on the close and looks at the next day to see if the stock either opened or had it's low below the TSL. If it had its open below the TSL then I sell at the open. If it opened above the TSL and then had a low below the TSL, then I sell at the TSL price. I believe that is a fair approach for stocks that I have held for weeks and months. The problem comes in when testing small TSL values. For example if I set the TSL at 2% then it is possible that the stock could have opened above the TSL, shot up 10% intraday (thereby establishing a new TSL on the way up ) and then dropped 15%. Because I 'm using end of day data, I have no way of knowing what 'path' the stock took from the open to the close. To try to solve this problem, I've tested using one half of the difference between the open and high and adding that to the sell price when the TSL triggers. That may be an approximation of the real world. Needless to say, adding that averaged amount to the TSL price has a enormous effect on small TSL percentages. So, my question is...do you know how to handles these intraday fluctuations and their effect on small TSL percentages any better than what I've described? Are you using end of day data or intraday data for your backtesting? BTW, I would be happy to share my results with you and others, but I don't know if they will post here properly. Are there ways to post spreadsheets and the like to the forum?
|
|
Registered User
Joined: 1/28/2005
Posts: 6,049
|
MarcM
Not sure I understand your question.
Those who use EOD data typically do it because they
cannot trade or watch the market during the day.
If the stock runs up 15% during the day. You would not be
allowed to move up your stop.
(otherwise you could just daytrade and get out at the top)
Typically only EOD data can allow you to adjust your stop.
(if the stock runs up during the day, the stop stays the same)
Only the low determines if you were stopped out.
(if below then your stop was hit)
Thanks
diceman
|
|
Registered User
Joined: 2/27/2005
Posts: 59
|
My experience with trailing stop losses is different. I trade using Fidelity's system. Typically I use their Active Trader Pro. With Fidelity, I can establish a trailing stop loss at a particular percentage off the purchase price. Fidelity adjusts the trailing stop maintaining that percentage within the day if the stock moves higher. It's a real time adjustment as best as I can tell and effective within the trading day. I'm not a day trader, but I appreciate that I get the benefit of intraday moves to my advantage.
My backtesting system is another matter and it is based on historical end of day data. The system allows me to try various exit strategies including trailing stop losses based on percentages (similar to Fidelity). My backtesting works well for trailing stop loss adjustments when the stock is held for longer periods of time - say greater than 30 days. But the problem I was trying to define above deals with 'simulating' intraday moves that affect lower trailing stop loss percentages when all you have available is end of day data. My system currently penalizes results by only taking into account the open or the low being below the last trailing stop loss. It doesn't take into account the possibility that the stock may have hit a new intraday high and then dropped to the low. So I tried to average the intraday effect and account for that in the results.
I realize that there may be no solution to this; that the only solution is to be backtesting with intraday data...but that's not possible for extensive testing over long periods of time.
I hope this helps explain further.
|
|
Registered User
Joined: 1/28/2005
Posts: 6,049
|
Probably the only solution would be to look and test with
intraday data. (much more of a hassle)
I would look at it this way.
I would test EOD (without adjustment during the day)
The "real world" situation should be better for you.
Remember that its about probabilities and statistics
not necessarily exact returns.
Thanks
diceman
|
|
Registered User
Joined: 2/27/2005
Posts: 59
|
Thanks. What prompted my first response was the graph posted by JAS0501 on Oct 16, 2009. There he shows stop losses in the 2% range. And my question was how could he effectively simulate stop losses that low because of the intraday uncertainty that I mentioned above.
|
|
Registered User
Joined: 12/31/2005
Posts: 2,499
|
Backtesting for the most adverse choice is always safer than for the most advantageous choice. Assume the high preceeds the low and test that way. It it better to understate than overstate performance.
Also test with large "unrealistic" TSL's, you might be surprised, particularly if the stategy is selecting solid candidates.
Ages ago I suggested to Worden they provide one additional piece of daily data. It was to provide an indication as to which came first, the high of the day, or the low. Drawing candle stics and/or bars would be adjusted to "tilt" in the direction based on the O-H-L-C or O-L-H-C sequence. I thought it would be a great product differentiator. If this information was available it would help with your dilemma.
Exaggerated but conceptually
\ |
\ \ | |
\ \ | |
\ \ / | | |
\ / / vs | | |
/ / | |
/ |
/ |
Maybe someday.
|
|
Registered User
Joined: 12/31/2005
Posts: 2,499
|
QUOTE (MarcM) Thanks. What prompted my first response was the graph posted by JAS0501 on Oct 16, 2009. There he shows stop losses in the 2% range. And my question was how could he effectively simulate stop losses that low because of the intraday uncertainty that I mentioned above.
Those results were generated using TC-Companion. TC-Companion supports exit @price, so if a TSL is hit then the trade ends at the TSL price. Currently StockFinder does not support exit @price. TC-Companion take the least advantageous exit, so the profit target is 10% and the stop loss is 5%, with an entry of $100 and a daily H of $112 and a same day low of $93, TC-Companion would exit as $95 based on the TSL, not $110. Both exits would be evaluated and the least advantageous taken.
Maybe release 5 will support exit @price and provide a similar capability. One can hope.
The chart seems to indicate that tight stoploss setting in the 2% range is more profitable than 3-8% range for that test. It seems contradictory, but I saw this same pattern in many exit studies. I never took the time to investigate the 2% exists, to see if they were reentering again at a lower price, versus the 3-8% not having that opportunity, or if there was some othere explanation.
|
|
Registered User
Joined: 2/27/2005
Posts: 59
|
Thanks Jas0501. I agree with you that I need to test with the least advantageous approach. The program assumes the low hits first - not the high. Is that what you intended in you reply? So in my case it would have stopped out at the $95 as well.
|
|
Registered User
Joined: 6/6/2005
Posts: 1,157
|
Hi Marc,
I handle the matter you're discussing by not mixing up my strategies or time frames. If I have an EOD system then I do not move a stop loss up intra-day (even on a trailing basis). At the close the positions are evaluated and stop placement moves are trailed at that time or the very next morning. This, to me, is very important because I never want to jump the gun on a signal. I want to wait for bar completion. If I am trailing my stop losses during the day then I am trading a 3/4 day bar or a 1/2 day bar not a daily bar. My entire decision making process improved when I applied bar completion into my trading. If my trailing stop from the prior day is hit during the day that is a different matter than moving a stop-loss during the day.
If I am trading an intraday system (I do -- luckily I can open and close positions throughout the day from work) then I test on intraday data using Strategy Desk.
David John Hall
|
|
|
Guest-1 |