Registered User
Joined: 7/14/2009
Posts: 9
|
Hello everyone, I'm new to worden. I haven't been trading for very long and would like your help.I know a lot of us have different point of views but I was wondering if I can ask for your expertise which indicator works best for you?I'm also interested in which indicators for analyzing accumulation and distributions by smart money.I heard of TSV and BOP by a friend of mine... but haven't the slightest clue what he was talking about. please help.thanks
|
|

Registered User
Joined: 2/5/2006
Posts: 1,148
|
QUOTE (dannyegg) Hello everyone, I'm new to worden. I haven't been trading for very long and would like your help.I know a lot of us have different point of views but I was wondering if I can ask for your expertise which indicator works best for you?I'm also interested in which indicators for analyzing accumulation and distributions by smart money.I heard of TSV and BOP by a friend of mine... but haven't the slightest clue what he was talking about. please help.thanks
stockcharts dot com has a pretty good section on indicators and their uses. you should probably read that, for starters.
i use bop and moneystream as an accumulation indicator, and wilder's rsi to measure momentum.
|
|
Registered User
Joined: 7/14/2009
Posts: 9
|
funnymony, can you explain how moneystream and BOP is used?thanks
|
|
Registered User
Joined: 2/5/2006
Posts: 1,148
|
QUOTE (dannyegg) funnymony, can you explain how moneystream and BOP is used?thanks
The basic premise behind the bop is that the degree of buying or selling pressure can be determined by the location of the Close relative to the High and Low for the corresponding period (Closing Location Value). There is buying pressure when a stock closes in the upper half of a period's range and there is selling pressure when a stock closes in the lower half of the period's trading range. The Closing Location Value multiplied by volume forms the Accumulation/Distribution Value for each period.This can then be compared with the price chart of the underlying security to look fordivergence or confirmation.
The concept behind moneystream: volume precedes price. moneystream is a simple indicator that adds a period's volume when the close is up and subtracts the period's volume when the close is down. A cumulative total of the volume additions and subtractions forms the moneystream line. This line can then be compared with the price chart of the underlying security to look fordivergence or confirmation.
|
|
Registered User
Joined: 1/28/2005
Posts: 6,049
|
dannyegg
You may be interested in this:
Thanks
diceman
|
|
Registered User
Joined: 12/2/2004
Posts: 1,775
|
QUOTE (funnymony) The basic premise behind the bop is that the degree of buying or selling pressure can be determined by the location of the Close relative to the High and Low for the corresponding period (Closing Location Value). There is buying pressure when a stock closes in the upper half of a period's range and there is selling pressure when a stock closes in the lower half of the period's trading range. The Closing Location Value multiplied by volume forms the Accumulation/Distribution Value for each period.This can then be compared with the price chart of the underlying security to look fordivergence or confirmation.
Good post funnymony and seems to make sense. Sort of how I've always assumed that BOP was calculated. I've posted before on the training board, asking the moderators for some specifics on how BOP is calculated, but all they can do is provide the link Diceman gives in this thread. BOP as you know is prorietary and its formula is top secret.
Okay, back to your explanation (which by the way is about the best I've read considering that the actual formula is guarded). What you say seems to make sense but I've often noticed single day BOP indicators that just don't make sense to me...at all. I quickly flipped through some charts at random and came across a couple examples of what I think confusing:
VASC on 6/29: A huge down day with a horrific looking bearish candle, coupled with above average volume. Yet the BOP for that day is green and almost at top of screen.
FUQI on 7/8: Ugly bearish candle with price closing well into lower half and very high above average volume. Yet that day's BOP indicator is at top of screen.
Can you or someone explain what's in play that I don't see that would cause those high volume bear candles to be marked with very bullish BOP marks? My gut tells me it's something that only Mr. Worden knows:)
|
|
Registered User
Joined: 2/5/2006
Posts: 1,148
|
QUOTE (fpetry) QUOTE (funnymony) The basic premise behind the bop is that the degree of buying or selling pressure can be determined by the location of the Close relative to the High and Low for the corresponding period (Closing Location Value). There is buying pressure when a stock closes in the upper half of a period's range and there is selling pressure when a stock closes in the lower half of the period's trading range. The Closing Location Value multiplied by volume forms the Accumulation/Distribution Value for each period.This can then be compared with the price chart of the underlying security to look fordivergence or confirmation.
Good post funnymony and seems to make sense. Sort of how I've always assumed that BOP was calculated. I've posted before on the training board, asking the moderators for some specifics on how BOP is calculated, but all they can do is provide the link Diceman gives in this thread. BOP as you know is prorietary and its formula is top secret.
Okay, back to your explanation (which by the way is about the best I've read considering that the actual formula is guarded). What you say seems to make sense but I've often noticed single day BOP indicators that just don't make sense to me...at all. I quickly flipped through some charts at random and came across a couple examples of what I think confusing:
VASC on 6/29: A huge down day with a horrific looking bearish candle, coupled with above average volume. Yet the BOP for that day is green and almost at top of screen.
FUQI on 7/8: Ugly bearish candle with price closing well into lower half and very high above average volume. Yet that day's BOP indicator is at top of screen.
Can you or someone explain what's in play that I don't see that would cause those high volume bear candles to be marked with very bullish BOP marks? My gut tells me it's something that only Mr. Worden knows:)
i was just trying to give new guy a general explanation. as you say, wordens gives very little explanation of the actual theory behind bop. i'm assuming bop, in general, works the same way as other accumulation/distribution indicators, since it appears to have the same general shape as some of the other acc/dist indicators. as far as, what it takes to turn a single bar red or green, i would only be guessing, without seeing the actual formula. and as long as i'm getting good signals over a several bar time span, i'm not going to concern myself with it.
|
|
Registered User
Joined: 2/5/2006
Posts: 1,148
|
i could only guess that previous days price and volume action have some effect on the current days indicator reading.
|
|

Registered User
Joined: 3/21/2006
Posts: 4,308
|
One good way to uncover accumulation would be to look at volume patterns on a weekly chart. If you use a 5 bar moving average of price than it could help uncover smart money activity durring a down trend. This is an old trick that they use to build their position at bargain prices. BOP being what it is will not reflect this activity. If price action is used in the formula and price is going down then of course you will not see the accumulation. You might if you opened up the intraday charts and knew what and where to look for.
Below is a chart that I show to demonstrate my point. You can see that volume was sky high durring the down trend right before price found its bottom. BOP was in efective or negative durring this accumulation phase. If you google Volume Spread Analysis then you will find more information on this accumulation theory.
Good Luck.

|
|
Registered User
Joined: 3/21/2006
Posts: 4,308
|
One could use a custom date sort to find a downtrending stock and the use a linear regression line to find a positive slop on the volume indicator (avgv5). Not all down trending stocks are being accumulated. It is best to look for heavy volume and long AVTR on the candles (long tails is a sure sign of buying entering a candlestick).

|
|
Registered User
Joined: 2/5/2006
Posts: 1,148
|
what is the pink indicator?
|
|
Registered User
Joined: 3/21/2006
Posts: 4,308
|
Funnymony; The pink indicator is just a five bar moving average of volume (AVGV5).
I would like to make clear that I am only sharing my opinions and strategies that I use. I am not disputing or condemding the use of any indicator. As long as somthing works for an individual than to me that is all that matters. I only offer an alternative.
Apsll.
|
|

Registered User
Joined: 7/1/2008
Posts: 889
|
plunging prices and rising volume being a signal for accumulation is pretty counter-intuitive. Of course for every buyer there is a seller, but lower prices mean more people are willing to part ways at lower prices, and buyers only interested in buying at lower prices. (yes, this is stating the obvious).
I must say I am finding this VSA idea to be hard to believe.
Volume blows out at the bottom on a selling climax. Current research indicates that prices bottom because of an exhaustion of selling, not necessarily an increase in buying.
Example: stock is at equilibrium with a daily demand for 1M shares and selling of $1M shares. Selling picks up to 1.5M and prices drop. Eventually sellers are done, and amount to be sold is 0.5M per day, meanwhile buying is still at 1M per day. Prices bottom and reverse upward not because there is new buying demand, but because selling pressure is now less than buying demand.
When I see growth in volume and price growing, I'm willing to accept the obvious that institutions are accumulating. This is why price and volume divergences are valuable.
Just my 2 cents...
|
|
Registered User
Joined: 1/12/2009
Posts: 235
|
Good post Apsll. I notice how you seem to keep your charts clean and simple. Do you not use moving averages? Is BOP the only volume indicator you use? Simple is usually better.
|
|
Registered User
Joined: 3/21/2006
Posts: 4,308
|
How are you Traderm? I only use moving averages in a strongly trending market. Trend being the critical word here. It always cracks me up when I see that a stock has been trading sideways and folks will still talk about the relevance of the 60 or the 100 sma.
I do not use BOP or Money stream. I will sometimes use the weekly charts and look at TSV divergence.
Ben, like I have said; if what a trader uses works for them than nothing else needs to be said. I can tell by your statements that you do not fully understand VSA. My limited post above was in no way intended to educate folks on the merits or applications of the theory. I have traded successfully for many years using my theories on identifying accumulation patterns. Until they stop working for me then I will continue to do so while also continuing my pursuit of knowledge in this area. I have many threads on the subject that folks can research - Bonanza Bottom, Volume Spread Analysis... Just do a search of these topics on the forum or just google them.
Good luck..
|
|
Registered User
Joined: 12/31/2005
Posts: 2,499
|
One man's opinion...
BOP has not demonstrated much if any predictive value in doing 100's cpu hours of backtesting.
More no harm no foul. If you think it helps, that fact alone may be worth it. The placebo effect.
It is an exclusive Worden product distinction that many use.
|
|
Registered User
Joined: 2/5/2006
Posts: 1,148
|
QUOTE (jas0501) One man's opinion...
BOP has not demonstrated much if any predictive value in doing 100's cpu hours of backtesting.
More no harm no foul. If you think it helps, that fact alone may be worth it. The placebo effect.
It is an exclusive Worden product distinction that many use.
i use chaulkins money flow. but like all indicators, its not a holy grail, just a "piece" of the puzzle.
|
|
Registered User
Joined: 3/21/2006
Posts: 4,308
|
I need to make a correction on my July 14 (8:38pm) post. I said that "If you use a 5 bar moving average of price than it could help uncover smart money activity"
It should have read "If you use a 5 bar moving average on VOLUME and not a 5 bar moving average on price.. Also use Weekly charts..
Sorry for the typo.
|
|
Registered User
Joined: 12/2/2004
Posts: 1,775
|
QUOTE (funnymony) i could only guess that previous days price and volume action have some effect on the current days indicator reading.
Good point to consider. Also, I forgot to mention in initial reply that I have a hunch that block trades of a certain size are calculated somehow in the BOP formula. A 2,000 share block trade of a $50 stock would weigh significantly (good footprint of institutional or smart money activity), while same block size for a $1 stock would not, but might for much larger size block.
Another point I think might be relevant to other discussion in this thread...as stated in the official Worden explanation, BOP works best when combined with MoneyStream, i.e. if both are trending upward and/or located near max height in the window, then a more reliable bullish signal.
|
|
Registered User
Joined: 7/1/2008
Posts: 889
|
Thanks Apsll. I'll read more into it.
|
|
Registered User
Joined: 1/1/2005
Posts: 2,645
|
QUOTE (fpetry) I quickly flipped through some charts at random and came across a couple examples of what I think confusing:
VASC on 6/29: A huge down day with a horrific looking bearish candle, coupled with above average volume. Yet the BOP for that day is green and almost at top of screen.
FUQI on 7/8: Ugly bearish candle with price closing well into lower half and very high above average volume. Yet that day's BOP indicator is at top of screen.
Can you or someone explain what's in play that I don't see that would cause those high volume bear candles to be marked with very bullish BOP marks? My gut tells me it's something that only Mr. Worden knows:)
fpetry.
Usually, BOP behaves much like the Price Volume Oscillator of Period 16, which is an oscillator form of OBV. Please see the 08/25/08, 12:24:34 PM post at:
http://forums.worden.com/Default.aspx?g=posts&t=35116
In general, a large green (or red) volume bar will dominate the BOP filter output for 16 bars.
The symbols you observed had large green bars on:
VASC 06/26/09
FUQI 06/29/09 & 06/30/09
Thanks,
Jim Murphy
|
|
Registered User
Joined: 12/2/2004
Posts: 1,775
|
QUOTE (bustermu)
fpetry.
Usually, BOP behaves much like the Price Volume Oscillator of Period 16, which is an oscillator form of OBV. Please see the 08/25/08, 12:24:34 PM post at:
http://forums.worden.com/Default.aspx?g=posts&t=35116
In general, a large green (or red) volume bar will dominate the BOP filter output for 16 bars.
The symbols you observed had large green bars on:
VASC 06/26/09
FUQI 06/29/09 & 06/30/09
Thanks,
Jim Murphy
Wow, thanks for the insight Jim on how a large volume bar may affect BOP for next 16 bars. And makes good sense with those prior large volume days you point out for the two examples I gave. Very useful information to have. I think funnymony alluded to that possibility also. And seems to go straight to the heart of the official Worden explanation about single day or short term BOP marks not being as good of a short term indicator as quicker acting MoneyStream is, with BOP being more of a general indicator for quality level of a stock's move over a period of days or weeks.
|
|
Registered User
Joined: 7/14/2009
Posts: 9
|
thanks guys for your valuable inputs!And yes Apsll, it is I, danny. Thanks for recommending worden forum. the site, the people and the program is bar-none.
|
|
Registered User
Joined: 1/1/2005
Posts: 2,645
|
QUOTE (funnymony) The basic premise behind the bop is that the degree of buying or selling pressure can be determined by the location of the Close relative to the High and Low for the corresponding period (Closing Location Value). There is buying pressure when a stock closes in the upper half of a period's range and there is selling pressure when a stock closes in the lower half of the period's trading range. The Closing Location Value multiplied by volume forms the Accumulation/Distribution Value for each period.This can then be compared with the price chart of the underlying security to look for divergence or confirmation.
The concept behind moneystream: volume precedes price. moneystream is a simple indicator that adds a period's volume when the close is up and subtracts the period's volume when the close is down. A cumulative total of the volume additions and subtractions forms the moneystream line. This line can then be compared with the price chart of the underlying security to look fordivergence or confirmation.
funnymony,
What you have described under "bop" is the raw data of the Chaikin Accumulation Distribution Line. As stated above, BOP is similar to an oscillator form of OBV.
What you have described under "moneystream" is OBV. MS is similar to a modification of the Williams Accumulation Distribution Indicator. Please see the 11/01/07, 07:06:59 ZM post at:
http://forums.worden.com/Default.aspx?g=posts&t=26590
Thanks,
Jim Murphy
|
|
Registered User
Joined: 12/2/2004
Posts: 1,775
|
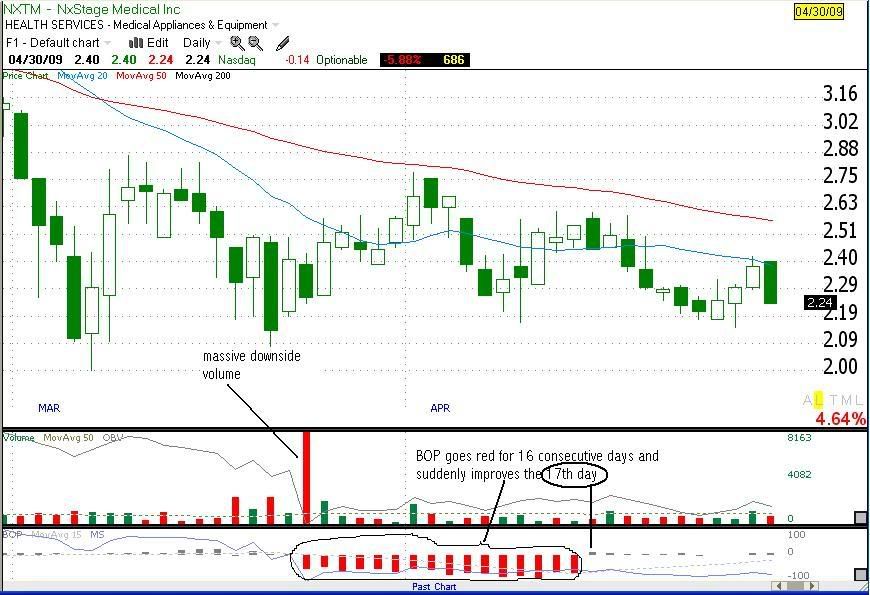
bustermu/Jim, since your post on the 16 bar BOP effect of single day high volume bar spike I've been perusing some random charts and darn if you don't seem to be dead on accurate. Here is a chart showing a one day huge relative volume spike to downside followed by 16 consecutive days of red BOP, with the 17th day suddenly improving. They say a picture is worth a thousand words.
|
|
Registered User
Joined: 2/5/2006
Posts: 1,148
|
QUOTE (bustermu) QUOTE (funnymony) The basic premise behind the bop is that the degree of buying or selling pressure can be determined by the location of the Close relative to the High and Low for the corresponding period (Closing Location Value). There is buying pressure when a stock closes in the upper half of a period's range and there is selling pressure when a stock closes in the lower half of the period's trading range. The Closing Location Value multiplied by volume forms the Accumulation/Distribution Value for each period.This can then be compared with the price chart of the underlying security to look for divergence or confirmation.
The concept behind moneystream: volume precedes price. moneystream is a simple indicator that adds a period's volume when the close is up and subtracts the period's volume when the close is down. A cumulative total of the volume additions and subtractions forms the moneystream line. This line can then be compared with the price chart of the underlying security to look fordivergence or confirmation.
funnymony,
What you have described under "bop" is the raw data of the Chaikin Accumulation Distribution Line. As stated above, BOP is similar to an oscillator form of OBV.
What you have described under "moneystream" is OBV. MS is similar to a modification of the Williams Accumulation Distribution Indicator. Please see the 11/01/07, 07:06:59 ZM post at:
http://forums.worden.com/Default.aspx?g=posts&t=26590
Thanks,
Jim Murphy
as i wrote before, i was only trying to give a general description of the mechanics moneystream and bop.
i never said moneystream and obv were exactly alike, only similiar.
this is right out of wordens online help:
The main difference between OBV and CMS is that CMS has a greater ability to contradict price movement than OBV does. This is achieved by using all of the elements within the daily price bar rather than just the close. The high, low, close and daily range are related to volume in a unique and proprietary way. You may wish to compare CMS and OBV in a variety of stocks and time frames.
sounds as though worden is saying they're similiar. if you overlay them, they act very similiar. draw your own conclusion.
and, i as i wrote earlier, very little iformation about the actual mechanics of bop is available. i can only assume bop is similiar to other accumulation/distribution indicators.
although, i'm really only concerned about whether indicators are giving good signals or bad signals, if you've got the formula's for bop and moneystream, lets see them.
|
|
Registered User
Joined: 3/21/2006
Posts: 4,308
|
Danny, glad to have you aboard buddy. You will find a very helpfull and knowledgable bunch of members here. If you want to know the iner workings of an indicator than Bustermu is about as smart as they come. He helped me to understand the nature of TSV a little more than I did. He might not know the exact formula for a given Worden indicator but he surely knows how they work.
Ask questions. We all love to jump in and give our opinions as you can see.
Let me know If I can ever be of some help for you to learn the Software.
Apsll.
|
|
Registered User
Joined: 1/30/2009
Posts: 267
|
Welcome Danny. Lots of great information here. Talk to you later.
|
|
Registered User
Joined: 1/30/2009
Posts: 267
|
QUOTE (funnymony) QUOTE (dannyegg) Hello everyone, I'm new to worden. I haven't been trading for very long and would like your help.I know a lot of us have different point of views but I was wondering if I can ask for your expertise which indicator works best for you?I'm also interested in which indicators for analyzing accumulation and distributions by smart money.I heard of TSV and BOP by a friend of mine... but haven't the slightest clue what he was talking about. please help.thanks
stockcharts dot com has a pretty good section on indicators and their uses. you should probably read that, for starters.
i use bop and moneystream as an accumulation indicator, and wilder's rsi to measure momentum.
Funnymony, what settings do you use for Wilder's RSI? My default is set to 14,1,simple. I am just curious if you have changed your settings or use default. I am asking because I have another friend that uses it (he doesn't trade, he just watches the markets) and I would like to learn more about it.
Thanks,
Hiromj
|
|
Registered User
Joined: 2/5/2006
Posts: 1,148
|
QUOTE (hiromj) QUOTE (funnymony) QUOTE (dannyegg) Hello everyone, I'm new to worden. I haven't been trading for very long and would like your help.I know a lot of us have different point of views but I was wondering if I can ask for your expertise which indicator works best for you?I'm also interested in which indicators for analyzing accumulation and distributions by smart money.I heard of TSV and BOP by a friend of mine... but haven't the slightest clue what he was talking about. please help.thanks
stockcharts dot com has a pretty good section on indicators and their uses. you should probably read that, for starters.
i use bop and moneystream as an accumulation indicator, and wilder's rsi to measure momentum.
Funnymony, what settings do you use for Wilder's RSI? My default is set to 14,1,simple. I am just curious if you have changed your settings or use default. I am asking because I have another friend that uses it (he doesn't trade, he just watches the markets) and I would like to learn more about it.
Thanks,
Hiromj
i use 14, simple also.
|
|
Registered User
Joined: 1/1/2005
Posts: 2,645
|
QUOTE (funnymony) ... if you've got the formula's for bop and moneystream, lets see them.
funnymony,
Thanks for your response.
Since MS and BOP are proprietary, the above are as close approximations as I feel it appropriate to supply. The same is true of the approximation to TSV I have previously supplied. Please notice that I only use known indicators as the approximations.
You will find the modified Williams Accumulation Distribution Indicator a much better approximation to Cumulative MS than is OBV.
Thanks,
Jim Murphy
|
|
Registered User
Joined: 2/5/2006
Posts: 1,148
|
QUOTE (bustermu) QUOTE (funnymony) ... if you've got the formula's for bop and moneystream, lets see them.
funnymony,
Thanks for your response.
Since MS and BOP are proprietary, the above are as close approximations as I feel it appropriate to supply. The same is true of the approximation to TSV I have previously supplied. Please notice that I only use known indicators as the approximations.
You will find the modified Williams Accumulation Distribution Indicator a much better approximation to Cumulative MS than is OBV.
Thanks,
Jim Murphy
you sharing your knowlege of these indicators is appreciated.
|
|
Registered User
Joined: 3/21/2006
Posts: 4,308
|
This is for Danny and Ben as well in referenve to accumulation and for Ben VSA.
Back in January of this year I posted about Goldman Sachs - GS.... I suggested at the time that I thought there were signs of accumulation. It was a nice example of a VSA accumulation bottom back then as high lighted by the extream volume bars during the down trend right before price found its bottom. Smart money knew back then what the score was and they align themselves properly. You can see that from January to now that price has more than double on this stock.
Right now when I look at the Bear ETF's I see accumulation (weekly charts). Take a look at the extream volume patterns. (IMO) this is a sign that once again smart money is aligning themselves with what they percieve to be the coming drop in market performance.
Below I have my post from January in reference to GS and then a chart of GS from December 30th (what the chart looked like at the time of my post). It was a thing of beauty and pure VSA....

|
|
Registered User
Joined: 3/21/2006
Posts: 4,308
|

|
|
Registered User
Joined: 7/18/2009
Posts: 5
|
This was some great info Aspll thanks
crystal
|
|
Registered User
Joined: 7/18/2009
Posts: 5
|
opps Apsll
|
|
Registered User
Joined: 6/8/2007
Posts: 31
|
Any one has simple one indicator ,giving good follow through????
|
|
Registered User
Joined: 7/1/2009
Posts: 97
|
Apsll,
Without studying up on VSA just now, it seems like a very interesting
theory. Indeed, whenever an upside (for example) reversal does occur
the smart money is said to have gotten in near the bottom and is ready
to sell to the retail trader near the top.
How would you distinguish, however, big volume on the way down
as a sign of institutional selling (IBD reference) compared to a
contrarian sign of accumulation?
|
|
Registered User
Joined: 3/21/2006
Posts: 4,308
|
Hi Mark.
Very good question and of course I only have theories. Even the material that I read in my research make that claim as well. I will say that before I even heard of VSA (Volume Spread Analysis) that I studied bottom reversal charts for years and came up with some of my own theories on accumulation durring these times and reading about VSA only reinforced what I thought to be true.
Your question is not about my theories so I will answere to VSA only. If you look at the chart (GS) above and focus on the mid September and early October candles (also the extreme volume on those candles) You will see that the range of the candles are wider than the average range for this chart. You will also notice that there are long wicks and tails.
I interpret the action in this way.... If the volume is way above normal than there is a good chance that there are more or bigger players involved in the buying and selling for that candle. Now if there is a long tail on said candle then at some point price was at the low of that tail and it took some buying pressure to move the price back into the body of that candle. There is a term called absorption buying and what that means is that smart money will hide there buying activity by buying into the sellers activity. Just enough that price will not be affected so much as to be noticed by the un-informed. Now do not get me wrong; I am not saying that every single stock is being accumulated when they are in a down trend. There have been cases where I thought that I saw signs of accumulation and I was wrong so one must always protect themselves. Also keep in mind that I do not subscribe to the IBD methodes so I will not speak to that.
I will close by saying that there is no proof that VSA, IBD or even my theories are viable. I can only tell you that I have had success with them.
Let me know if I did not answere your questions...
Good luck to you.
Apsll.
|
|
|
Guest-1 |