
Registered User
Joined: 4/18/2005
Posts: 4,090
|
How in Gods name is it possible to underperform a coin flip.
I made a few smal buys the other day
GDX, SSRI,
DAG, DIG
All were either a candle entry with good indicator profile though some were still technicaly in down trends holding their recent lows and sporting some positive divergent activity I aimed for a bit of a rally...
Others were higher up the slope of what ever the hell emotion. This has been consistantly happenign to me lately.
Someon else I know is trading a similar setup and his stuff seems to be mostly working out. SOMETHING has me consistantly picking the weaker stuff that won't work out. What is that?
|
|

Registered User
Joined: 10/7/2004
Posts: 2,181
|
Scott;
Your struggle is one of focus. You don't have one. You're frustrated by the inconsistency of your trading and you've decided that it's something about you. Well,that's a cheap way out; "It's not my fault, there are no good plans out there, none of them really work, it's just the fates." The only thing wrong with you is the way you think. Change that and you'll be successful.
You've decided you're not going to make it so you just throw your money at something.
You need a trading plan. Everytime I've said that you have responded with a long dissertation about how you already have one and then go on to explain the whole thing and how it doesn't work and it's not your fault.
Well, I don't see a plan; not when you're talking about underperforming a coin toss. You need to see it, Scott. You don't have a plan, you've never had one. But you need one or you should quit active trading and go to buy and hold.
Now the best thing to do is get really mad at me and prove me wrong. Don't tell me about how I'm wrong because I don't care to hear about it. I'm going to keep being profitable because I've decided to be, not because I'm better than you. So don't tell me, just show me. Better yet, show yourself.
your friend,
tobydad
|
|

Registered User
Joined: 3/21/2006
Posts: 4,308
|
Scott I am with TB on this one. I have been having nothing but success during this triangle pattern that the markets are in right now. I have been reading about your frustrations on both forums, I am sorry buddy but I think that it is time for you to take a break. It is almost like if you just traded the opposite of what you have been trading than maybe you would have success. You always seem to be in the right place at the wrong time.
I wish that there was a way that I could help you but you never stick with anything long enough to see if it will work. You have been at it with all of us giving you advice for four years now and you are actually having worse results.
You are a great person but I am just not sure that you are cut out to trade.
What ever you decide, I wish you luck buddy.
Another one of your friends,
Apsll.
|
|
Registered User
Joined: 10/7/2004
Posts: 264
|
Scott,
If your game, rather than go into a long dissertation about having a plan and following a plan, lets look at the above trades in detail.
Where did you enter? Why? Where was your stop? Why? What was your target or expectation? What was your exit price.
|
|
Registered User
Joined: 9/25/2007
Posts: 1,506
|
QUOTE (Golfman25) ... lets look at the above trades in detail.
Where did you enter? Why? Where was your stop? Why? What was your target or expectation? What was your exit price.
Scott ...
I think that what Golfman has proposed is an excellent idea ...
My approach was similar to what tobydad has said ...
Only my approach was along the lines of an ISO 9000 quality program ...
What did I do ? Why did I do it ? What did I do right ? What did I do wrong ?
It didn't matter at all whether the trade was a profit or loss ...
From that ... I'd issue a CAR (Corrective Action Report) to modify the "rules of engagement" ... so to speak ...
As the CARs mounted in number ... it seriously limited the qualifying trades ...
But it drastically improved the ratio of winning trades ...
So ... don't worry at all about what others are doing "right" ...
Take advantage of the forum to analyze what you are not doing right ...
Just my very humble opinion ...

|
|
Registered User
Joined: 3/21/2006
Posts: 4,308
|
Scott just focus on your school and getting your Degree. You have a little one to take care of...
|
|
Registered User
Joined: 12/31/2005
Posts: 2,499
|
[QUOTE=scottnlena]How in Gods name is it possible to underperform a coin flip.
.....
[QUOTE]
That is the nature of the beast anyway with commissions.
That said, my impression of your trading style, having followed your posts, is that you "think" it should work because you find many many fine examples where the pattern succeeds. You are an optiist and this empowers you to act on your impression. Statistically the pattern you 'think"/"feel" is so good often is not and is little better than a coin flip.
Take a break. Take some time off, then forensicly review your last 50 or 100 or 200 trades positioning the chart to be at the setup and look at the context. Scroll forward and look at the trade.
How many different patterns/approaches are represetned by these trades? Is your plan fixed or on casters?
How many changes did you make in your plan or plans?
How disciplined/impulsive where the executions?
Look at the wins collectively. Look even closer at the losses collectively. Do any trading behavior patterns emerge?
If you can, look at the strategy you had a year ago or 2 years ago and backtest it from then to now. If it performed well and you didn't then figure out why. If it didn't then neither could you.
Look at the time spent and the net gain/loss and the sleep lost and the stress to you and your family. Take a long look in the mirror, be honest, Is it worth the aggravation and the money? Would your wife agree?
|
|
Registered User
Joined: 4/18/2005
Posts: 4,090
|
QUOTE (tobydad) Scott;
Your struggle is one of focus. You don't have one. You're frustrated by the inconsistency of your trading and you've decided that it's something about you. Well,that's a cheap way out; "It's not my fault, there are no good plans out there, none of them really work, it's just the fates." The only thing wrong with you is the way you think. Change that and you'll be successful.
I wish that were true. but I don't believe it honestly. I don't think many people would have been through what I have in teh market and kept at it.
You've decided you're not going to make it so you just throw your money at something.
Tobydad your a great guy but that is not correct.
You need a trading plan. Everytime I've said that you have responded with a long dissertation about how you already have one and then go on to explain the whole thing and how it doesn't work and it's not your fault.
Intregral part of the tradign plan is a strategy that works well enough on a consistant basis, or my understanding of when to change things to be proffitable. I have a plan... but it's stuck at teh "get proffitable trades coming in consistantly.
Well, I don't see a plan; not when you're talking about underperforming a coin toss. You need to see it, Scott. You don't have a plan, you've never had one. But you need one or you should quit active trading and go to buy and hold.
As far as I can tell that is worse.
Now the best thing to do is get really mad at me and prove me wrong. Don't tell me about how I'm wrong because I don't care to hear about it. I'm going to keep being profitable because I've decided to be, not because I'm better than you. So don't tell me, just show me. Better yet, show yourself.
Love to.. not shure where or how and if I were I'd have done it by now. I've spent more time not doing well than I have doing well at this point.. and I'm staring starting capital in the face.
your friend,
tobydad
Thanks I do apreciate yoru coments.
I started the year with an attempt at trend following.. ALL 6 first entries were considerable losses. I realized quick i'm not for that.. maybee intra day but not EOD .
from 1/7 to 1/13 I was short the market and takign losses except C which was drowned in small stop outs. 1/20 I"m trying to get long again.. mostly stopouts except for a hand full of the above still open but nothing spectacular NO winners (well GDX is tiny) all loosers, All taken for a reason and considered.
I'm now trying to get some short on.... taking it there also. I anticipate that we'll break down again and I thought it was coming the other day..
I dunno. Maybe I don't know what you mean at all. What is a trading plan? To me it's trade a proffitable stategy long in up or suspected ralley periods and short in falling or breakdown periods. Not to wide a stop for risk controll. Let proffits compound to a target and move to phase b.. remove portions from market risk exposure and start over with a smaller amount again.
But 8 wins and 21 losses with avg gain of 62 and average loss of 72 I'll be gone pretty quick. 15 of those 21 trades were short and opened around 1/7. True we were in a consolidation but how could you know then that it wasn't a pullback and continuation and on the index that was a decent trade that would have unfolded. I tried to enter SSO short but the order didn't fill. The two that did fill stopped out.
|
|
Registered User
Joined: 4/18/2005
Posts: 4,090
|
QUOTE (Apsll)
Scott I am with TB on this one. I have been having nothing but success during this triangle pattern that the markets are in right now. I have been reading about your frustrations on both forums, I am sorry buddy but I think that it is time for you to take a break. It is almost like if you just traded the opposite of what you have been trading than maybe you would have success. You always seem to be in the right place at the wrong time.
I wish that there was a way that I could help you but you never stick with anything long enough to see if it will work. You have been at it with all of us giving you advice for four years now and you are actually having worse results.
yea I noticed that. But I've been trading the same thing for almost a year after the thign that was working so well. I hate hearing that I don't stick to stuff. All I've traded for the last several months is the reversal. Someone else is trading it and it's working well for him. With a minor modification that I can't implement. but still.
it got ok results in the up swigns but the last three days after the trading range broke down it wipes out my gains for the previous month or two in 3 days. That happened a few tiems. Tell me how long should a person stick with a loosing strategy before trying to fix it. 1 year ? ? 10 years? ? what do you think?
I traded and stuck with the Trifecta strategy that got EXCELLENT results (may have just been the market) but I stuck with it up and right back down again. rode it up more than 10K in proffit for my account then roce it back down for 1/2 proffit given back ... hjow much longer should i have traded it to let it work? When I stopped trading it it was before teh middle of 2007. Later the scan for that strategy would return ZERO items for months on end. But stocks are moving.. there is oportunity there. I should have known to sit out the next two years or more and wait? Or look for a new way to find an oportunity.
I dunno. I had something that worked and it suddenly for some reason didn't.
You are a great person but I am just not sure that you are cut out to trade.
do us a favor and don't say that again.
What ever you decide, I wish you luck buddy.
Another one of your friends,
Apsll.
|
|
Registered User
Joined: 4/18/2005
Posts: 4,090
|
QUOTE (Golfman25) Scott,
If your game, rather than go into a long dissertation about having a plan and following a plan, lets look at the above trades in detail.
Where did you enter? Why? Where was your stop? Why? What was your target or expectation? What was your exit price.
GDX is still open 1/29 was an engulfing whit and another candle pattern strong volume adn possible inverted head and shoulders. Considerable noise happening in gold stocks and I dislike the gappy nature of GLD . got in the next day with a buy stop limit that filled at 35.13. Looking at the bigger picture the movine averages that I like that have served me well in the past are in an up trend mode and the few indicators I use are in a positive profile. TSV MS RS vs SPY and Sub IND ADX. Generaly speaking up trend good profile and a fundamental reason to suspect gold to perform better. Stop was low of that bar.
That is actually possibly stating to work out.
Still open and flondering. Corelated trade 1/2 size of GDX similar reasons but this time I bought a breakout. Above the high base of 2/4 Stop is 18.35 and same as above for indicator profile Both are basicaly a trifecta type approach. Targets on both are over head resistance but exit is a trailing stop incase it goes much further.
DIG is in a down trend but Like I traded DUG I thought I saw a move in DIG coming. bouncing out of this lower range. Modification however is that DUG didnt' net me that much money becasue of bottom fishing trying to catch the bottom. That isn't the issue here so much as taking the reversal trade at the consolidation low. I intentionaly let a few go because I began to question it but mainly because of the early entry stop outs in DUG I learned my lesson .. save money and let it test the bottom a few tiems at least. R:R was good with a tight stop. I missed the actual reversal day on 2/3 or my order didnt' fill the next day but I did catch the engulfing on 2/5 with a primary target of the top of the consolidation but hoping for the breakout. Stop 25.65 moved it to the low of 2/11 and it got hit..To soon or just a weak play.
Was an inside day .. strong sector and a surge of volume coming in . good moving averages and indicator profile. I've passed up several of these and they moved .. Weekly view had a great Moneystream profile and I took the trade expecting it to cut through resistance like man of the healthcare and biotech companies are. I skip tons of these and watch them work out till I decide to get in one. Silly. I generaly hate that sort of thing but I must admit that breakouts do in some sense work out... Here I had a trend in motion with a pause of a few days and an inside day. I took it.
Still open see DIG for reasoning. Stop is 8.45 and I suspected it to be a rt shoulder I was entering. That actually was my reversal entry.
| QCOR |
2/11/2009 |
S |
$ 7.35 |
$ 1.00 |
Short. still open. The inverse of my pullback entry. New down trend entered on the hammer stoped out today. Stop was 7.66. No double higher lows and price in teh short sweet spot bouncing off the 15 day high with a bearish hammer. sold the break below.
pullback entry down trend and bouncing off the 10 day high after filling the gap.
Indicators look positive now compared to origianal analysis BUT TSV was a bit strong however I havent' found the super short tem of TSV to be that reliable. I let it slide because it filled the gap so energeticaly.
| PTRY |
2/13/2009 |
S |
$ 17.01 |
$ 1.00 |
Working out so now I gott a hang in there for more than 2 days hopefully there will materalize something signifficant tot he down side.
|
|

Registered User
Joined: 6/6/2005
Posts: 1,157
|
After looking at these stock picks, and reading the rest of the posts, I have my own theories, if I may.
1) What was working in a bull market (in my opinion) might obviously suffer in the worst financial crisis in a generation. However, if you've had a drawdown, and it is less than 40% (and I believe Scott's is), then (in my opinion) you are still beating the general market and buy and hold investing. Maybe that's looking at things through rose colored glasses, but there are traders out there who have lost their life savings.
2) How long do you trade a system before you call it quits? My guess would be until you start to move out beyond normal distribution. That's why (in my opinion) if you trade a system you need to know things like biggest drawdown, largest loss, max consecutive losses, average win, average loss, proper position size based on expectancy.
Even if you're not trading a system you can still get those numbers based on your own historical performance and essentially substitute yourself for the system.
Now the question becomes, are you trapped in a string of losses that is acceptable for your system or not?
After Scott posted his coin-flip analogy, I did a little experiment. Assuming that trading is about beating a coin-toss which it is not (the goal is to make money. Trend following system perform at about 30% win rate which is far below a coin-toss). Anyway -- I actually flipped a coin 50 times. The results were:
Heads 23
Tails 27
Or it might have been the other way around. In my mind that's pretty close to random. But during the test there were several instances where heads came up over 5 times in a row. And tails came up over 5 times in a row.
So the question to me at least should be not "how long I you stick with a losing strategy?" because the answer to that question should be zero days. Instead, the question should be, "How do I determine if my strategy is a losing one?"
I don't know how other traders here do it but I like to look at expectancy. Even if you're not trading a system you can look at your trade history and calculate if you have a positive expectancy.
Take your last 100 trades.
Take the average amount you win when you're right and times it by the % times you're right.
Now take the average amount you lose when you're wrong and times that by the % time you're wrong.
Now subtract #1 from #2
Is this number positive or negative?
If it's negative you will slowly drain your account down to zero and should question your method and hopefully look to fix it.
3) Emotional control in the market (at least for me) is job one. I don't know if this comes from experience, or from trying to will the market in your direction long enough to have gotten frustrated enough to realize that you take what the market gives and you adjust your expectations accordingly. And I think that what the market gives is in direct relation to how little you "need" it.
I don't know if everyone has had those table pounding, keyboard throwing moments at the market. My early trading was riddled with them. I always seemed to be asking "What's wrong with me", "Why can't I get this?" "Why is the market messing with me?" Just because I wanted something so badly didn't mean that I would get it. After awhile it seemed like every trade I put on was a huge loser. At which point I would revert to a stomping, yelling 5 year old that didn't get the right toy for Christmas.
It was only after I quit trading for 6 months (might have been 12 months), started testing, and let go of everything that I thought "should" happen -- which included money flowing into my account -- did I begin to design a style of trading built around my personality.
I can remember my first day back. All I wanted was to make 1 point. That's it. And I got it in AAPL. From 69.77 to 70.85. Looking back, it seems that I was still missing the bigger picture because 1 point from 1 trade in the middle of any trading career should hold no statistical significance whatsoever, but it was a big morale booster.
What had I learned? I had learned to find the one set up that appealed to me the most. Not the secret set up. Not the golden set up that was never wrong. But one I could trade on a time frame I could trade. And I began to master it and amazingly trades began to work out.
I have once heard it said that trading systems are not meant to generate money, but to curb psychological weaknesses. I couldn't agree more. There is an endless stream of opportunity in the market. This is not the same as guaranteed income. You need a structure that will hold back the many weaknesses that crop up when facing that endless stream of opportunity and loss.
4) Looking at these trades I see...
SSRI - overextended. Up over 100% since the bottom. Nothing wrong with this, but you can expect consolidations which is what we're in now. If you enter during a consolidation phase in order to get a jump on a breakout, then you have to expect you're going to get chopped around.
DIG another consolidation. I think the ultimate resolution is to the upside but it hasn't made a move either way out of it's channel. I think it's important to look at the time frame of your trades as well. And what type of trade you're putting on. If this is a long term trend trade then your capital would be best served waiting for a breakout in either direction.
SQNM - seems like a late entry into the move. The break from the bottom occurred on 12/12 and a continuation breakout on 01/05. The pullback entry (if that's your style) was on 12/30. If the trend would have continued you would have been fine. It didn't and so the trade was a loser. Sometimes that's all there is to it.
DAG - simply no follow through.
QCOR - you know, looking at these charts (and it could just be me) but I don't see any symmetry to the trades. And I think this is what tobydad may have been referring to (my apologies tobydad if you weren't).
If you have one trade that you master (in the beginning) then all of your charts will look the same. I could be wrong here, but that's what started helping me. When I printed up the charts of all the stocks I'd traded (like jas suggested) and saw that the winning charts all looked the same and I seemed to favor a particular pattern (the continuation trade -- usually after a first thrust from the bottom) then all of my charts began to look the same.
Chart after chart I would see bottom, first thrust, consolidation, trade. Bottom, first thrust, consolidation, trade. I began to know what my trades looked like when they worked and what they looked like when they didn't. I began to know what a string of losers looked like and felt like and the same for winners. But most of all I began to know myself.
I see the same thing here on the Board. APSLL seems to look for the same thing time and again (accumulation off the bottom). Tobydad seems to favor pullbacks after a thrust. Bigblock uses the same indicators in the same way. Funnymoney favors traditional patterns and never strays. I myself like continuations and classic breakouts.
As a final thought, I might just be drawing false associations here, but I see that many of these trades seem to be made inside of consolidation periods when I think you would be better served to wait for a return to momentum on one side or the other.
Well, this has certainly been long winded. My apologies for the (many) personal references but it's the only way I can relate. And as always, this is all just my opinion. And only offered in the hope of helping another gain insight by reading something that he might connect with.
David John Hall
|
|

Registered User
Joined: 7/1/2008
Posts: 889
|
excellent post David John Hall. Excellent.
|
|

Registered User
Joined: 2/5/2006
Posts: 1,148
|
i'll be very short winded.
candle entries? lol
|
|
Registered User
Joined: 3/21/2006
Posts: 4,308
|
David, I agree with Ben; very good post.
Like Tobydad said: You can get mad at me if you want to; SQNM is the only example I need to deal with. On 1/20/09 price was stalling at Resistance and you are "gambling" that price will break through based on the indicators, so you went long (your words). I have been telling you for a couple of years now that this is a losing game and that you have to either wait for price to break the resistance or at least have some distance before resistance to make a small profit. You are under no obligation to listen to my advice of course but that is why SQNM was a bad trade (you did not wait for confirmation).
Davidjohnhall said: If you look at the stocks that folks play then you will see that they tend to look the same. You play them long enough and the outcome is almost self evident. Most of the time. I can see no correlation from one of your charts to the next. I usually do not agree with your picks and if I do then you do not play them anyway. It is difficult to help someone or give advice when you have no clue as to what they are thinking and why, or you see them making the mistakes over and over again even though I have warned you about them over and over.
Sorry if I was to honest with you, and I am no Guru but these are my observations.
|
|
Registered User
Joined: 10/7/2004
Posts: 264
|
Scott,
I'll need some time to go thru your trades. Before I do, keep this in mind:
There are 2 things that a consistent looser does
1) Buys at Resistence/Supply
2) Sells at support/Demand.
How many times did this happen in your referenced trades?
Also, get rid of all you "indicators" -- TSV, Macd, Stochs, MS, ect. They are all BS. They are only good for "analysis." But have absolutely no relevence for trading. IMO they are clouding you judgement.
Clear your charts of everything but price (even volume). Maybe keep a couple of moving averages, but that is it. I'll be back later to review the trades.
|
|
Registered User
Joined: 10/7/2004
Posts: 264
|
GDX: I can live with the bullish engulfing as an entry signal as it is after 3 down days and off the 20 SMA. You don’t give your stop in numerical form, but it sounds like the low of some bar – the Bull engulfing bar? – which is $32. (As an aside, you might want to get a lot more specific with your numbers – as good traders keep good records.) I would certainly have it below the 20 SMA at 31.71. My only concern would be the 200 SMA acting as resistance, which it did 3 times before breaking above. All in all, it looks like this will work out with an initial target at 40ish and another at 46ish. I’d trail a stop just under the 20 SMA.
SSRI: I have no clue why you would make this trade. I see no breakout. I see lateral consolidation along the 200 SMA. I see resistance at the 23 area and the 26 area. This isn’t in a buying area until a pullback to the 50 SMA.
DIG: First, there is no bull engulfing on 2/5. Bull engulfing has to happen after a down trend. At best this is a box play with 24.75 support ant 34 resistance. You’re in right between the numbers at 29.50. Your stop was right ABOVE support, and got taken out. Look at the tail on the candle on the day you where stopped out. The most important comment you made was: “I missed the actual reversal day on 2/3.” That is right – When you miss the entry, stay out of the trade. IMO, your forcing trades here and got nicked.
More to come later.
|
|
Registered User
Joined: 4/18/2005
Posts: 4,090
|
you know this is actualy helpful.
My charts don't look the same. Interesting. yea.
Most of my trades are pullbacks but prior to this I did well with I guess what you would call a continuation... buys came from an up trend.. already established.. no bottom hunting and either a pattern if i could recognize it or candle patterns...only about 4 that I used. Engulfing patterns and such.. and those were really more something to fix on.
In terms of buying at resistance and selling at support. That is the basic breakout strategy right? I"m a little confused there.. I used to skip trades left right and center because of support and resistance and I fount that prices were slicing right through some times and not getting close others. NOT that I totaly discounted resistance but I fugured I was to picky.
I must admit that I've already started drifting back to the "continuation" type of trades IE stocks in trends that are comign out of consolidations and giving a buy signal interms of a candle pattern that I like. SO I've traded less of the pullback thing this year.. used it for a sense of timing.
Which is odd thta it seems to work ok BUT it dosen't result in proffit for me. The pullback that I'm starting to loose confidance in is a purchase at support usualy OR a pullback in a trend. I won't have time to get a picture in but it dosent require indicator confirmation but I started adding it as a requirement to help get twards "strength".
|
|
Registered User
Joined: 4/18/2005
Posts: 4,090
|
QUOTE (Golfman25)
GDX: I can live with the bullish engulfing as an entry signal as it is after 3 down days and off the 20 SMA. You don’t give your stop in numerical form, but it sounds like the low of some bar – the Bull engulfing bar? – which is $32. (As an aside, you might want to get a lot more specific with your numbers – as good traders keep good records.) I would certainly have it below the 20 SMA at 31.71. My only concern would be the 200 SMA acting as resistance, which it did 3 times before breaking above. All in all, it looks like this will work out with an initial target at 40ish and another at 46ish. I’d trail a stop just under the 20 SMA.
SSRI: I have no clue why you would make this trade. I see no breakout. I see lateral consolidation along the 200 SMA. I see resistance at the 23 area and the 26 area. This isn’t in a buying area until a pullback to the 50 SMA.
Well I put an order just above the high of the little consolidation. You'll see it if you plot MAXH15 on the chart. price crossign that line was my buy signal. I've had good sucess with this sort of entry in the past.
DIG: First, there is no bull engulfing on 2/5. Bull engulfing has to happen after a down trend. At best this is a box play with 24.75 support ant 34 resistance. You’re in right between the numbers at 29.50. Your stop was right ABOVE support, and got taken out. Look at the tail on the candle on the day you where stopped out. The most important comment you made was: “I missed the actual reversal day on 2/3.” That is right – When you miss the entry, stay out of the trade. IMO, your forcing trades here and got nicked.
interesting I lever learned the prior requirement on bullish engulfing.. I just lerned it was a bullish signal, in this case I figured it wasn't to late to use that as an entry for the slightly weak looking and missed earlier signal. When I used candle signal entries I wasn't taht fussed about specifics but I considered it engulfing if the body engulfed or with in a tight margine engulfed the previous body or much of it's range.
More to come later.
|
|
Registered User
Joined: 2/21/2007
Posts: 797
|
hope you guys don't mind the intrusion. i'm hoping to learn something also. i figure since scott posted this on 2/10 he entered these positions on that day?
SSRI--- price turning horizantal-- volume down-- 8-3-3 stoch. turning--- looks more like a short
DIG --- total consolidation
DAG --- total consolidation --- super low daily volume --- only take a long position--- never short
GDX --- continuation of an uptrend after a short pullback --- wait for next pullback to enter
if anyone has time, please give your opinions of my analysis.
|
|
Registered User
Joined: 4/18/2005
Posts: 4,090
|
johnlc dates are posted next to the issues. Welcome.
I owe this to Tobydad..... I think I see what you mean by my charts are all over the place. I didn't realize it hearing that bit on DJH's thread about charts looking considerably different was a bit of a wake up call. Yea I have gotten away from waht I had been tradign and drifting BACK to somethign that had worked well for me in the past.
Put simiply wether ther is validity to it or not IT worked like this and I made money whent eh marekt were moving
price greater than 50 EMA and 20-35-50 ema in an up trend profile with TSV and MS above zero.. anywhere in ther is see as the interest zone and an entry sought. Oh.. but not to chase prices too high also used the diceman to get things that weren't showing allot of momentum yet but were trendign up and maybee startign to show it .. also some breakouts from consolidations were bought.
That is all it was.
What I've been trading that was frustrating me most was this reversal off the chanels. To look at the trades in terms of signals Plot MAXH 15 and MINL10 on the charts.. no indicators thougth I tend to lean on the ones that have better indicators. I do sort by RS Vs spy and look for strength and weakness that way. Before you baptise it as a dud strategy it's really just an entry that I tried to build a strategy around. I'll also post one of it's winning streaks.
| 327 |
QLD |
11/10/2008 |
L |
$ 32.22 |
$ 1.00 |
130 |
11/11/2008 |
$ 29.28 |
$1.00 |
$ (384.20) |
| 328 |
UYM |
11/10/2008 |
L |
$ 19.42 |
$ 1.00 |
150 |
11/11/2008 |
$ 16.88 |
$1.00 |
$ (383.00) |
| 329 |
DIG |
11/10/2008 |
L |
$ 34.21 |
$ 1.00 |
85 |
11/12/2008 |
$ 28.80 |
$1.00 |
$ (461.85) |
| 330 |
SF |
11/11/2008 |
S |
$ 43.30 |
$ 1.00 |
90 |
11/12/2008 |
$ 42.02 |
$1.00 |
$ (117.10) |
| 331 |
TEO |
11/11/2008 |
S |
$ 7.20 |
$ 1.00 |
200 |
11/13/2008 |
$ 6.56 |
$1.00 |
$ (130.00) |
| 332 |
VLO |
11/11/2008 |
S |
$ 19.47 |
$ 1.00 |
200 |
11/14/2008 |
$ 18.81 |
$1.00 |
$ (134.00) |
| 333 |
CHL |
11/13/2008 |
S |
$ 43.78 |
$ 1.00 |
100 |
11/13/2008 |
$ 40.45 |
$1.00 |
$ (335.00) |
| 334 |
CATY |
11/14/2008 |
L |
$ 21.81 |
$ 1.00 |
80 |
11/18/2008 |
$ 18.12 |
$1.00 |
$ (297.20) |
| 335 |
NYX |
11/14/2008 |
L |
$ 27.29 |
$ 1.00 |
95 |
11/17/2008 |
$ 24.25 |
$1.00 |
$ (290.80) |
| 336 |
CAL |
11/14/2008 |
L |
$ 12.98 |
$ 1.00 |
100 |
11/20/2008 |
$ 11.02 |
$1.00 |
$ (198.00) |
| 337 |
DIG |
11/14/2008 |
L |
$ 33.49 |
$ 1.00 |
35 |
11/19/2008 |
$ 28.14 |
$1.00 |
$ (189.25) |
| 338 |
QCOR |
11/18/2008 |
L |
$ 8.79 |
$ 1.00 |
200 |
11/20/2008 |
$ 7.77 |
$1.00 |
$ (206.00) |
| 339 |
STP |
11/19/2008 |
S |
$ 7.10 |
$ 1.00 |
100 |
11/20/2008 |
$ 9.67 |
$1.00 |
$ 255.00 |
| 340 |
PEC |
11/20/2008 |
S |
$ 10.40 |
$ 1.00 |
125 |
11/21/2008 |
$ 9.50 |
$1.00 |
$ (114.50) |
| 341 |
OMRI |
11/20/2008 |
S |
$ 19.01 |
$ 1.00 |
100 |
11/21/2008 |
$ 16.75 |
$1.00 |
$ (228.00) |
| 342 |
CATY |
11/24/2008 |
L |
$ 18.40 |
$ 1.00 |
85 |
11/25/2008 |
$ 20.06 |
$1.00 |
$ 139.10 |
| 343 |
PII |
12/5/2008 |
S |
$ 27.53 |
$ 1.00 |
75 |
12/5/2008 |
$ 27.38 |
$1.00 |
$ (13.25) |
| 344 |
GEL |
12/5/2008 |
S |
$ 9.20 |
$ 1.00 |
150 |
12/12/2008 |
$ 8.71 |
$1.00 |
$ (75.50) |
| 345 |
PII |
12/10/2008 |
S |
$ 26.79 |
$ 1.00 |
75 |
12/12/2008 |
$ 27.17 |
$1.00 |
$ 26.50 |
This is an EOD strategy and the entry date is the day after analysis. Red S is a short trade order is ticker date in , long or short, buy price and comission quantity, date out, sell price and 2nd 1/2 comission. These are all the reversal trade I've been trying to focus on and gettign frustrated with. some short versions and some long versions.
|
|
Registered User
Joined: 4/18/2005
Posts: 4,090
|
A winning streak. some positions had pyramids and that is a different entry
| ECOL |
8/8/2008 |
L |
$ 31.37 |
$ 1.00 |
200 |
8/11/2008 |
$ 31.06 |
$1.00 |
$ (65.00) |
| ECOL |
8/11/2008 |
L |
$ 31.39 |
$ 1.00 |
200 |
8/15/2008 |
$ 32.75 |
$1.00 |
$ 270.00 |
| ECOL2 |
8/11/2008 |
L |
$ 31.74 |
$ 1.00 |
100 |
8/15/2008 |
$ 32.75 |
$1.00 |
$ 99.00 |
| DSX2 |
8/11/2008 |
L |
$ 30.10 |
$ 1.00 |
100 |
8/12/2008 |
$ 29.71 |
$1.00 |
$ (41.00) |
| DSX |
8/12/2008 |
L |
$ 30.15 |
$ 1.00 |
100 |
8/15/2008 |
$ 31.60 |
$ - |
$ 144.00 |
| JRCC2 |
8/12/2008 |
S |
$ 32.31 |
$ 1.00 |
100 |
8/12/2008 |
$ 31.77 |
$1.00 |
$ (56.00) |
| JRCC |
8/13/2008 |
L |
$ 33.64 |
$ 1.00 |
50 |
8/15/2008 |
$ 35.00 |
$1.00 |
$ 66.00 |
| OMRI |
8/13/2008 |
L |
$ 20.02 |
$ 1.00 |
100 |
8/15/2008 |
$ 21.91 |
$1.00 |
$ 187.00 |
| MVL |
8/13/2008 |
S |
$ 32.79 |
$ 1.00 |
100 |
8/22/2008 |
$ 33.09 |
$1.00 |
$ 28.00 |
| DSX2 |
8/13/2008 |
L |
$ 31.29 |
$ 1.00 |
50 |
8/15/2008 |
$ 31.60 |
$1.00 |
$ 13.50 |
| SOLF |
8/13/2008 |
L |
$ 13.12 |
$ 1.00 |
100 |
8/15/2008 |
$ 15.29 |
$1.00 |
$ 215.00 |
| MVL |
8/14/2008 |
S |
$ 32.79 |
$ 1.00 |
100 |
8/22/2008 |
$ 33.74 |
$1.00 |
$ 93.00 |
| MVL |
8/14/2008 |
S |
$ 34.19 |
$ 1.00 |
100 |
8/15/2008 |
$ 33.75 |
$1.00 |
$ (46.00) |
| ECOL |
8/15/2008 |
S |
$ 32.70 |
$ 1.00 |
54 |
8/15/2008 |
$ 32.94 |
$1.00 |
$ 10.96 |
|
|
Registered User
Joined: 4/18/2005
Posts: 4,090
|
| DSX |
8/15/2008 |
S |
$ 30.97 |
$ 1.00 |
150 |
8/15/2008 |
$ 31.01 |
$1.00 |
$ 4.00 |
| ALNY |
8/15/2008 |
L |
$ 34.94 |
$ 1.00 |
100 |
8/19/2008 |
$ 33.12 |
$1.00 |
$ (184.00) |
| SOLF |
8/18/2008 |
L |
$ 16.12 |
$ 1.00 |
100 |
8/20/2008 |
$ 16.95 |
$1.00 |
$ 81.00 |
| CAR |
8/19/2008 |
S |
$ 7.03 |
$ 1.00 |
200 |
8/22/2008 |
$ 7.58 |
$1.00 |
$ 108.00 |
| GA |
8/19/2008 |
S |
$ 9.83 |
$ 1.00 |
200 |
8/22/2008 |
$ 9.64 |
$1.00 |
$ (40.00) |
| TECUA |
8/19/2008 |
S |
$ 26.35 |
$ 1.00 |
100 |
8/28/2008 |
$ 28.10 |
$1.00 |
$ 173.00 |
| ORCC |
8/19/2008 |
S |
$ 8.90 |
$ 1.00 |
200 |
8/22/2008 |
$ 8.52 |
$1.00 |
$ (78.00) |
| UAUA |
8/20/2008 |
S |
$ 11.39 |
$ 1.00 |
100 |
8/21/2008 |
$ 13.00 |
$1.00 |
$ 159.00 |
| DBO |
8/20/2008 |
L |
$ 44.37 |
$ 1.00 |
100 |
8/22/2008 |
$ 45.20 |
$1.00 |
$ 81.00 |
| VRUS |
8/21/2008 |
L |
$ 20.62 |
$ 1.00 |
100 |
8/26/2008 |
$ 20.37 |
$1.00 |
$ (27.00) |
| DBO |
8/22/2008 |
S |
$ 44.19 |
$ 1.00 |
100 |
8/22/2008 |
$ 45.20 |
$1.00 |
$ 99.00 |
The rest of that winning streak. I skipped one trade because it shows as a really big loss but it was a meerger and I got a cash deposit but I didn't know how to account for it in the spread sheet.
| DSX |
8/15/2008 |
S |
$ 30.97 |
$ 1.00 |
150 |
8/15/2008 |
$ 31.01 |
$1.00 |
$ 4.00 |
| ALNY |
8/15/2008 |
L |
$ 34.94 |
$ 1.00 |
100 |
8/19/2008 |
$ 33.12 |
$1.00 |
$ (184.00) |
| SOLF |
8/18/2008 |
L |
$ 16.12 |
$ 1.00 |
100 |
8/20/2008 |
$ 16.95 |
$1.00 |
$ 81.00 |
| CAR |
8/19/2008 |
S |
$ 7.03 |
$ 1.00 |
200 |
8/22/2008 |
$ 7.58 |
$1.00 |
$ 108.00 |
| GA |
8/19/2008 |
S |
$ 9.83 |
$ 1.00 |
200 |
8/22/2008 |
$ 9.64 |
$1.00 |
$ (40.00) |
| TECUA |
8/19/2008 |
S |
$ 26.35 |
$ 1.00 |
100 |
8/28/2008 |
$ 28.10 |
$1.00 |
$ 173.00 |
| ORCC |
8/19/2008 |
S |
$ 8.90 |
$ 1.00 |
200 |
8/22/2008 |
$ 8.52 |
$1.00 |
$ (78.00) |
| UAUA |
8/20/2008 |
S |
$ 11.39 |
$ 1.00 |
100 |
8/21/2008 |
$ 13.00 |
$1.00 |
$ 159.00 |
| DBO |
8/20/2008 |
L |
$ 44.37 |
$ 1.00 |
100 |
8/22/2008 |
$ 45.20 |
$1.00 |
$ 81.00 |
| VRUS |
8/21/2008 |
L |
$ 20.62 |
$ 1.00 |
100 |
8/26/2008 |
$ 20.37 |
$1.00 |
$ (27.00) |
| DBO |
8/22/2008 |
S |
$ 44.19 |
$ 1.00 |
100 |
8/22/2008 |
$ 45.20 |
$1.00 |
$ 99.00 |
|
|
Registered User
Joined: 4/18/2005
Posts: 4,090
|
It's not all big loosers adn butter fingers. This was a recent(ish) victory.
| SUPX |
9/8/2008 |
L |
$ 29.50 |
$ 1.00 |
200 |
9/19/2008 |
$ 34.26 |
$1.00 |
$ 951.00 |
There was another loosing streak that I wont' bore you with then this winning streak.
| DIG |
10/28/2008 |
L |
$ 29.52 |
$ 1.00 |
50 |
10/31/2008 |
$ 33.55 |
$1.00 |
$ 199.50 |
| NDAQ |
10/28/2008 |
L |
$ 29.25 |
$ 1.00 |
100 |
11/5/2008 |
$ 33.30 |
$1.00 |
$ 403.00 |
| NYX |
10/29/2008 |
L |
$ 25.34 |
$ 1.00 |
100 |
11/5/2008 |
$ 29.09 |
$1.00 |
$ 373.00 |
| UYM |
10/29/2008 |
L |
$ 18.23 |
$ 1.00 |
80 |
11/5/2008 |
$ 21.94 |
$1.00 |
$ 294.80 |
| GLD |
10/29/2008 |
L |
$ 74.55 |
$ 1.00 |
80 |
10/31/2008 |
$ 71.43 |
$1.00 |
$ (251.60) |
| ZION |
10/28/2008 |
L |
$ 37.25 |
$ 1.00 |
35 |
10/31/2008 |
$ 37.75 |
$1.00 |
$ 15.50 |
| UYM2 |
11/4/2008 |
L |
$ 22.67 |
$ 1.00 |
50 |
11/5/2008 |
$ 21.94 |
$1.00 |
$ (38.50) |
| UUP |
11/6/2008 |
L |
$ 26.45 |
$ 1.00 |
200 |
11/13/2008 |
$ 26.75 |
$1.00 |
$ 58.00 |
| VLO |
11/6/2008 |
S |
$ 18.84 |
$ 1.00 |
150 |
11/7/2008 |
$ 20.41 |
$1.00 |
$ 233.55 |
| STR |
11/6/2008 |
S |
$ 31.48 |
$ 1.00 |
120 |
11/7/2008 |
$ 32.45 |
$1.00 |
$ 114.64 |
| CHL |
11/6/2008 |
S |
$ 42.99 |
$ 1.00 |
90 |
11/7/2008 |
$ 42.63 |
$1.00 |
$ (34.28) |
| ZEUS |
11/6/2008 |
S |
$ 19.94 |
$ 1.00 |
80 |
11/7/2008 |
$ 20.06 |
$1.00 |
$ 7.60 |
Then the party was largely over. The BAD loosing streak above dosen't represent the usual losses. Ocasionaly i get this period of bad whipsaws or I'll just sit and leave my stops in place convinced that I'm moving them too prematurely. I usualy decide this after cutting a great trade short. Still Those were some considerable losses and I'm trading a tiny portion of my capital now.
I'm down to les than .007 X total net liquidation capital.. NO margin and rounded down in share sizing. so the distance to my stop sets my position size and only puts a max of .007 of capital at risk which I round down to the nearest even unit of 10 and stop at 150 for cheaper stocks.
I'm not expecting analysis on all these trades.
Oh .. I try to take my signals when I think they are coming and trail a stop OR some times i'll just exit if big numbers come into the scan for the opposite direction or liek during finals week I just exited everything.. even proffitable trades.
|
|
Registered User
Joined: 4/18/2005
Posts: 4,090
|
It's so frustrating because I feel like I'm so close.. but then I get these periods where everything I touch turns to crap. I try to sit it out and wait and the next cycle is the same.
For this the original idea was a bit mroe agressive than I trade it now. hold 5-11 positions smaller sizes but pyramid over dialy highs and trail a tight stop. dumping duds quick and leveraging winners. I don't do that now and wan't taht disciplined about doing it every time then.
i came up with this idea during this bear, before I knew it was a bear and I think it did test better the higher up the slope of hope in recent history we go... so maybee it will get better when the bottom is in BUT there are tons of things moving now and It seems like If I have 3 selection out of 8 that get orders I picked the three that flop and the others cruise.
This has been helpfull guys thanks and Thank you Tobydad.
|
|
Registered User
Joined: 6/6/2005
Posts: 1,157
|
Scott, here are some stats for the numbers you posted.
Trades: 68
Wins 37 (54%)
Losses 31 (46%)
Average gain $151.56
Average Loss $153.16
Average of all trades: $12.64 or .42% (hey, at least it's positive)
Based on these numbers, I ran a simulated equity curve growth for 100 accounts. Here is the chart that immerged:
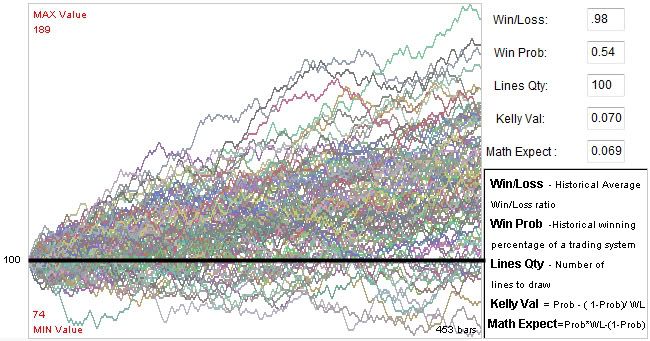
This chart shows how $100.00 would have grown traded in 100 accounts based on the probabilities generated from your trades as they would look traded 453 times.
The max value is 189 meaning a best case scenerio of an 89% gain over 453 trades. The minimum value is 74, menaing a worst case scenario drawdown of 36%. As you can see, the performance based on your current strategy is somewhat sporadic. (no need to tell you).
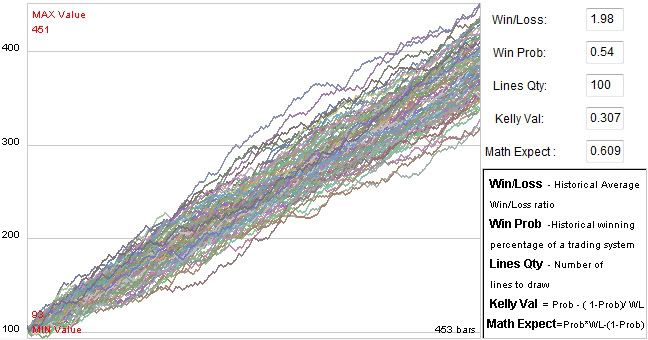
What I see mainly is that you have to cut the size of your losers down, meaning, as APSLL has mentioned, take trades that have a better risk reward profile. Here's a chart showing the growth of your strategy if you could cut the amount you lose on your losing trades in half from 153.16 to 76.58.
Quite a difference. Now, this may not be realistic, so here's what it would look like by cutting the amount you lose on losing trades by 25%.
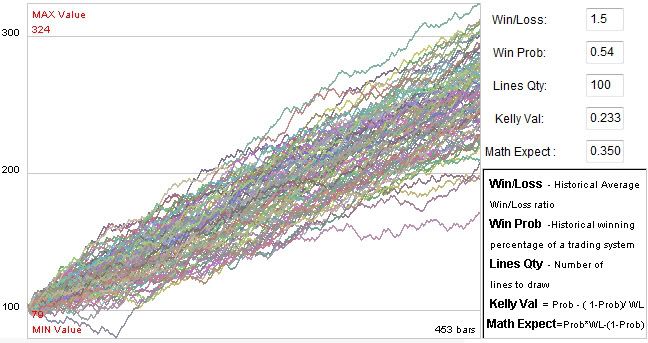
Still a very big improvement. the worst equity curve still has a drawn down of 21% but that is very decent.
So i would focus on cutting those losses short. How short you can cut them without chopping out the good winners is for you to determine. just a little something to think about.
And to be honest, I think you think you're doing much worse than you are. That's where the emotional control comes in and kowing your trades and your system.
Focus on your trade and your set up (be sure not to buy at resistance).
Focus on your exits (make sure your stops aren't too far away)
David John hall
|
|
Registered User
Joined: 7/1/2008
Posts: 889
|
what software is that, David John Hall?
|
|
Registered User
Joined: 3/21/2006
Posts: 4,308
|
Scott I want to apologize for my blunt comments. You know me by now and that is who I am. I am glad that you have seen the value in David’s words even though I was trying to say the same thing concerning the resistance and consolidation factor. David and Tobydad are more delicate in there approach than I but please be aware that my intentions are pure it is just my delivery that is failed.
I do care about your success and have tried to help over the years. I consider you to be an asset to this forum. At times you lighten the mood when it is needed and I love that picture of you giving Ballroom dancing lessons. You are a straight up guy and never pretentious. I will celebrate when the day comes that you are confident in your methods and your success.
I remember when we first started talking; you were asking to become a member of the bottom feeders club. Those were the good old days. I will leave the advice giving to the statesmen of the forum; Tobydad, Davidjohnhall and Diceman. (Where is he by the way, I have not seen him on either forum lately)?
Apsll.
|
|
Registered User
Joined: 6/6/2005
Posts: 1,157
|
hi ben2k9 - google 'Kelly formula' and choose the hqquotes link - scroll down the page until you see them talk about 'our applet' and click on the link. David John Hall
|
|
Registered User
Joined: 7/1/2008
Posts: 889
|
thanks DJH!
|
|
Registered User
Joined: 11/22/2006
Posts: 100
|
Hey All,
I noticed some errors in the posts above.
Scott’s calculations for profit and loss on the short trades are in error. The losses are actually profits and the profits are actually losses (plus/minus the adjustment for the commissions). The long trade calculations looked correct. Also 11 trades are double posted (DSX, ALNY, SOLF…). My counts as follows (assuming no errors from myself):
Trades: 57
Wins 30 (53%)
Losses 27 (47%)
Average gain $167.99 ($5039.73/30)
Average Loss $162.28 ($4381.65/27)
Average of all trades: $11.54 (($5039.73-$4381.73)/57)
I always learn lots from reading all of your posts.
Thank You All.
William
|
|
Registered User
Joined: 10/7/2004
Posts: 264
|
SQNM: You bot a doji top right at resistance set by the late Sept. gap and consolidation. Need I say more?
DAG: Don’t have an issue with this one, other than the flat SMAs.
QCOR: Sounds like you where stopped out on this one at 7.66. Once again, a very nice buy at resistance – the 50 SMA. Seems you where a bit early on the entry. Stop needed to be above the 50 SMA to have any chance.
MSCC: I can live with a short after filling the gap (sell at resistance). Might be premature, as I would wait for a reversal candle pattern. Also, you didn’t identify your stop, but I would make sure it is above the 50 SMA. Watch the action at the 50 sma.
PTRY: I can live with this one as well – sell at resistance 20 SMA. No stop indicated, but make sure it is above the 20 at least.
|
|
Registered User
Joined: 10/7/2004
Posts: 264
|
QUOTE (scottnlena) you know this is actualy helpful.
In terms of buying at resistance and selling at support. That is the basic breakout strategy right? I"m a little confused there.. I used to skip trades left right and center because of support and resistance and I fount that prices were slicing right through some times and not getting close others. NOT that I totaly discounted resistance but I fugured I was to picky.
I
So what? You came here complaining about not beating a coin flip. Breakouts are prone to failure. There are a lot more failed breakouts than the movers. If you trade this strategy be prepared for a lot of losses. IMO, you need to make up your mind. Do you want a high success rate -- ie; 60% - 70% "winners"? Or do you want to trade trends and breakouts with 30% "winners" and let them run to make up for the losses?
Proper entry at a support or resitance levels is a low risk trade setup. With tight targets and good stop placement, you can get high success rates. Good luck.
|
|
Registered User
Joined: 10/7/2004
Posts: 264
|
QUOTE (scottnlena) QUOTE (Golfman25)
GDX: I can live with the bullish engulfing as an entry signal as it is after 3 down days and off the 20 SMA. You don’t give your stop in numerical form, but it sounds like the low of some bar – the Bull engulfing bar? – which is $32. (As an aside, you might want to get a lot more specific with your numbers – as good traders keep good records.) I would certainly have it below the 20 SMA at 31.71. My only concern would be the 200 SMA acting as resistance, which it did 3 times before breaking above. All in all, it looks like this will work out with an initial target at 40ish and another at 46ish. I’d trail a stop just under the 20 SMA.
SSRI: I have no clue why you would make this trade. I see no breakout. I see lateral consolidation along the 200 SMA. I see resistance at the 23 area and the 26 area. This isn’t in a buying area until a pullback to the 50 SMA.
Well I put an order just above the high of the little consolidation. You'll see it if you plot MAXH15 on the chart. price crossign that line was my buy signal. I've had good sucess with this sort of entry in the past.
DIG: First, there is no bull engulfing on 2/5. Bull engulfing has to happen after a down trend. At best this is a box play with 24.75 support ant 34 resistance. You’re in right between the numbers at 29.50. Your stop was right ABOVE support, and got taken out. Look at the tail on the candle on the day you where stopped out. The most important comment you made was: “I missed the actual reversal day on 2/3.” That is right – When you miss the entry, stay out of the trade. IMO, your forcing trades here and got nicked.
interesting I lever learned the prior requirement on bullish engulfing.. I just lerned it was a bullish signal, in this case I figured it wasn't to late to use that as an entry for the slightly weak looking and missed earlier signal. When I used candle signal entries I wasn't taht fussed about specifics but I considered it engulfing if the body engulfed or with in a tight margine engulfed the previous body or much of it's range.
More to come later.
If you had prior success with your entry, why are you complaining about the results? What is your expectancy in dollars on these types of trades? If you have done serious analysis, you would have confidence in the setup and let your expectancy play out.
As for candle signals, clearly you haven't done your due dilligence. A reversal pattern has to have something to reverse. I would do more research on the candle signals before you comit to using them. Try Steve Nison's stuff.
I see a lot of "figuring" and "thinking" in your analysis. Stop it. The market doesn't give a rats behind what you figured your what you thought. You are trading the market. Set your entry point, set your stop, set your target -- and trade. Good luck.
|
|
Registered User
Joined: 4/18/2005
Posts: 4,090
|
QUOTE (william4567)
Hey All,
I noticed some errors in the posts above.
Scott’s calculations for profit and loss on the short trades are in error. The losses are actually profits and the profits are actually losses (plus/minus the adjustment for the commissions). The long trade calculations looked correct. Also 11 trades are double posted (DSX, ALNY, SOLF…). My counts as follows (assuming no errors from myself):
Trades: 57
Wins 30 (53%)
Losses 27 (47%)
Average gain $167.99 ($5039.73/30)
Average Loss $162.28 ($4381.65/27)
Average of all trades: $11.54 (($5039.73-$4381.73)/57)
I always learn lots from reading all of your posts.
Thank You All.
William
I did actualy re paste the same section of trades in .. I'll try to fix that later I didn't catch that..thanks.
The P/N L is accurate however. I double check that they match my brokerage numbers. The data is kinda funny in the spread sheet for shorts.
I have a buy price and a sell price.. long or short is determined by the dates and usualy the red S but I do that manualy. I'd have had to get into some deep nested excell functions to get the spread sheet to automaticaly do some of the stuff I originaly wanted to do (forget now what it was). so now when I enter a shortt rade from left to right on the sheet it goes Ticker in date, price (leave blank) quantity, and comm. then I have out date (leave blank till closed) and sell price (enter data) and comm. If you are looking at the dates as buy and sell dates then it would look odd.. BUT the are in and out dates. this keeps the formula the same for the P/L calculation
((R29-D29)*F29)-(S29+E29)
Example from one cell. ((sell price - buy price) * Quantity)-(comission in and comission out)
since in a loosing trade this is a negative number it's added.
Other wise if I wanted buy and sell dates I'd have needed to put in "if' statements and reverse the syntax and that would have just been a pain and if I got the notation wrong Long or short then I would have a problem. This way even if I do get a typo on the Long short part it dosen't matter because it's the same sell cell and the same buy price cell
and the formula pastes nicely down the page for unlimited trade recording.
|
|
Registered User
Joined: 11/22/2006
Posts: 100
|
I apologize for my error to the group.
Scott, I took your buy column as entry and sell column as exit, so the entry/exit dates and prices where next to each other. I should have taken what you had stated literally. I realized later when looking at the individual charts for entry/exit in the channel that some short trade’s entry price range did match the price as I had interpreted it. OOPS! Thanks for correcting my correction. I’ll just go back to lurking.
William
|
|
Registered User
Joined: 4/18/2005
Posts: 4,090
|
william
No need to go back to lurking.
If I shut up everytime I put my foot in my mouth i'd be a mute ! What fun would that be. Had you NOT mentioned the double pasting I'd never have noticed it.
I think I highllighted but didn't "copy" and left the old data on the clip board. Most of my stock and forum stuff is done lateish at night. after a few hours of homework and such.
IB has trade confirmations in an excel format that can be copied and pasted but it's kinda a pain to get to that format .. at the end of the day I can justt pull up trade confirmations for the past 2 days and key them in quuickly and be done with it. Besides I had an automatic software that was nice .. but I encouraged six shooter trading. I get allot of transactions as it is..
My goal is less for this year but still to take a clear signal when I get it. I'f im' lookign at a big list of possibilities just the prospect of doing the paper work on to many entries is a deterent for me. Serriously manualy entering the inforamtion is a be more personal to me.
there ae auto updating portfolios on line and stuff but I can run and maintain performance charts of my self in Excell farily easily. Love it. I basically recreated Tradelogs spread sheet . Still havent built the pivot reports but I intend to one day.
That wil be cool to pull but all trades in XYZ ticker or all trades with "MS > EMA" or some such. I still track the positions of indicators with my decisions and at the end of the year hope to run analysis on wether or not XYZ subtlty is a benefit or not. Ie: % gain prior quarter before entry signal. % gain on entry signal day, Verses SPY at time of entry. then line them all up and look for trends that may be an edge such as All stocks that gained between 10% and 20% but less than 25% before entry signal performed the best or some such.. then I've got another area to focus.
In the past Ive done this and with the "trend in motion" type of entries I found that those that had TSV and Moneystream in positive profiles tended to be winners and the others tended to be random outcome at best. That was during the up trend..
the reversl trad e I switched to didn't originaly require that and I make no claim to magic there. The entries tend to be early and uncomfortable .. few have the good indicator profiles right now.
|
|
Registered User
Joined: 7/1/2008
Posts: 889
|
Hey Scott,
Just a thought - why reinvent the wheel? IBD's CANSLIM strategy is a proven winner. Here's recent results from an independent study done by the AAII, and these returns don't even take into consideration the market timing which is integral to the CANSLIM strategy.
"
CAN SLIM® Investment System Gained +1,351.3% While the S&P 500 Dropped -6.9%
IBD's CAN SLIM Investment System dramatically outperformed the S&P 500 over the past 11 years, according to the American Association of Individual Investors (AAII). That timeframe includes two bull markets and two severe market crashes (including the historic bear market of 2000, as well as the 2008 financial crisis).
AAII's independent study found The CAN SLIM System was the No. 1 performing growth strategy with an extraordinary +1,351.3% gain. During the same timeframe, the S&P 500 had a decline of -6.9%. The eleven year cumulative performance was tracked from 1998 through December 31, 2008.
"The CAN SLIM System works in any market because it's based on over 125 years of market history," said IBD Market Writer and Commentator, Ken Shreve. "That's why it generated big gains when stocks boomed in 1999 and 2003, and why the strategy also helped investors get safely out of the market when it crashed in 2000 and 2008."
|
|
Registered User
Joined: 3/21/2006
Posts: 4,308
|
Who says that CANSLIM works. I have found that it does not work. I used to subscribe to IBD. It is set up to find fundimentaly sound stocks that have had large moves. By the time you settle on a quality stock to invest in than then run is usually peaked out. I can use TeleChart to find stocks that have had good runs also. That does not mean that these runs will continue as a matter of fact in most cases they are in over bought territory.
|
|
Registered User
Joined: 2/5/2006
Posts: 1,148
|
lol. you'd better read the fine print on how that 1350% was calculated.
those are maddof numbers.
|
|
Registered User
Joined: 4/18/2005
Posts: 4,090
|
QUOTE (ben2k9) Hey Scott,
Just a thought - why reinvent the wheel? IBD's CANSLIM strategy is a proven winner. Here's recent results from an independent study done by the AAII, and these returns don't even take into consideration the market timing which is integral to the CANSLIM strategy.
"
CAN SLIM® Investment System Gained +1,351.3% While the S&P 500 Dropped -6.9%
IBD's CAN SLIM Investment System dramatically outperformed the S&P 500 over the past 11 years, according to the American Association of Individual Investors (AAII). That timeframe includes two bull markets and two severe market crashes (including the historic bear market of 2000, as well as the 2008 financial crisis).
AAII's independent study found The CAN SLIM System was the No. 1 performing growth strategy with an extraordinary +1,351.3% gain. During the same timeframe, the S&P 500 had a decline of -6.9%. The eleven year cumulative performance was tracked from 1998 through December 31, 2008.
"The CAN SLIM System works in any market because it's based on over 125 years of market history," said IBD Market Writer and Commentator, Ken Shreve. "That's why it generated big gains when stocks boomed in 1999 and 2003, and why the strategy also helped investors get safely out of the market when it crashed in 2000 and 2008."
Yea I've read his book. I'm shure it works some times. It's usualy geared towards a longer hold. Dan Zanger used the method to great effect and I know that IBD claims that often their methods are at the root of many finalists in the investment competitions. I don't know.
I know that a stock that makes a 400% gain has to go through 100% and 200% to get there but the higher it goes the more select a club it belongs to.
I do like the leading sectors part and have been trying to groom my watchlist on that basis... but so far i'm not breaking the bank with it obviously... BUT consider the current condition.
The biggest thing is I'm frustrated with my progress to this point.. I've had some great runs and some great negative runs. My general over all performance and my ability in short term ish swing trading.
|
|
|
Guest-1 |