Registered User
Joined: 3/16/2006
Posts: 2,214
|


|
|
Registered User
Joined: 12/21/2004
Posts: 902
|
Whose ranking, Signaltap? Do you know what the criteria is?
|
|

Registered User
Joined: 3/25/2005
Posts: 864
|
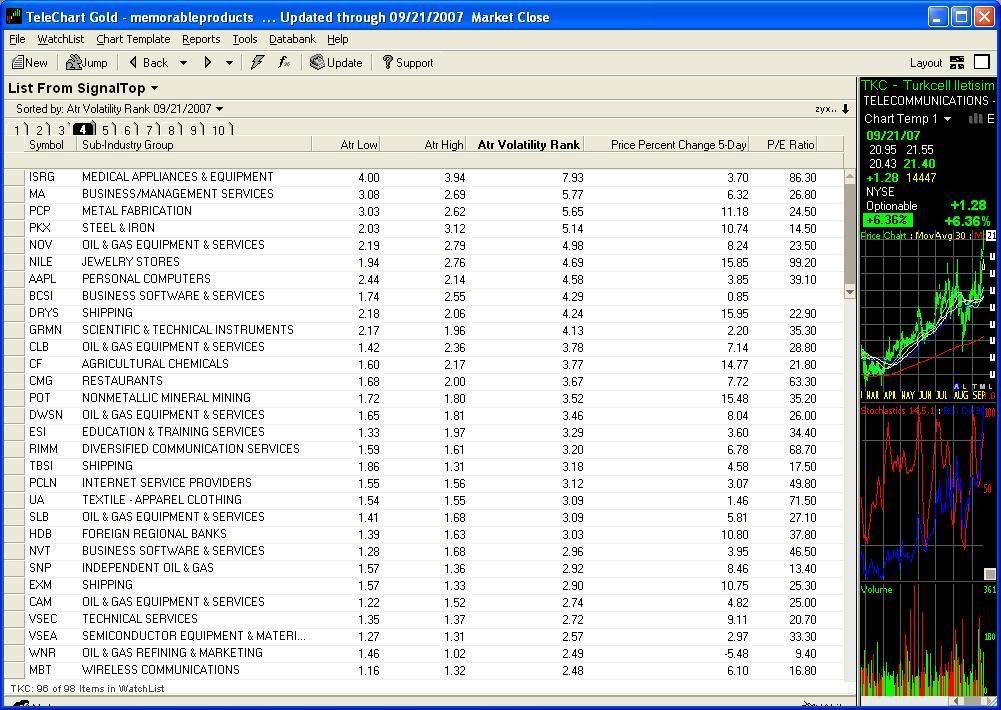
This is my spin on SignalTop's List:
|
|

Registered User
Joined: 3/21/2006
Posts: 4,308
|
good morning MP
|
|
Registered User
Joined: 3/25/2005
Posts: 864
|
good morning Apsll
(Sorry, I didn't see you here earlier)
|
|

Registered User
Joined: 6/6/2005
Posts: 1,157
|
Hello Signaltap2,
I have a few questions...
Would you say these are the top 100 companies, or top 100 stocks? Semantics, maybe. But aligning the companies with their stocks has always proven disastrous for me. Stock price/performance points to the perceived future value of the underlying company and can change at a moments notice. Also, I have never been able to formulate a successful system based around the top performing stocks at any given time. I understand that strong/expensive stocks are supposed to keep rising but buying breakouts to new highs inevitably, for me, produces far too many situations where I have bought the top. Do you have a filter that prevents you from doing this? Also, given that there are 100 stocks on your list, how do you narrow those down to the ones you select to buy? Do you search for specific patterns within this top 100? I have seriously, spent hundreds of hours backtesting strength trading and would appreciate some good filters.
Thanks!
David
|
|
Registered User
Joined: 12/21/2004
Posts: 902
|
Mystery solved - it's last weeks (Sept 17) IBD Top 100 list
|
|
Registered User
Joined: 1/28/2005
Posts: 6,049
|
"Also, I have never been able to formulate a successful system based around the top performing stocks at any given time. I understand that strong/expensive stocks are supposed to keep rising but buying breakouts to new highs inevitably, for me, produces far too many situations where I have bought the top."
------------------------------------------------------
davidjohnhall
I saw the results of a system that used 6 indexes.
(the index returns not the individual stocks)
Russell
Large Cap
Mid Cap
Small Cap
(both growth and value)
At the end of the year a 6 month percent change
was taken. You would go in the best index and
hold it for 3 months (1 quarter).
You would do a 6 month sort again. If your index
was number one you would hold it. If another
moved into first place you would replace it.
That was all. A 6 month sort every 3 months.
This was tested over a decade (and thru the
2000/2002 bear market) I don't remember the
returns but it handily beat the SP-500 and
something like 99% of mutual funds.
----------------------------------------------------------
I have started experimenting with this on a
stock basis. From the second quarter of 2005
to the second quarter of 2007. $100 in the
SP-500 turned into $127.89.
Using the top 10 stocks from the Russell
1000 $100 turned into $272.33.
Using the top 5 stocks $100 turned into
$337.8.
-----------------------------------------------------------
Using the ETF watchlist the best 10 ETF's $100 turned into 163.74
----------------------------------------------------------
This represents 27 months of testing (9 quarters).
(obviously this was also a bullish time)
To generate "raw" results a simple 3 month
hold was used. (no stop loss) Obviously some
type of money management or risk control may
improve results.
(in my test money was equally split between
the holdings)
------------------------------------------------------------
To generate sorts and returns the date function
was used. This would be the return for the
period from the end of December 2006 to
the end of March 2007:
(C'03/30/07' - C'12/29/06') / C'12/29/06' * 100
Thanks
diceman
|
|
Registered User
Joined: 6/8/2006
Posts: 58
|
Hi Diceman
I hope this isn't a stupid question, but what criteria are you using to say the top five stocks? % Price change per quarter, EPS or what?
Thanks
Muniyba
|
|
Registered User
Joined: 1/28/2005
Posts: 6,049
|
Muniyba
The best stocks are based on a 6 month percent
change. (that is all)
You equally buy the 10 best and hold them for 3 months. Then you do another 6 month sort and
put your money in the 10 best again.
The second system was to use the best 5.
The idea is a smaller number is more aggressive
because it has less diversification.
The results I showed were from following those
rules for 9 quarters.
Basically one 6 month sort every 3 months.
There were no stop losses and no trading
in-between those periods.
The idea is to define what relative strength
brings to the table all by itself.
Thanks
diceman
|
|

Registered User
Joined: 10/7/2004
Posts: 319
|
Those are interesting results Diceman. Have you run a 3 month sort every month to see if the results are better (or worse) then the 6 mo sort every 3 month? If I have time, I may play around with that a bit myself over the next few days.
|
|
Registered User
Joined: 6/8/2006
Posts: 58
|
Thanks Diceman. It looks really interesting. I wonder what the result would be if you looked at the 3months in sequence to see if some month combos are better that others.eg. jan, feb, march then feb, march april, and march, april, may etc.
Cheers
Muniyba
|
|
Registered User
Joined: 1/28/2005
Posts: 6,049
|
Survivor
The tests I've seen suggest longer is better.
(although you can always look)
Typically from 6 months to a year.
Any info you could provide would be welcome.
Thanks
diceman
|
|
Registered User
Joined: 1/28/2005
Posts: 6,049
|
The results are in for the 3rd quarter of 2007.
Over the last 10 quarters. (30 months):
SP-500: $100 grew to $129.71
-------------------------------------------------
Russell 1000
Top 10 stocks: $100 grew to $287.77
Top 5 stocks: $100 grew to $386.54
--------------------------------------------------
ETF Watchlist:
Top 10 ETF's: $100 grew to $187.47
Top 5 ETF's: $100 grew to $179.72
-------------------------------------------------
In the SP-500 only 5 stocks beat the
10 stock portfolio over the 30 month
period.
No stocks beat the 5 stock portfolio.
13 stocks beat the ETF portfolio.
----------------------------------------------
In the Russell 1000. 21 stocks beat
the 10 stock portfolio.
Only 9 stocks beat the 5 stock portfolio.
46 stocks beat the ETF portfolio.
Thanks
diceman
|
|
Registered User
Joined: 6/8/2006
Posts: 58
|
Hi Diceman
I'm doing a test of this as follows: Paper trading the top 5 Russell 1000 stocks which on Oct 2 were AMZN, CROX, NVT, FSLR and MDR.
Virtual traded 100 of each as follows:
AMZN @92.25
CROX @68.52
FSLR @129.45
MDR @56.84
NVT @75.88
I will leave these for three months without touching and post the result.
I am also paper trading these stocks as per my trading system to test if it is a better or worse result.
So on the same date I would not have purchased AMZN, CROX or NVT.
Bought 100 of each:
FSLR @129.45
MDR @56.84
As of today my buy and hold portfolio is $74 up.
The buy and trade portfolio is $327 up.
I will post from time to time to keep you updated.
Cheers
Muniyba
|
|
Registered User
Joined: 6/8/2006
Posts: 58
|
End of the first week Buy & hold portfolio up $918.51 = 2.16%
Trading portfolio up $893.01 = 4.78%
AMZN is close to issuing a buy signal in my system, it all depends on the test of the recent high. No sell signals issued on current holdings.
Cheers
Muniyba
|
|
Registered User
Joined: 6/8/2006
Posts: 58
|
Portfolio Update
AMZN gave a buy signal today so for the trading portfolio I bought 100 AMZN @ $95.33
The current portfolio profits are:
Top 5 Buy and Hold = +$1202 = +2.83%
Top 5 Traded + +$884.05 = +3.13%
Cheers
Munaiba
|
|
Registered User
Joined: 8/6/2007
Posts: 73
|
muniyba,
Good call AMZN
|
|
Registered User
Joined: 1/28/2005
Posts: 6,049
|
"The current portfolio profits are:
Top 5 Buy and Hold = +$1202 = +2.83%
Top 5 Traded + +$884.05 = +3.13%"
--------------------------------------------------------------
Are these portfolios different sizes?
One has more dollar profit but lower percent.
Your share size is always 100?
(that will give more weight to the expensive stocks)
All my returns were based on percent return so that
stock price was not a factor.
Thanks
diceman
|
|
Registered User
Joined: 6/8/2006
Posts: 58
|
Hi Diceman
I just traded 100 stocks each time. That's why the buy and hold portfolio has a larger profit but smaller % profit because not all stocks were in a "buy phase" for trading.
Is there someway I can "correct" these figures to give results based on your system? Perhaps I can calculate the return for each $100 spent on a stock. That would be on a par with your previous research wouldn't it?
Cheers
Muniyba
|
|
Registered User
Joined: 6/8/2006
Posts: 58
|
Update
MDR is showing a potential sell signal but it is also a dragonfly doji. If it trades above it's pivot point ($57.58) tomorrow I will stay in, otherwise I will sell this stock for the trading portfolio.
Cheers
Muniyba
|
|
Registered User
Joined: 6/8/2006
Posts: 58
|
MDR bolted out of the blocks and traded above its pivot so this is still in the portfolio. FSLR is close to giving a sell signal. So will check the close tomorrow.
The B&H portfolio is + 1062 or +2.5%
The trading portfolio is +905 or +3.2%
|
|
Registered User
Joined: 6/8/2006
Posts: 58
|
Sad News ... fslr went from a very nice profit to a small one when sold at open 130.10. AMZN had to sell for a small loss 62.10
I know see Diceman's point abou thow to report these figures to compare them properly. I guess it will only be really relevant at the nedo fo three months when we tabulate the profit/loss totals.
Anyway the Buy and hold portfolio is sitting on profit of $940.69 = 2.22%
The Trading portfolio has a profit of 430.7 = 1.52%
Buy and Hold's looking good. It also seems to overcome all the angst associated with "let your profts run" post in this forum.
Cheers
Munaiba
|
|
Registered User
Joined: 6/8/2006
Posts: 58
|
Buy and hold currently up 9.86%. AMZN the only loser. My trading is hopeless. Few trades triggered and too many losses. looks like the B&H of the top 5 Russell 1000 is a great strategy.
|
|
Registered User
Joined: 6/8/2006
Posts: 58
|
BTW that's in less than 1 month
|
|
|
Guest-1 |