Registered User
Joined: 1/28/2005
Posts: 6,049
|
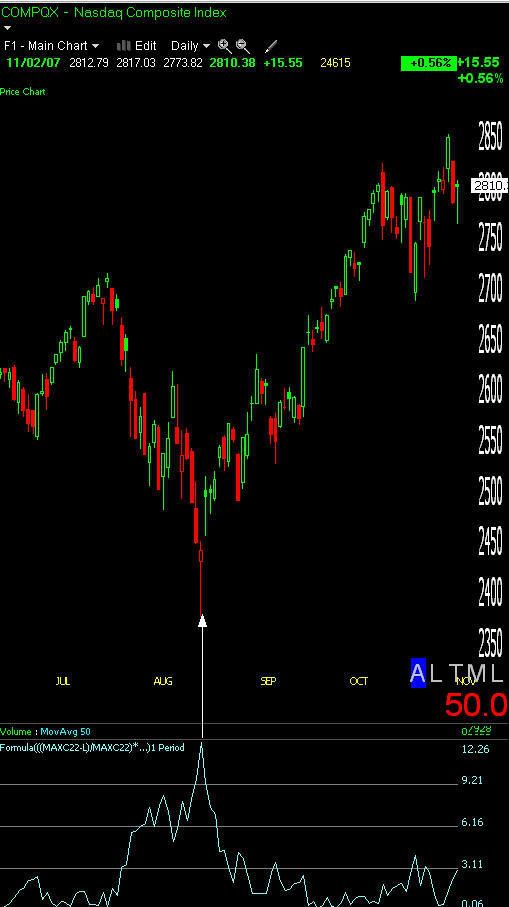
Scott brought up Larry Williams.
I saw an indicator of his :
Synthetic VIX.
Which can be applied to any tradable.
It is a measure of volatility.
High values tend to mark bottoms and low values
tend to mark tops.
You would look to enter uptrends on indicator down turns
from high values.
--------------------------------------------------
It can be charted as a custom indicator using:
((MAXC22-L)/MAXC22)*100
-------------------------------------------------
He uses 22 days because it represents about a month of data.
Another idea is to click on the indicator and add bollinger
bands to determine when it is high/low.
Looking at this very quickly. It appears to me the weekly
values are most useful.
(indicator plotted on weekly charts)
Thanks
diceman
|
|

Registered User
Joined: 4/18/2005
Posts: 4,090
|
I don't see it.
could you give some examples of it's use?
|
|
Registered User
Joined: 1/28/2005
Posts: 6,049
|
ATW just happened to be the chart I had open.
If you pull up a weekly chart and add 20,20 bollinger
bands to the indicator. You can see at approx: 6/02/05
(use the pointer) The indicator fall back thru the upper band.
Indicating a bottom was reached. the rally goes on until
9/26/05.
The same thing happens from 10/31/05 until 1/27/06 or
4/18/06 (depending on how you define a trend)
The advantage of the bands is seen in the 8/16/07 bottom
call. (it is at a lower level but the bands "adjust" the level)
So one use for this may be as a sort tool to look for
stocks that are about to "trend". then confirm with
other indicators.
--------------------------------------------------------------------
It is also a possible problem that this indicator is
"upside-down" compared to other stock indicators
(low equals bottoms in most indicators)
So it may be useful to multiply it times minus one.
This will "flip" the indicator. (invert it)
This would be the inverted form:
(((MAXC22-L)/MAXC22)*100)*-1
----------------------------------------------------
I would add that the original version is in the style of
the VIX. The idea is that sell off's tend to be areas
of panic. (That is the theory behind the high volatility)
The falling of the indicator is the market returning
to normalcy.)
Thanks
diceman
|
|

Registered User
Joined: 6/6/2005
Posts: 1,157
|
Wow, nice! Thanks, Diceman.
|
|
Registered User
Joined: 6/8/2006
Posts: 58
|
Hi guys
Interesting topic but it sometimes gives false signals. See MMR on 19th Jan 07. The indicator made a low and recovered (I'm using indicator *-1 as diceman suggested). The stock however continued to decline.
Cheers
Muniyba
|
|
Registered User
Joined: 4/18/2005
Posts: 4,090
|
muniyba - all indicators some times give false signals.... the issiue is if it gives allot of false signals.
Anyone know the formula for his COT PROXY indicator?
|
|
Registered User
Joined: 6/6/2005
Posts: 1,157
|
Hello Muniyba,
I think it's important (in my opinion) to point out that every indicator gives false signals, and that (in my opinion) indicators are not to be used as trading systems, but as part of an overall methodology alerting the trader to a possible change in price personality, which must be confirmed before acted upon. In the case of MMR Jan/07, the indicator would have been the warning signal and then a break of the price channel to the upside would have been confirmation resulting in a nice trade. The question is not how many false signals the indicator gives, but, when used as part of an overall plan does it imporove a win/loss ratio and help generate a greater edge than if you wern't using it? (in my opinion) that can only be determined through backtesting 1,000's of trades, and forward testing on even more. So far it looks very interesting (in my opinion) and worth further research.
David John Hall
|
|
Registered User
Joined: 6/6/2005
Posts: 1,157
|
Speaking of Larry Williams, I'm reading his book The Right Stock at The Right Time -- very interesting work on cycles. He has analyzed data back to 1853 and from what I can tell after researching his findings myself for the better part of yesterday, they warrant closer inspection. Some troubling quotes in the book about W.D. Gann. Apparently, Williams met Gann's son who explained that Gann was only a chartists and if he was as amazing and wealthy as everyone says he was, why was his son still "smiling and dialing" (working as a broker). Very interesting. Apparently Williams, who has tried everything under the sun, returned to price cycles and a recurring 4 year low which he trades without hesitation. The last one was in the fall of 2006 and yep, it's there. I'm a firm believe in testing methods for yourself, but also believe it's important to build upon the work of others who have put in many hours studying the same things. Very interesting.
David John Hall
|
|
Registered User
Joined: 4/18/2005
Posts: 4,090
|
you know it occours to me that The shorter term a person goes intheir time frame the more difficult a game they have decided to play. Every day there is a reason to either hang yourself or open the champagne, verry litle middle ground. Part of this is the Media hyping everything under the sun.
so If a person is targeting swings of say a few weeks or more.. then it stands to reason that there will come a time when their possitions are filled in their portfolio, and as such there is nothing to do but maintenance and wait to get to a target and prepare for the next entry to replace the ne next stopout or target exit.
So This could create some down time..... this is where writing books, giving lectures etc etc. MAY come in handy to generate income between waiting for positions to mature.
The other alternative is that despite how much training, trading education, indicators knowledge, strategies etc etc. It's next to impossible to take greater than your fair share from the market, but because it's such an attractive lure and nearly everyone gets at least one great trade.... it creats a rip, fertile ground for scams. Couple that wiht our tendancy as Americans to want an easy ride ... it becomes a serriously real possibility. Somewhere on Larry Williams website he makes the point of asserting that "he really trades" and that most "trading systems out there, advisory services etc, do very little if any real trading at all. Interesting.
|
|
Registered User
Joined: 6/6/2005
Posts: 1,157
|
I couldn't agree more. During down times I like to post on this Board, and read what other posters (such as yourself) have to say. I agree with you regarding the shortned time frame and agree with Livermore who said the big money is in the big moves. Agreed he did blow his brains out, but... One thing I have noticed about the really big names in trading is that they seem to trade big stocks (higher priced, popular for the day) at crutial times, and then they trade only 1-3 of them at a time. This always perplexed me regarding the diversification model, but more and more I'm beginning to move toward that type of trading. To manage 1-2 trades and increase/decrease position sizes based on movement.
|
|
Registered User
Joined: 4/18/2005
Posts: 4,090
|
I think If you are a hands on trader/ Investor then "diversification" is like trying to tread water while holding a 15lb weight.
IMO the main purpose of diversification is to limit "drawdown". Well most of us can just move up a stop or exit a position . ON days when most things are down being spread across a wide diversity helps lower the impact.
If you aren't a great stocks picker, or have someone else doing it for you (broker) then diversity help protect from considerable blunders in the "buy and hold" mode. Most brokers I have ever spoken to discourage the stoploss idea... and intelectualize a "hold and hope" mentality chattering on about long term and giving things time to mature. One of those broker suggested a Large helping of INTC to a large lot clietn in DEC of 05' . "oops" was her reply. Two years later that client can now exit flat.... But during that time his money could have been in any number of other things.... DRYS for example....He'll probably get the call this week for that one.
diversity helps you stand a greater statistical probability of beign a a decent winner if you have a hand full of average performers (12%). And is necessary for portfolios that are managed with out stops. Also presumeable bring in a "decent" rate of return across a broad variety of market conditions...taking advantage of a bit Tech swing here, Airline value there, Large cap dividend there (still cant figure out the apeal to this one for anyone but Seiniors... and even then).....
But if your the kind of investor that like to get inot it .. Knee deep in the mire and dosen't mind picking Sh*t from his shoes then diversity can mean 3 picks from the top 3 three industries you expect to zoom... Or the top five sector peformers this quarter or a heavy handed helping of some great new technology stocks that have products or technology that is likely to become main stream and affect or improve some product or aspect of the greatest slice of the populations daily lives.
I read in more than one place that it seems to be consistantly that Small Cap/Mid cap stocks year in and year out offer the greatest oportunities for rediculous gains... and generaly speaking outperform the large caps. Most of us know why... and we also know that it's not as easy as that.. becasue for evey 500% one year run there are 20 that go nowhere and 150 that are total flops. BUT that is where effective stops come into play.
ON that topic... Larry Williams (I'm not a groupie... I honest) admits that to win his competition (Trading $10,000 into 1 Million in one year) he took risks he would not advise trader take with their own money. Took 10-15% risk to capital trades and had huge equity swings. He claims that it closing time his 1.whatever million dollars was actually down from 2million dollars. That there were weeks that were a living hell watching his equity swing from 400,000.00 to $90,000 and back up to $800,000. This makes suicide more understandable.
Just MO
Scott.
|
|
Registered User
Joined: 4/18/2005
Posts: 4,090
|
I've also noticed that at times when i'm trading mainly off charts I tend to automatically diversify.... but I still sometimes get big swings. The worst was getting a bunch of my GTC orders to fire off all in nearly one day.. had over 12 positions... many on a whipsaw, which wound up marking an intermediate term top. (buying breakout tops has it's drawbacks)
I've had lots of times when I had that many holdings ... some were dong great.. some ok others killing me. (why is that it only takes one bad egg to spoil the party ?) BUT the labor of managing that protfolio was considerble.
I try to limit myself to between 3-7 now.
Honestly I think a person could throw a dart at the news paper to pick a stock and just do what it takes to become intimately familiar with that stock and trade just that stock, what ever way was apropriate. I've eaven read that this is often quite lucrative.
As I understand that institutions and or persons that trade one or two comodities and specalize in those and only those do better than the average bear that runs to coffee this week and cocoa next week, msft tomorrow, S&P futures next month.
I'm considering taking the following approach in light of that.
find good candidates acordingthe the joint signal that occour during a zone just before a suspected to right after a new swing fan and stick with that stock till it seems like the trend is exhausted (not shure how i'll determine that yet) buying more along the way as new short term setups present rather than looking for 500 new aditions to dance in and out of . This is as I understand one of the big keys to Darvas's sucess. This is also less exciting on the day to day ... when new potential candidates come up every day. But Williams also mentioned that most traders he knows shoot them selves in the foot chasing the next hot stock... often dumping the current hot stock. (That is SOOOO ME). So holding longer... and buying more over time wont get me rich quick... but holding days buying allot (for me) and dumping quick.. wasn't getting my anywhere either... so as I see it this is another way ot put a few more odds on my side. I'd be curious to know what all the probabilities are for the various scenarios from 20,50 ma crossups,,, to buying on dwon days ferses after an up day, buying mprior tothe end ofna beginning of the month... etc etc... and try to acumulate a small treasure trove of small percentages in my favor for everything from entry day, entry type, trend set up type etc etc. But i'm shure they all conflict with each other... and then market conditions change and so those relationships change...... otherwise someone cleverer than I would have published them and been trading them.
Buying more of a stock has generaly been a bad experience for me... BUT I see how if this is employed logicaly it can, does and will work beautifuly. I think my main safeguard to giving back previous gain on a market reversal due to the most recent accumulation is to scale down my purchases as price goes up. So the first purchase is the biggest... All further purchases can either match (only in the case of a suspected new bottom) or be one unit of 100 LESS than the previous purchase. ANd then the stop management should obviously be considered... I thin the new aquisitions might hae a seperate stop untill price moved up again and then all holdings can have the same stop.
What do you think David?
|
|
Registered User
Joined: 6/6/2005
Posts: 1,157
|
That certainly seems like a great idea, Scott. I have toyed with the same idea myself. I read a book co-authored by Mark Crisp, a devotee, admirer, definitely a groupie of Darvas’ methods, and in that book he suggested looking only at stocks that are already up 50% for the year with the idea that stocks going to 100% have to pass through 50% and there you can find a lot of strength. He was touting CROX from the 20s and always has a small list of candidates. He also suggests focusing on smaller cap stocks, but not micro caps. I’m such a reversal trader that it’s hard to look at stocks up that much without the knowledge that they could collapsing at any moment.. I have run a few tests on buying stocks that are up 50% for the year and the results were okay.
I have always maintained that (my opinion) any system that works is a system that gives you a few choice picks you can place your energy on. A lot of picks is too confusing for me. When I see a list like The Top 100 hundred my head goes spinning. I like Diceman’s idea of the top 10. As I said also, the bottom 10 produces amazing results but requires amazing patience and wider swings and a lot of false starts. But that is what I am leaning towards lately. As you said, I would rather become an expert in a few stocks trading at levels that I know are profitable, exhibiting behavior I know to be profitable. If you look at many charts (in my opinion) a few small false starts are worth a big payoff. In the Market Wizards I heard that idea touted over and over – that traders seem to be reluctant to buy back into a stock that has hurt them or buy another at higher levels from which they sold.
The more I look at channels, and the more I test them (not to mention the use by the ever famous Turtle Traders) leans me in that direction. The use of channels with RSI seems to be working well.
Regarding buying on the way up, I agree that each new buy must be treated as a new trade but that the stop should be in line with the stops from previous buys which should be moving up with price. That way when the the stock goes south and your stop is hit it takes out all of your prior buys. In essence, the stop would make a loser out of you’re your final rebuy.
That’s another reason why I like the channels. They give me an instant stop zone and work very much like Darvas’ boxes. Each new break of a box would warrant a new buy for him. If price slid through the bottom of the breakout box he would sell. (It may be if price slid back into the breakout box he would sell. I have to read up on it again). In any event he traded the heck out of those strong stocks he found himself in with margin trades I would never dream of, but that doesn’t mean I can’t build up a strong position without margin.
I think this is as good a pursuit as any I have been involved in in the market. I heard a recent quote that I liked…
We’re in the market to make money…not have fun and make money.
This coupled with another one I heard:
Happiness can’t buy you money.
If I’m bored in the market but making money I will take that over being excited and losing money. I can find plenty other ways to have fun and be excited. Posting here is definitely one of them!
|
|
Registered User
Joined: 6/8/2006
Posts: 58
|
Hi Guys
Thanks for your posts re all indicators giving false signals. Sometimes I tend to get so involved in something that I tend to forget that important fact.
I tried plotting Rate of change for 22 days in the same window as this custom indicator. It seems to warn of "impending doom" a little earlier. It's interest to plot the two inthe same window. I think they complement each other well. I'd be interested to know what you think.
Cheers
Munaiba
|
|
Registered User
Joined: 4/18/2005
Posts: 4,090
|
"I’m such a reversal trader that it’s hard to look at stocks up that much without the knowledge that they could collapsing at any moment.. I have run a few tests on buying stocks that are up 50% for the year and the results were okay."-----
I'm with you there. I used to trade allot of momentum stocks that were already on the run ... looking for little consolidations or little valleys ... whatever .. and aside from 2006 being a banner year my results were alwayse mixed. Verry often i'd wind up picking the top. I'd like to meat the BEAR whose vacations I paid for. I also looked for established trends and kept the logic that "A trend in motion is likely to stay in motion"---- unless I buy it. I've learned allot since then so I still look for good trends but I keep more of a value sense of timing my purchases. What I can't decide on is wether it is necessary to fuss withtrying to time my purchases and swings with the major indexes or not. I've experiences and seen that there are dozzens of stocks that set up and followed through perfectly while the indexes were getting their throats cut....and recently read that some famous market dude said not to worry to much about the major indexes if you get a good signal from an underlying....It will probably be valid and only the smart money proffits becasue of the aura of fear.
"A lot of picks is too confusing for me" - - - I used to struggle with this allot... still do some times. my watchlists tend to get big... I'm getting better at being absolutely mean in grooming my nightly check list.
"As I said also, the bottom 10 produces amazing results but requires amazing patience and wider swings and a lot of false starts."---- I must not have caught that. I'd be curious for more information on how you ran your testing and the parameters? In my frustration I became obsessed with bottoms for several months. The logic being that I can't buy another top If I'm shopping in the Bottom store. Actually I like to do allot of hunting and fishing and to me this is so similar in approach. Many of us do the equilivant of going into the woods with a deer liscense, loaded for duck and dressed for turkey. But it can, despite all our complicated rationalizations, be so confusing... and there are so many oportunities. It reminds me allot of my fist Bow /Deer season. I'd pick a tree get in it on a archers stand before dawn (looking back I could have tripped over a bear then and never knew it) and the deer would take the trails out of range... so the next day or weekend I'd switch trees and they would be where I was the first weekend. Trading can be similarily frustrating. But eventually you nail some good ones, then you learn the patterns and position yourself so that which ever way they go eventually ones a a gonner.
I digressed ... I played allot with ideas of sectors and individual stocks that have recently crossed up through their 100XMA and held there.. Often an identifiable bottom formation was also present or close to finishing. I then learned that there are "fals bottoms" and "failed bottoms" but I think the logic is more sound. The longer a trend is in existance the nearer to it's end you are... on what ever time scale. So I try to get in early on short and intermediate term time frames.
I also noticed that i had a tendency to "Delist" candidates that i've been bitten on only to see them zoom on .. so now try to hang on to them till it's clear they don't fit my rules any more.
"The more I look at channels, and the more I test them (not to mention the use by the ever famous Turtle Traders) leans me in that direction. The use of channels with RSI seems to be working well."--- I'de like to know more about this .. I've got (I think) "The Way of the Turtle" Coming by Interlibrary loan. would yo udiscuss your RSI and channel settings?
I wonder if there is a way to automatically plot darvas boxes in TC or if they are a judgement based thing. I dont know enough about them.. BUT I will say that in donig a google search the highlighted buy points come at points I would never dream of buying... consider it chasing.. Perhaps Ineed to rethink? Of course they ALWAYSE show the picture perfect zooming trendline... they never show the one with 15 false starts that ate up the capital from the last three good trades. However that being said I don't know much about the Darvas system. I'd like to learn more. But it seems that there are any number of a dozzen websites claiming to be experts at teachign me to trade like Nicholas Darvas and have a big beautiful home .... just like him!
"Happiness can’t buy you money"----- I als heard that "... but it can buy the sort of misery I prefer" . .
|
|
Registered User
Joined: 6/6/2005
Posts: 1,157
|
Hey Scott,
I am not sure where it is but there is a post where Diceman outline a plan for picking the 10 strongest stocks in an index and that, historically, these performed better than the underlying index. I did the same with the bottom 10 and found the same. This was calculated during through a variety of different markets if I remember correctly. It was calculated by doing a custom date sort of a year in question and then choosing the bottom 10 and then going forward a year and seeing where those stocks were and how they performed. And then forward a quarter and then a month. I think that’s how it went if I remember correctly.
Regarding the channels and the RSI, I too was inspired by the Stocks and commodities article. I tested the information on the Russell 100 and found that the 5 period works best for me below a level of 5. For short term continuation trades I look for stocks that have traded up over 15% in a month with an RSI value of below 5 and initiate a position on the first inside day. (Visuals to come).
From there I dug out my copy of New Concepts in Technical trading by Welles Wilder and took a look at how the creator of the RSI interpreted his indicator. Turns out he used it as both an overbought/oversold indicator AND a divergence indicator. Using the channels, RSI10 and the 50% retracement line, I look for first stocks trading below the 50% retracement line, then for divergences, and finally for a break of the channel roof. Once I’m in I set my stop just below the channel floor and the rest is up to probability.
It’s interesting to note that Wilder also drew chart patterns on the RSI and said that these patterns many times foretold the direction of the actual chart patterns.
Very interesting.
I also agree with you regarding switching styles from week to week. i don't think that's good for anyone's performance. I'm pretty sure we all know the style of trading that works the best for us. I think it's important to build on those strengths. For me that means short term system generated trades with a target of 5-10%. Doesn't mean I can't dream up ways to pull 100% out of the market consistently -- but it does mean that I probably won't have the patience to get there in one trade. :)
David John Hall
|
|
Registered User
Joined: 1/28/2005
Posts: 6,049
|
I've discovered a different possible use for this indicator.
Chart the indicator in its normal form:
((MAXC22-L)/MAXC22)*100
Set the smoothing average to 12 exponential.
--------------------------------------------------------------------
There are 2 modes that this can be used.
1 is a short-term trading filter and the other is a longer-term
trend/trading type filter.
--------------------------------------------------------------------
For the longer-term filter apply a 63 day exp moving average
to the indicator.
The trend will tend to be bullish when the indicator is under
the average and bearish when it is above.
--------------------------------------------------------------------
If you look at a daily chart of CHL you can see this.
On approx. 3/30/2007 the indicator crosses under the MAV.
Indicating a bullish trend. ON approx. 7/26/2007 it crosses above
again indicating a possible bearish phase. On 8/30/2007 another
bullish phase is signaled.
-----------------------------------------------------------------
A shorter-term version of this can be created by changing the
63 moving average to 12.
Typical signals can be seen on SSL
Short on 2/27/2007
Buy on 3/26/2007
Short on 5/22/2007
Buy on 6/19/2007
Sell on 7/25/2007
Buy on 8/23/2007
While I wouldn't use these exclusively as buy/sell
indicators. They can give you a better feel for which
mode you should expect and if you are planning
a trade. When you may want to turn your
radar on.
The smoothing of 12 and the 12 and 63 lengths
are just values that looked good by eye.
As always experiment.
Thanks
diceman
|
|
Registered User
Joined: 4/18/2005
Posts: 4,090
|
That is kind of neat. I have a question for you. I'm reading his "The Right Stock at the Right Time" and I'm filled with questions... allot of good fundamental things there marekt wise. One thins in Chapter two he speaks about is the importance of keeping an eye on the bond market. I found something that looks like a Bond tracking vehicle in TC.. forget the ticker. Need to search for it.
Anyway he suggests applying a "volitility Stop" or "Folitility System" to the bond's tracking instrument. "This is a trend following mechanism that works by taking the range (each days high minus the low) for the past seven days and then multiplying this average range by a factor usually in the 2.0 to3.0 value. This is an amount of volitility, which is then subtracted from teh highest closing price int he uptrend....What is created is a filter band above and below the current price.
So how would a PCF for that look?
|
|
Registered User
Joined: 1/28/2005
Posts: 6,049
|
The difficulty is defining the "max close"
while the trade is open.
TC does not have that capability.
--------------------------------------------------------
You would have to use something like:
C-((AVGH7-AVGL7)*3) on the first day then
MAXC2-((AVGH7-AVGL7)*3) on the second day
MAXC3-((AVGH7-AVGL7)*3) on the third day
and so on until your stop is hit.
-----------------------------------------------------------------------
Of course you could put (AVGH7-AVGL7)*3 in
a watchlist tab and just subtract it from the highest
close reached while your trade is open or add it
to the lowest close on a short trade.
-------------------------------------------------------------
This could be a reasonable substitute:
(Using a 10 bar Moving linear regression of the close.
Then subtracting the H-L range.)
(AVGC10+4.5*((4.5*C +3.5*C1+ 2.5*C2+ 1.5*C3+ 0.5*C4 -0.5*
C5 -1.5*C6 -2.5*C7 -3.5*C8 -4.5*C9)/82.5))-((AVGH7-AVGL7)*3)
(select plot using price scale)
Thanks
diceman
|
|
Registered User
Joined: 4/18/2005
Posts: 4,090
|
This give me a line under the price... how can I get it to be above. The thing is the way this is suposed to be used is that when bonds pop through the top of it .... during a stock decline Larry claims that one should start preparing for an up swing and probably a reversal of down trend.
I thought I had found a way to track Gold and bonds in TC and lost the tickers. Don't know them do you?
|
|
Registered User
Joined: 4/18/2005
Posts: 4,090
|
That should be "T-Bonds"
|
|
Registered User
Joined: 1/28/2005
Posts: 6,049
|
"how can I get it to be above."
---------------------------------------
change the minus sign to a plus
sign.
(before the AVGH7)
Gold:
--------------------------
XGLD
or
GLD
--------------------
Bonds
FVX--X
CYX--X
TYX--X
TNX--X
IRX--X
BSV
SHY
Not sure what your are talking about with a break-out.
Sounds like some type of Bollinger Band could be
applied.
Thanks
diceman
|
|
Registered User
Joined: 4/18/2005
Posts: 4,090
|
Thanks.
|
|
Registered User
Joined: 1/1/2005
Posts: 2,645
|
QUOTE (diceman) The difficulty is defining the "max close" while the trade is open. TC does not have that capability.
diceman,
Suppose we go long SPY on 10/22/07. A plot of the "volatility stop" is given by:
(-1)*
((V1=2619441)*(MAXC1.1-3*(AVGH7.1-AVGL7.1))
+(V2=2619441)*(MAXC2.1-3*(AVGH7.1-AVGL7.1))
+(V3=2619441)*(MAXC3.1-3*(AVGH7.1-AVGL7.1))
+(V4=2619441)*(MAXC4.1-3*(AVGH7.1-AVGL7.1))
+(V5=2619441)*(MAXC5.1-3*(AVGH7.1-AVGL7.1))
+(V6=2619441)*(MAXC6.1-3*(AVGH7.1-AVGL7.1))
+(V7=2619441)*(MAXC7.1-3*(AVGH7.1-AVGL7.1))
+(V8=2619441)*(MAXC8.1-3*(AVGH7.1-AVGL7.1))
+(V9=2619441)*(MAXC9.1-3*(AVGH7.1-AVGL7.1))
+(V10=2619441)*(MAXC10.1-3*(AVGH7.1-AVGL7.1))
+(V11=2619441)*(MAXC11.1-3*(AVGH7.1-AVGL7.1))
+(V12=2619441)*(MAXC12.1-3*(AVGH7.1-AVGL7.1))
+(V13=2619441)*(MAXC13.1-3*(AVGH7.1-AVGL7.1))
+(V14=2619441)*(MAXC14.1-3*(AVGH7.1-AVGL7.1))
+(V15=2619441)*(MAXC15.1-3*(AVGH7.1-AVGL7.1))
+(V16=2619441)*(MAXC16.1-3*(AVGH7.1-AVGL7.1))
+(V17=2619441)*(MAXC17.1-3*(AVGH7.1-AVGL7.1))
+(V18=2619441)*(MAXC18.1-3*(AVGH7.1-AVGL7.1))
+(V19=2619441)*(MAXC19.1-3*(AVGH7.1-AVGL7.1))
+(V20=2619441)*(MAXC20.1-3*(AVGH7.1-AVGL7.1))
+(V21=2619441)*(MAXC21.1-3*(AVGH7.1-AVGL7.1))
+(V22=2619441)*(MAXC22.1-3*(AVGH7.1-AVGL7.1))
+(V23=2619441)*(MAXC23.1-3*(AVGH7.1-AVGL7.1))
+(V24=2619441)*(MAXC24.1-3*(AVGH7.1-AVGL7.1))
+(V25=2619441)*(MAXC25.1-3*(AVGH7.1-AVGL7.1))
+(V26=2619441)*(MAXC26.1-3*(AVGH7.1-AVGL7.1))
+(V27=2619441)*(MAXC27.1-3*(AVGH7.1-AVGL7.1))
+(V28=2619441)*(MAXC28.1-3*(AVGH7.1-AVGL7.1))
+(V29=2619441)*(MAXC29.1-3*(AVGH7.1-AVGL7.1))
+(V30=2619441)*(MAXC30.1-3*(AVGH7.1-AVGL7.1)))
plotted as a Custom Indicator with "Plot using price scale" checked. The plot is good for 30 days after entry but is easily extended for as long as one pleases. The v = 2619441 is the Volume of the stock on the entry date.
Thanks,
Jim Murphy
|
|
Registered User
Joined: 1/28/2005
Posts: 6,049
|
Correct bustermu
I should have stated:
TC does not have that capability "automatically".
thanks
diceman
|
|
Registered User
Joined: 1/1/2005
Posts: 2,645
|
QUOTE (diceman) I should have stated:
TC does not have that capability "automatically".
diceman,
I apparently do not know what "automatically" means. There is nothing about the PCF that has to be updated on a daily basis. It is good for however long one chooses to make it. For example, the Custom Indicator I gave will plot the stop a week from today without any modification at all.
The PCF does have an input as it would for any software. The input is the volume on the date of entry rather than, for example, the date of the entry.
Thanks,
Jim Murphy
|
|
Registered User
Joined: 4/18/2005
Posts: 4,090
|
(-1)*
((V1=2619441)*(MAXC1.1-3*(AVGH7.1-AVGL7.1))
+(V2=2619441)*(MAXC2.1-3*(AVGH7.1-AVGL7.1))
+(V3=2619441)*(MAXC3.1-3*(AVGH7.1-AVGL7.1))
+(V4=2619441)*(MAXC4.1-3*(AVGH7.1-AVGL7.1))
+(V5=2619441)*(MAXC5.1-3*(AVGH7.1-AVGL7.1))
+(V6=2619441)*(MAXC6.1-3*(AVGH7.1-AVGL7.1))
+(V7=2619441)*(MAXC7.1-3*(AVGH7.1-AVGL7.1))
+(V8=2619441)*(MAXC8.1-3*(AVGH7.1-AVGL7.1))
+(V9=2619441)*(MAXC9.1-3*(AVGH7.1-AVGL7.1))
+(V10=2619441)*(MAXC10.1-3*(AVGH7.1-AVGL7.1))
+(V11=2619441)*(MAXC11.1-3*(AVGH7.1-AVGL7.1))
+(V12=2619441)*(MAXC12.1-3*(AVGH7.1-AVGL7.1))
+(V13=2619441)*(MAXC13.1-3*(AVGH7.1-AVGL7.1))
+(V14=2619441)*(MAXC14.1-3*(AVGH7.1-AVGL7.1))
+(V15=2619441)*(MAXC15.1-3*(AVGH7.1-AVGL7.1))
+(V16=2619441)*(MAXC16.1-3*(AVGH7.1-AVGL7.1))
+(V17=2619441)*(MAXC17.1-3*(AVGH7.1-AVGL7.1))
+(V18=2619441)*(MAXC18.1-3*(AVGH7.1-AVGL7.1))
+(V19=2619441)*(MAXC19.1-3*(AVGH7.1-AVGL7.1))
+(V20=2619441)*(MAXC20.1-3*(AVGH7.1-AVGL7.1))
+(V21=2619441)*(MAXC21.1-3*(AVGH7.1-AVGL7.1))
+(V22=2619441)*(MAXC22.1-3*(AVGH7.1-AVGL7.1))
+(V23=2619441)*(MAXC23.1-3*(AVGH7.1-AVGL7.1))
+(V24=2619441)*(MAXC24.1-3*(AVGH7.1-AVGL7.1))
+(V25=2619441)*(MAXC25.1-3*(AVGH7.1-AVGL7.1))
+(V26=2619441)*(MAXC26.1-3*(AVGH7.1-AVGL7.1))
+(V27=2619441)*(MAXC27.1-3*(AVGH7.1-AVGL7.1))
+(V28=2619441)*(MAXC28.1-3*(AVGH7.1-AVGL7.1))
+(V29=2619441)*(MAXC29.1-3*(AVGH7.1-AVGL7.1))
+(V30=2619441)*(MAXC30.1-3*(AVGH7.1-AVGL7.1)))
deos not plot anything on screen. When "test formula" is clicked it returns a value of "0.00". what am I doing wrong?
|
|


Worden Trainer
Joined: 10/7/2004
Posts: 65,138
|
scottnlena,
Are you plotting this on SPY? It will not work correctly for any other symbol.
-Bruce
Personal Criteria Formulas
TC2000 Support Articles
|
|
Registered User
Joined: 1/1/2005
Posts: 2,645
|
QUOTE (scottnlena) what am I doing wrong?
Scott,
The stop is for a Daily chart of SPY with entry date 10/22/07. My guess is that you are not on the symbol SPY.
Thanks,
Jim Murphy
|
|
Registered User
Joined: 1/28/2005
Posts: 6,049
|
bustermu
"Automatic" refers to a style of software where you can seed a starting
variable automatically. You would setup whatever your buy conditions
are and when a buy is signaled the variable will be set (and incremented
and referenced in whatever fashion desired).
When a future buy is given the variable is set again and the process
repeats.
You are using a process where your knowledge is used to set the variable
(not the software) and requires a higher understanding of the PCF language.
(which volumes to use and not use and what is right and what is wrong,
what the "*-1" means and so on, what symbol you should be on)
Also an automatic version will require no editing as long as the trade is open.
Where you need to guess at a length and lengthen it if needed.
(also an automatic version would allow some type of quick backtest where as
you must define your trades then manually edit all of them)
So I guess I view that as a "manual" version.
(by the way Scott just confirmed my viewpoint)
Thanks
diceman
|
|
Registered User
Joined: 1/1/2005
Posts: 2,645
|
diceman,
Thanks for the response.
I see your point. As a trivial example, suppose we wish to count the number of market days since 10/22/07. In the sense you are using it, that cannot be done "automatically" by using a PCF. I would write a PCF that would work for a couple of months say, but I would not write one that would work much longer and it is not possible to write one that would work indefinitely.
Thanks,
Jim Murphy
|
|
Registered User
Joined: 4/18/2005
Posts: 4,090
|
I read in another thread about a "Diceman VIX" What is that one??? how is it different form above... It was probably mentioned before but I either missed it or was engaged in something else.
|
|
Registered User
Joined: 1/28/2005
Posts: 6,049
|
"Diceman VIX"
----------------------------------------------
None that I know of.
I once talked about testing the VIX.
That maybe what you are thinking of.
Thanks
diceman
|
|
Registered User
Joined: 7/28/2007
Posts: 118
|
Diceman,
Have you tried to create the synthetic vix Larry Williams mentioned in his article as a stochastic like oscillator? Can this be done in Telechart? I am not sure exactly what I would do with it yet until I get it and monkey around with it.....I am curious how this would compare to the standard stochastic available..
Thanks
Griz
|
|
|
Guest-1 |