| Welcome Guest, please sign in to participate in a discussion. | Search | Active Topics | |
Registered User
Joined: 1/15/2005
Posts: 13
|
I'm having trouble writing a formula for a period of price consolidation around a moving average. Please help. Thanks
|
|


Worden Trainer
Joined: 10/7/2004
Posts: 65,138
|
What have you tried so far and what issues have you encountered? Do you have a specific unambiguous objective definition for price consolidation in mind?
-Bruce
Personal Criteria Formulas
TC2000 Support Articles
|
|
Registered User
Joined: 1/15/2005
Posts: 13
|
Hi Bruce,
Tried the Trending/Consolidation 25 day formula, ( (MAXH25 - MINL25) / ((AVGH25 - AVGL25) * 25) ) <= 2. The stock count went from 6758 down to 6652.
Need something more discriminatory.
Just wondering if TCCharts have ready made formulas like in Tradestation for different chartpatterns?
eg, they have screens for pennant breakouts. etc?
Thanks in advance.
|
|
Worden Trainer
Joined: 10/7/2004
Posts: 65,138
|
You could try using the Trending/Consolidation (25) Day example Personal Criteria Formula that came with TeleChart without the added <= 2 at the end. You would then have a Value based PCF that you could use as an EasyScan Condition. If you set the EasyScan Rangefinder to Rank: (some arbitrary small value) to Min, you could limit the number of items returned.
Using EasyScan to find stocks that meet your own criteria
Definitions of all built in scanning and sorting criteria
You may wish to review the following for information on pattern recognition in TeleChart:
Falling wedge
Cup with a handle formation
PCF for cup with a handle
Scanning for Chart Patterns
Scanning for Stocks Printing a Double or Triple Bottom
PCFs for pennants and flags
PCF's for Triangles
Does TeleChart support Elliott Wave indicators?
Double top/bottom trend
Finding Double Tops and Double Bottoms
CUP AND HANDLE AGAIN
Finding Continuation Triangles And Wedges With Telechart
Cup & Handle PCF
That said, I personally do not think complex pattern recognition is practical in TeleChart using Personal Criteria Formulas and EasyScans. This is true of pattern recognition in general with the exception of fixed size candlestick patterns (which are fairly straightforward as long as the pattern is well defined):
Boolean PCFs for Candlestick Patterns
-Bruce
Personal Criteria Formulas
TC2000 Support Articles
|
|
Registered User
Joined: 1/15/2005
Posts: 13
|
Thanks for the quick reply. Will work on your suggestions.
|
|
Worden Trainer
Joined: 10/7/2004
Posts: 65,138
|
You're welcome.
-Bruce
Personal Criteria Formulas
TC2000 Support Articles
|
|
Registered User
Joined: 1/15/2005
Posts: 13
|
Dear Bruce,
Followed discussion thread but got stuck on this post in 2005 from jas0501. This led to a thread from 2005 that I can't find.
(As a matter of fact I did play around with the settings from the video. I then started messing with the chart to get the MA periods as fillins and the LRSs plotted based on a date pointer and then tuneable slope settings for the conditions and the chart got too tricky for a straight foward reverse enginneered dragon. I'll doit it again and share the simple implementation.
Just some Linear Regression Trendlines for the plots and some Linear Regression Slopes for the conditions. I added a weekly view for perspective. The red date pointers mark the same date. I'll share the Layout as David John Hall's Dragon shortly.
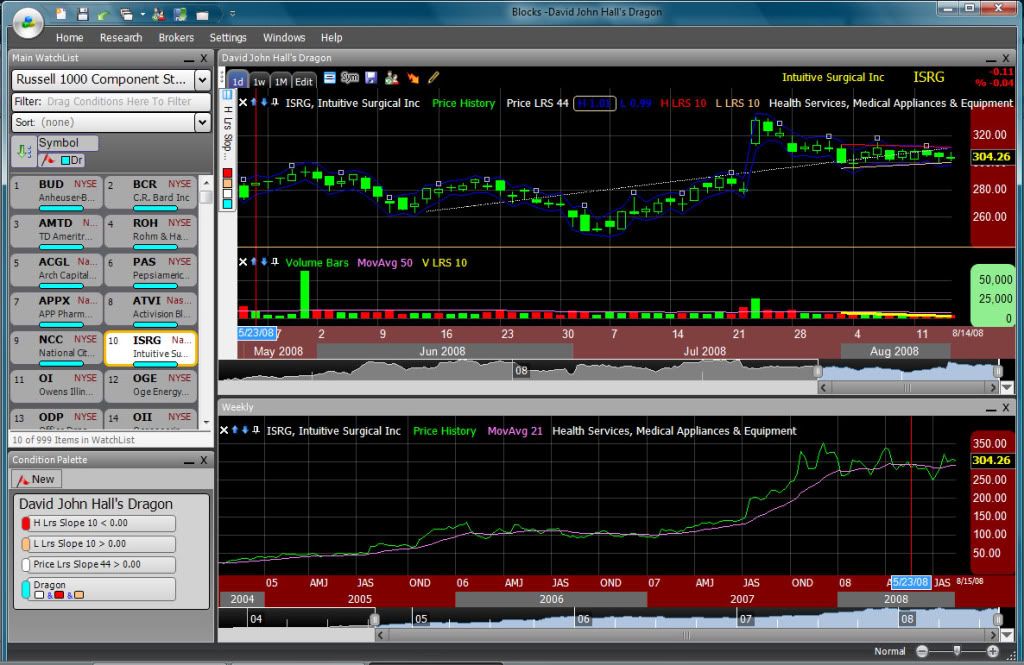
Can you go through the steps needed to program the
H LRS slope 10<0.00
L LRS slope 10>0.00
Price LRS Slope 44> 0.00?
Thanks
|
|
Worden Trainer
Joined: 10/7/2004
Posts: 65,138
|
QUOTE (bihiselo) H LRS slope 10<0.00
(4.5 * H + 3.5 * H1 + 2.5 * H2 + 1.5 * H3 + .5 * H4 - .5 * H5 - 1.5 * H6 - 2.5 * H7 - 3.5 * H8 - 4.5 * H9) / 82.5 < 0
QUOTE (bihiselo) L LRS slope 10>0.00
(4.5 * L + 3.5 * L1 + 2.5 * L2 + 1.5 * L3 + .5 * L4 - .5 * L5 - 1.5 * L6 - 2.5 * L7 - 3.5 * L8 - 4.5 * L9) / 82.5 > 0
QUOTE (bihiselo) Price LRS Slope 44> 0.00
(21.5 * C + 20.5 * C1 + 19.5 * C2 + 18.5 * C3 + 17.5 * C4 + 16.5 * C5 + 15.5 * C6 + 14.5 * C7 + 13.5 * C8 + 12.5 * C9 + 11.5 * C10 + 10.5 * C11 + 9.5 * C12 + 8.5 * C13 + 7.5 * C14 + 6.5 * C15 + 5.5 * C16 + 4.5 * C17 + 3.5 * C18 + 2.5 * C19 + 1.5 * C20 + .5 * C21 - .5 * C22 - 1.5 * C23 - 2.5 * C24 - 3.5 * C25 - 4.5 * C26 - 5.5 * C27 - 6.5 * C28 - 7.5 * C29 - 8.5 * C30 - 9.5 * C31 - 10.5 * C32 - 11.5 * C33 - 12.5 * C34 - 13.5 * C35 - 14.5 * C36 - 15.5 * C37 - 16.5 * C38 - 17.5 * C39 - 18.5 * C40 - 19.5 * C41 - 20.5 * C42 - 21.5 * C43) / 7095 > 0
You may wish to review the following:
Using Linear Regression vs Classical Peaks/Valleys for Divergence Analysis
How to create a Personal Criteria Forumula (PCF)
PCF Formula Descriptions
-Bruce
Personal Criteria Formulas
TC2000 Support Articles
|
|
Registered User
Joined: 1/15/2005
Posts: 13
|
Thank you for the quick reply, Bruce.
Could you also go thru the steps on how to write these three formulas on Stockfinder?
Or is that a separate forum? If so, please give directions to get there.
Thanks
|
|
Worden Trainer
Joined: 10/7/2004
Posts: 65,138
|
The Ask a Trainer - StockFinder forum would be the correct place for StockFinder questions.
That said, you don't need to create formulas to do this in StockFinder. You could add 1-Period Moving Average of OHLC Indicators to Price History to extract the Highs and Lows and then add Linear Regression Slope of Indicator Indicators to Price History and the Moving Averages.
Chart Basics
Right-clicking on the LR Slope Indicators would allow you to create Rules.
Rule Basics
On another note, I'm pretty sure the Finding Continuation Triangles And Wedges With Telechart topic contains the name of a Shared StockFinder Layout to screen for "Dragon" pattern.
-Bruce
Personal Criteria Formulas
TC2000 Support Articles
|
|
Registered User
Joined: 1/15/2005
Posts: 13
|
Thank you, Bruce.
I'm having trouble writing a rule for an upward sloping LR trendline.
I have the LR slope 'moving up quickly', yet the LR trendline on some of the stocks found are moving down.
I had set both the LR slope as well as the LR trendline @44 days.
The same problem is seen with the LR slopes of the MAs.
The LR slopes on the sort are heading in different directions from the LR trendlines on the charts.
These I had set @10 days.
Help
|
|
Worden Trainer
Joined: 10/7/2004
Posts: 65,138
|
QUOTE (bihiselo) I have the LR slope 'moving up quickly', yet the LR trendline on some of the stocks found are moving down.
You need to test for the LR Slope to be Greater Than Value: 0 instead of Moving Up.
QUOTE (bihiselo) The same problem is seen with the LR slopes of the MAs.
The solution is the same.
-Bruce
Personal Criteria Formulas
TC2000 Support Articles
|
|
|
Guest-1 |