Registered User
Joined: 3/27/2011
Posts: 56
|
The recent webinar on pivot points and fibs has inspired me to post this image. Perhaps other people will post their pictures of wonder examples of fib lines at play. Here is an hourly chart of gold.

|
|

Registered User
Joined: 2/28/2005
Posts: 825
|
That is a nice chart, I would ask you (next time) to consider a chart post something smaller like 800x600 or so sir. Even with a 21" monitor I still have to scroll to see all of your chart at once. Worden discussion areas are not smart enough to restrict the text going across the screen but rather will default to the size of the largest chart.
Here's a chart of ACN which you asked for. Note 78.6 retracement line bolded. Should Price fall beyond that line the next logical target as it retraces (per Mark Braun tutorials) should be the 127% resistance.

|
|
Registered User
Joined: 1/28/2005
Posts: 6,049
|
I asked a random number generator for three numbers between gold’s price. (153.61 and 142.55)
I received:
150.33.
This provided resistance at 4/28, 5/4 and 5/27 to today.
146.33
This provided resistance/support at 4/18 to 4/27, resistance at 5/16 and 5/18
144.23
This provided resistance at 4/11
Once we broke thru on 4/15 we rallied to 153.61
This also provided support for the bottoms at 5/5 and 5/17.
Once you draw a line on a chart it will always be correct.
If price turns there, you will say it predicted it.
If price never touches it, you will say it held.
If price goes thru, you will say it failed.
Thanks
diceman
|
|
Registered User
Joined: 2/28/2005
Posts: 825
|
I was agasp when I drew fib lines (time after time going both forward, & retracing down), on monthly chart. I found I could draw them back as many years on a month or a Quarterly chart as I wanted. Then to follow those lines as I drilled down into the weekly and the daily charts. It will make your random generator smoke in an attempt to figure out how fib targets those lines.
I surely do not have the skills you have but have enjoyed the exercise. And at this time, suspect I may of learned something by observing those lines.
So far I can say of this learning project " it's holding"
art
|
|
Registered User
Joined: 2/28/2005
Posts: 825
|
|
|
Registered User
Joined: 3/27/2011
Posts: 56
|
I would like to apologize for the extra large graph size. In responses to Diceman's
QUOTE (diceman)
I asked a random number generator for three numbers between gold’s price. (153.61 and 142.55)
I received:
150.33.
This provided resistance at 4/28, 5/4 and 5/27 to today.
146.33
This provided resistance/support at 4/18 to 4/27, resistance at 5/16 and 5/18
144.23
This provided resistance at 4/11
Once we broke thru on 4/15 we rallied to 153.61
This also provided support for the bottoms at 5/5 and 5/17.
Once you draw a line on a chart it will always be correct.
If price turns there, you will say it predicted it.
If price never touches it, you will say it held.
If price goes thru, you will say it failed.
Thanks
diceman
Haha. I get it. Fibb retracements work for a variety of reasons, one being that almost EVERYONE uses them, and the big marketmakers or fund managers definately use them. I personally have my own trading system I use that doesn't include fib lines but more of a trendy volume thing. It's just fun to see manipulation at play,
|
|
Registered User
Joined: 2/28/2005
Posts: 825
|
Yup. You got it now aks. Not sure if it was Mark Braun, or somebody else who said something like "I never know what news will happen in the world. Whether it will be good or bad. But it always seems to happen about the right time". <for the fibs>
Still a mentor of mine (whom I have looked up to for years) said (just today as a matter of fact):
If price never touches it, you will say it held.
If price goes thru, you will say it failed
Then we can try something else lol
|
|
Registered User
Joined: 1/28/2005
Posts: 6,049
|
QUOTE (alindsley) "I never know what news will happen in the world. Whether it will be good or bad. But it always seems to happen about the right time".
Its funny, there was a time when I thought it would be of use to “get to know” individual stocks.
Merck was on my list.
I looked at all types of historical data and valuation metrics.
I reached the conclusion it was way overvalued.
Things were good and it was making tons of money,
I couldn’t figure out what would make it go down but I knew it should.
Just then Hillary Care was announced, the whole drug/healthcare sector sold off from the idea the government would get involved.
Amazing how that stuff works.
Thanks
diceman
|
|
Registered User
Joined: 2/28/2005
Posts: 825
|
Those socialists ought to go live over there in Iran or Iraq and take that one term pres, & peloski gal with them. They love those folks so much. Somebody oughta put them on a plane and airdrop them out in the mountains close to the folks they love so much before this Nation is destroyed.
sorry I'll get off my bandwagon. My apologies
|
|

Registered User
Joined: 6/15/2008
Posts: 1,356
|
My crystal ball is programmed based on fib numbers:
look at the XYZ followed by a break of the A level, followed by predicted B,C,D,E,F levels.
pretty darn accurate at times, but then again so is the Diceman's randomly drawn line. I like to believe that the fib targets are a tad more of a higher probability then random targets.
below also the GLD hourly :
screencast.com/t/7h5aepRs
scrolling forward to the most current bar shows a new XYZ pattern with price hovering around the A level. Does it stay above A then we can expect a move towards the B at 152.12 which also confirms with current resistance level. if it goes lowe and breaks the XYZ down A level then a next move down will be calculated.
screencast.com/t/1zFiUuJhjZ
|
|
Registered User
Joined: 3/27/2011
Posts: 56
|
QUOTE (alindsley) Those socialists ought to go live over there in Iran or Iraq and take that one term pres, & peloski gal with them. They love those folks so much. Somebody oughta put them on a plane and airdrop them out in the mountains close to the folks they love so much before this Nation is destroyed.
sorry I'll get off my bandwagon. My apologies
Hahaha. It seems just a tad bit funny that things got quiet after that statement. But if talking about politics, I'd have to admit things aren't looking too good.... Back to FIB diagrams PLEASE! :)
|
|
Registered User
Joined: 2/28/2005
Posts: 825
|
aks there is something in the fib world called symmetry. Notice how fib lines are nestling together here. If one
fib line makes resistance, how much stronger can several be? All these do is provide potential targets of course.as we well know.

|
|
Registered User
Joined: 3/27/2011
Posts: 56
|
QUOTE (alindsley) aks there is something in the fib world called symmetry. Notice how fib lines are nestling together here. If one fib line makes resistance, how much stronger can several be? All these do is provide potential targets of course.as we well know.
Ah! I've done some reading on this theory that if multiple fib lines of different trends rest on the same position that those should be used as critical price zones with price action to watch. You're right with your thinking.
|
|
Registered User
Joined: 2/28/2005
Posts: 825
|
And if this doesn't work we can always get one of those random number generator to help us out.
All in fun diceman.
art
|
|
Registered User
Joined: 8/26/2010
Posts: 37
|
NFLX Yes the power of the FIB got to the 261 extention res then droped like a rock
http://screencast.com/t/iP9RWyclj
cheers
|
|
Registered User
Joined: 3/27/2011
Posts: 56
|
Another great example. About 1/2 way through the drop I got myself some weekly puts :)
|
|
Registered User
Joined: 2/28/2005
Posts: 825
|
I zoomed in a little closer with TDA's Fib Extensions. Note how Price "held" then retraced at a predictable 78.6%.
Normally should 78.6 "not hold" then predictably 127% is the next target to aim for.,

|
|
Registered User
Joined: 1/28/2005
Posts: 6,049
|
Well remember, NFLX sells media content, my guess is NFLX watched a “trading experts” DVD series on fib lines.
(that’s why it understand them so well) 
Thanks
diceman
|
|
Registered User
Joined: 12/2/2004
Posts: 1,775
|
I strongly believe that fib lines on a chart are voodoo witchcraft. All of the examples above prove nothing other than the fact of chance if enough lines are drawn on a chart, especially when coupled with liberal or subjective placement of start/end points of a move, approximations, etc. Anyone considering fib lines in their trading should imo read the numerous detailed articles and studies proving the fallacy of fibs as an edge for trading or investing. Interesting that I have yet to find an intelligent indepth article proving the viability of fibs as an edge in trading. I used them once early in my career but quickly got wise to the snake oil after self educating. Just did a quick google and found these two links that do a good job of explaining the indicator's fallacy. There is one super indepth famous study penned by a well educator I read years ago but can't find it, but again these two shorter pieces go over the same strong points quite well.
http://www.welcometothegutter.com/2009/04/why-most-technical-indicators-are.html
http://www.yourtradingcoach.com/Articles-Technical-Analysis/Fibonacci-Illusion.html
|
|
Registered User
Joined: 2/28/2005
Posts: 825
|
I gleaned some truth (for me) from the 2nd link
" this is an argument that has been going on forever on trading forums without ever finding any common ground."
So I've been following you a number of years friend. And after all those systems you have discussed through too many forums to count -- May I ask do you now only watch price and volume? I have read many advanced traders do come to that point in their trading maturity? I sincerely would like to know!
No more dragons?  How boring lol How boring lol
|
|
Registered User
Joined: 12/31/2005
Posts: 2,499
|
QUOTE (fpetry)
I strongly believe that fib lines on a chart are voodoo witchcraft. All of the examples above prove nothing
other than the fact of chance if enough lines are drawn on a chart, especially when coupled with liberal or
subjective placement of start/end points of a move, approximations, etc. Anyone considering fib lines in
their trading should imo read the numerous detailed articles and studies proving the fallacy of fibs as an
edge for trading or investing. Interesting that I have yet to find an intelligent indepth article proving the
viability of fibs as an edge in trading. I used them once early in my career but quickly got wise to the snake
oil after self educating. Just did a quick google and found these two links that do a good job of explaining
the indicator's fallacy. There is one super indepth famous study penned by a well educator I read years
ago but can't find it, but again these two shorter pieces go over the same strong points quite well.
http://www.welcometothegutter.com/2009/04/why-most-technical-indicators-are.html
http://www.yourtradingcoach.com/Articles-Technical-Analysis/Fibonacci-Illusion.html
In reading the second link the most telling information is the comments that followed. Commenter
"anonymous" was so confident he didn't use his name, but he sure did beleive in fib lines despite the logic
of the link's content. One can't reason with someone who's got the faith!
==================================================================
Fib lines and most other indicators provide impetus to act with a certian "unfounded" confidence. Random
chance provides the profit. Pulling the trigger, to get in, and more importantly to get out is the hard part.
For most, taking full responsibility for the act can be very damaging to the trader's ego when the trade goes bad.
Having some indicator to put some faith into is more an ego protection divice then a predictive agent.
==================================================================
The best systems are reversion to the mean systems, except when they aren't!
|
|
Registered User
Joined: 1/28/2005
Posts: 6,049
|
QUOTE (jas0501) The best systems are reversion to the mean systems, except when they aren't!
As long as you revert from or to fib levels.
|
|
Registered User
Joined: 2/28/2005
Posts: 825
|
In an attempt to return to the original subject of this topic I present my chart for a short potential VRUS. Note where the breakout stopped this morning. It's all random of course, but one could watch the 38.2 retracement. If this is to continue as a strong uptrend this line should hold. If not my best random guess is a retracement to 61.8 then 72

|
|
Registered User
Joined: 6/15/2008
Posts: 1,356
|
QUOTE (alindsley) In an attempt to return to the original subject of this topic I present my chart
Can't see your charts alindsley.
try tinypic.com
thx,
P
|
|
Registered User
Joined: 2/28/2005
Posts: 825
|
Egads. I"m looking at it p. But that makes sense and I always appreciate when
you paste a link vs huge charts in these forums so here goes. Let me know if you
have any problems with it.
Although I'm not sure why you cannot see what I posted hmmmm.
img824.imageshack.us/img824/7599/vrus.png
|
|
Registered User
Joined: 2/28/2005
Posts: 825
|
This zoom'd chart might show things better. Blue lines are fib regression and fib expansion lines
img811.imageshack.us/img811/5613/vrus2.png
|
|
Registered User
Joined: 6/15/2008
Posts: 1,356
|
QUOTE (alindsley) Let me know if you have any problems with it.
perfect.
thx,
P.
|
|
Registered User
Joined: 6/15/2008
Posts: 1,356
|
QUOTE (fpetry) I strongly believe that fib lines on a chart are voodoo witchcraft.
Witchcraft or not, it's working for me. Just closed out a weekly JPM puts with well over 100% profit.
http://screencast.com/t/sOfLrSbQ
but interesting articles, thx,
P.
|
|
Registered User
Joined: 6/15/2008
Posts: 1,356
|
to eliminate the obvious subjectivity of where to anchor, and how many retracements you want to place on your chart, I only use one method.
I think we can all agree on that price after an exhaustion point, retraces a portion of a previous move before continuing in the previous direction, which creates zig-zags, ABC's or whatever you want to call it.

Determine Z as at least a certain percentage of the X-Y move. Use the fib 23.6% value for this. Once Price makes a turnaround at Z then add the previous calculated value to Z to determine point A. If Price breaks out over A, the probability is there, that it will continue to B. B is calculated by adding that same value to A. if it breaks out over B then calculate C, and so on.
If you think the world, inclusing stock charts is glued together by Fib numbers then 23.6% is recommended, althoug 25% is used as well, and noted to have slightly better results. But of course you could use your own made up percentage-number. Dicemannaci is popular as well :-)
|
|
Registered User
Joined: 12/2/2004
Posts: 1,775
|
QUOTE (alindsley) May I ask do you now only watch price and volume? ! No more dragons? How boring lol
Hi alindsley. Price and volume in conjunction with pattern recognition my bread and butter, along with trendlines and S/R levels. I use a few indicators, but always as secondary to price/volume/pattern, for verification. My default template has the 20 simple and 50 ema with price candles, second window pure volume but sometimes will overlay OBV. Last or third window are some Worden proprietary price leading indicators...BOP, MS, maybe TSV, and I keep this last window invisible and only open it when honing in on a stock I'm considering for primary watchlist or possible immediate buy. No more dragons? I've always considered them about identical to a bull flag or pennant, a fav setup of mine, so I still like em obviously:)
After reading my intial post with witchcraft and voodoo labels for fibs, I plead guilty to a touch of hyperbole. I'll just say that imo fibs are hocus pocus, quija board stuff.
|
|
Registered User
Joined: 2/28/2005
Posts: 825
|
I came across some freeby Mark Braun Tutorials on his site one day and really got into his fib teachings
(is how I got serious).
Then, for maybe the 2nd time in my trading career, I purchased a special he was running on some more videos.
Now I'm hooked. Time will tell if its the quija board or the whippin board of the Lord whom has be trapped with
the fib disease. Mark is a very good teacher in my never to be humble opinion. And like everyone I've met up
with some lousy ones.
|
|
Registered User
Joined: 2/28/2005
Posts: 825
|
WEST might be something you would like aks
I suspect once it breaks out above that 78.6% line that it should move again
bot some yesterday @ 2.35
img818.imageshack.us/img818/2328/westi.png
Any thoughts from my guru's ? Do I need to get out or am I safe?
I ask because I seldom buythese cheaper stocks.
|
|
 Gold Customer Gold Customer
Joined: 4/10/2006
Posts: 954
|
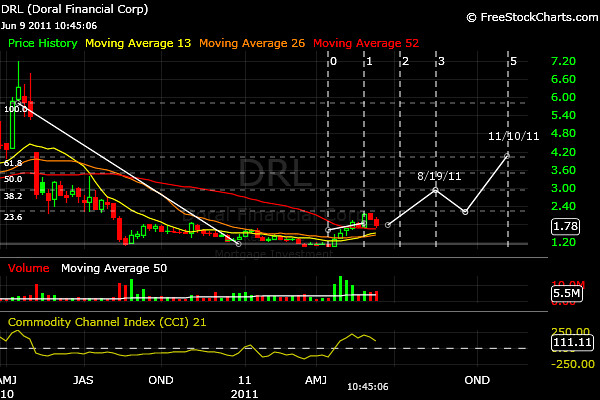
At quantum-worship.com they recommend overlaying fib retrace, fibi timeline to predict the outcome.
They state tho it may not happen in this Universe there are infinite universes and timelines therefore its just a matter of being or knowing you are in the correct universe for the particular predicted outcome to become a fact.
So here is my prediction: "I will be right some where"
* wave 1 $2.20
* wave 3 $2.90 - 3.10
* wave 5 $4.20 by Nov.
|
|
Gold Customer
Joined: 4/10/2006
Posts: 954
|
I use a combination of
* quantum mechanics
* numerology
* moving averages
* volume analysis
* and karma
(I dont believe in astrology)
|
|
Registered User
Joined: 1/8/2005
Posts: 118
|
Does anyone find fib retracements useful in daytrading?
|
|
Registered User
Joined: 2/28/2005
Posts: 825
|
Fibs work in all time frames as does most every other indicat or or drawing. I watch them closely (only in the attempt of creating a better buy as I trade longer term then you), but keep them in relationship to what is going
on in the daily aspect of things Isaloga. Search for Mark Braun and check out his free stuff. He mostly trades markets I do not understand, but what he teaches has merits for anything we want to trade.
Just my never to be humble opinion heh
good luck
art.
|
|

Registered User
Joined: 2/5/2006
Posts: 1,148
|
sorry, i don't see the beauty in fibs lines. they are just a guide of where something might happen, nothing more.
|
|
Registered User
Joined: 3/27/2011
Posts: 56
|
QUOTE (funnymony) sorry, i don't see the beauty in fibs lines. they are just a guide of where something might happen, nothing more.
Well then. If you say so yourself. Tell us about your discontent :P
On another note, I've been reading about the Fibonacci sequence and ratios and have been given with these examples of how the sequence can be seen in nature. I would have to say, the markets are anything but natural, but it's quite an interesting idea.
|
|
 Platinum Customer Platinum Customer
Joined: 3/23/2005
Posts: 2
|
What Program are you using for the fib lines in this shot? I like the way it lays them out.
Thanks!
QUOTE (alindsley) That is a nice chart, I would ask you (next time) to consider a chart post something smaller like 800x600 or so sir. Even with a 21" monitor I still have to scroll to see all of your chart at once. Worden discussion areas are not smart enough to restrict the text going across the screen but rather will default to the size of the largest chart.
Here's a chart of ACN which you asked for. Note 78.6 retracement line bolded. Should Price fall beyond that line the next logical target as it retraces (per Mark Braun tutorials) should be the 127% resistance.
|
|
Registered User
Joined: 3/27/2011
Posts: 56
|
QUOTE (wallstrt) What Program are you using for the fib lines in this shot? I like the way it lays them out. Thanks! QUOTE (alindsley) That is a nice chart, I would ask you (next time) to consider a chart post something smaller like 800x600 or so sir. Even with a 21" monitor I still have to scroll to see all of your chart at once. Worden discussion areas are not smart enough to restrict the text going across the screen but rather will default to the size of the largest chart. Here's a chart of ACN which you asked for. Note 78.6 retracement line bolded. Should Price fall beyond that line the next logical target as it retraces (per Mark Braun tutorials) should be the 127% resistance.
That is THINKORSWIM my friend. www.thinkorswim.com
TDAmeritrade also has this platform available for download.
|
|
|
Guest-1 |