Registered User
Joined: 3/16/2006
Posts: 2,214
|
|
|

Registered User
Joined: 7/1/2008
Posts: 889
|
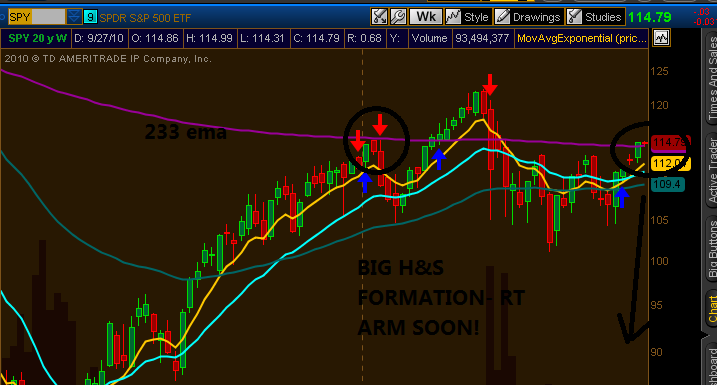
What about the inverted H&S, which seems more valid?
|
|

Registered User
Joined: 2/5/2006
Posts: 1,148
|
low volume rally, getting overbought, wouldn't be a surprise if it failed, given the volatility of the markets. don't see it turning on a dime, though. a rally thats lasted this long has some staying power.
sig likes his 233 day ma.
|
|

Registered User
Joined: 3/21/2006
Posts: 4,308
|
My two cents worth:
If you look at the daily chart of the SPX using Money stream you can see that the last consolidation top we had back in early August was a culmination of a July rally. Compare that to the current consolidation that culminated due to the September rally. Money stream shows a more pronounced accumulation pattern and is way above its 60 day sma where as back in August the pattern was below this moving average and the pattern was much weaker.
I do not pay attention to diverging TSV during times of consolidating price patterns due in part to the fact that TSV relies heavily on price, much more so than BOP & Money Stream. Still one cannot know for sure where we are going from here of course as a consolidation is just a product of indecision and we can only wait and react. My best guess would be that we are heading up {after a possible head fake}.....
Just my opinion....
|
|
Registered User
Joined: 3/21/2006
Posts: 4,308
|
QUOTE (funnymony) low volume rally, getting overbought, wouldn't be a surprise if it failed, given the volatility of the markets. don't see it turning on a dime, though. a rally thats lasted this long has some staying power.
sig likes his 233 day ma.
Low volume & over-bought? Which indicators are you looking at? Not to start trouble but I see a rising volume throughout this rally as shown in my bottom window with a rising linear regression line since day one of the rally. None of my indicators are showing over-bought. My RSI {Wilders} is sitting right at 50...
Just curiouse about how you are seeing things different than I am. I assume that we are looking at the same information.
|
|
Registered User
Joined: 3/21/2006
Posts: 4,308
|

|
|
Registered User
Joined: 3/21/2006
Posts: 4,308
|

|
|
Registered User
Joined: 2/5/2006
Posts: 1,148
|
i'm overlaying my volumes bars with a 60 dma. the volumes bars do not penetrate the 60 dma on my charts.
looking at your chart the 5 of the last 7 bars are also red.
as far overbought, i'm referring to breadth indicators, (put/call ratio, % above 50dma)) and they are getting extreme.
|
|
Registered User
Joined: 3/21/2006
Posts: 4,308
|
Ok, thats cool. I understand the "Put/Call Ratio" gauge.. But the red volume bars is subjective as they give no indication as to market participants. Accumulation can take place on red candles as well as distribution on green.....
No problem, just trying to get your perspective.
Thanks for sharing.
|
|
Registered User
Joined: 2/5/2006
Posts: 1,148
|
just said "low volume" not "declining volume".
volume has been a tricky indicator in this market, especially on the upside. money flow has been more reliable.
|
|
Registered User
Joined: 12/21/2004
Posts: 902
|
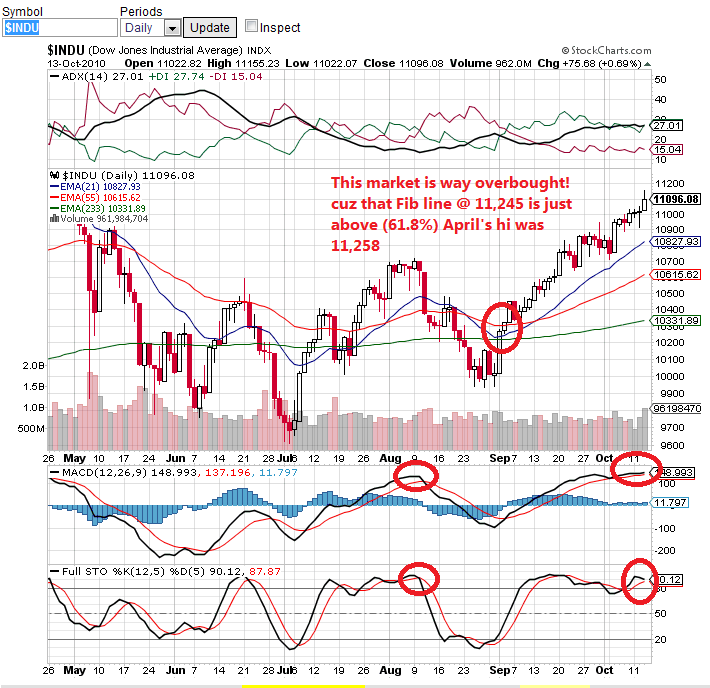
I gotta chime in on the "overbought" - T114 is way below 10% and way into what I consider "snapback" category - I went short this morning (inverse ETFs) - it looks to me like the S*P drive through 1150 (the right hand shoulder) is going to fail bigtime
|
|
Registered User
Joined: 3/21/2006
Posts: 4,308
|
How are you Hohandy? Nice to have you back on the forum.
When I look at the Worden market indicators using the line charts I see everything going Bullish right now.
McClellan Oscillator
Cumulative Volume
26 week new high/low
% stocks over 200 sma
% stocks over 40 sma
Trin
Tick
Vix
They are all in Bullish territory right now and if you view the SPX on the line chart it to is pointing North.
It is good to get so many different points of view, after all that is what makes the Markets move.....
|
|
Registered User
Joined: 2/5/2006
Posts: 1,148
|
QUOTE (Apsll) How are you Hohandy? Nice to have you back on the forum.
When I look at the Worden market indicators using the line charts I see everything going Bullish right now.
McClellan Oscillator
Cumulative Volume
26 week new high/low
% stocks over 200 sma
% stocks over 40 sma
Trin
Tick
Vix
They are all in Bullish territory right now and if you view the SPX on the line chart it to is pointing North.
It is good to get so many different points of view, after all that is what makes the Markets move.....
the markets coming off its best september in 81 years. thanks for stating the obvious. lol.
|
|
Registered User
Joined: 3/21/2006
Posts: 4,308
|
QUOTE (funnymony) Low volume rally, Wouldn't be suprised if it failed.
the markets coming off its best september in 81 years. thanks for stating the obvious. lol.
Yes despite the low volume. And you are welcome, I hope you were savy enough to actually make money "Funny"....
|
|
Registered User
Joined: 3/16/2006
Posts: 2,214
|
this is gonna be a good ROLLERCOASTER ride into the deep bowels of hell!
|
|
Registered User
Joined: 1/28/2005
Posts: 6,049
|
QUOTE (signaltap) this is gonna be a good ROLLERCOASTER ride into the deep bowels of hell!
Kingda Ka
Thanks
diceman
|
|
Registered User
Joined: 3/16/2006
Posts: 2,214
|
http://i196.photobucket.com/albums/aa104/signaltap2/hurt1.png
|
|
Registered User
Joined: 7/1/2008
Posts: 889
|
looks like it's a bottle rocket upward
|
|
Registered User
Joined: 2/5/2006
Posts: 1,148
|
i think some people might have been caught short today. lol.
|
|
Registered User
Joined: 1/28/2005
Posts: 6,049
|
QUOTE (funnymony) i think some people might have been caught short today. lol.
Any time you see "deep bowels of hell" in a market
description get ready for a reversal.
(although we never really got started.)
Thanks
diceman
|
|
Registered User
Joined: 2/5/2006
Posts: 1,148
|
QUOTE (diceman)
QUOTE (funnymony) i think some people might have been caught short today. lol.
Any time you see "deep bowels of hell" in a market
description get ready for a reversal.
(although we never really got started.)
Thanks
diceman
i think we might need a tad more technical evidence before we can make the "deep bowels of hell" call.
|
|
Registered User
Joined: 3/21/2006
Posts: 4,308
|
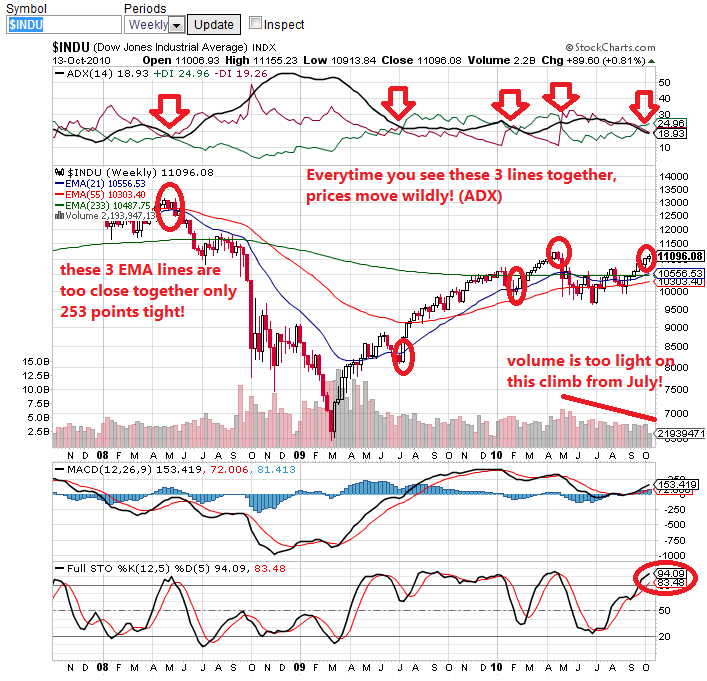
If you draw a trend line on all the major indexes from mid 2007 highs across the April 2010 highs you will see that it could prove critical very soon if not now.
NYSE - Popped up and over this resistance trend line
DOW - Popped up and over
RUSSEL 2000 - Well below this trend line
NASDAQ - Well bellow
SPX - Just now toching it
SPY - Just bellow
If you plot the Money Stream on the SPY as I have done in the bottom window of my following chart, you will see that it is still rising. Maybe a clue or maybe not. Since the DOW and the NYSE ar currently already over this resistance level that might be another clue. The NASDAQ still has a long way to go.
Just some food for thought. Here is the chart.

|
|

Registered User
Joined: 6/15/2008
Posts: 1,356
|
SPY weekly, from a DeMark point of view:
previous April highs printed a TD-sell setup, but the TD-sequential countdown did not reach 13. it got to 12, and the 13 has been deferred.
It will finish bar 13 if the following is true:
price.close has to be same or higher then the high two bars ago. and price.high has to be same or higher then the close of bar 8 of the countdown.
the close of bar8 is 116.58 and the high two bars ago is 114.9.
so if we close this week at 116.58 or higher, the countdown is complete.

|
|
Registered User
Joined: 6/15/2008
Posts: 1,356
|
It's the high of bar 13 that has to be higher then the close of bar8. Today's high is indeed higher then the close of bar8 which was 116.58. so this week completes a TD-sequential sell sequence.
|
|
Registered User
Joined: 7/1/2008
Posts: 889
|
central banks pursuing QE...they're going to push liquidity into the markets...don't fight the Fed...stock prices melting up
commodities exploding!
|
|
Registered User
Joined: 1/10/2005
Posts: 8
|
I agree with the H&S pattern.. Other things to note besides the falling volume on this rally. SPY came off a double bottom in early september (even gapped) then punched thru the 50da MA and the current divergence
from that average is warning #1, second a continuous falling of OBV, third the market is Overbought on many fronts... BUT.. the real test in my mind is the support at the neckline of the double bottom (113). This has to be in my trading experience THE TEST.. given the current Bullishness of the markets (here and abroad) I would likely use SPY 113 to determine my next move.. if we cut thru it like butter I would be short the market if we hold and start accumulation there I would be all over the Bull side.. This would be a big confirmation for the upside to me... Dean
|
|
Registered User
Joined: 3/21/2006
Posts: 4,308
|
I say open the gate and let the Bulls out....

|
|
Registered User
Joined: 2/5/2006
Posts: 1,148
|
QUOTE (DSBlake) I agree with the H&S pattern.. Other things to note besides the falling volume on this rally. SPY came off a double bottom in early september (even gapped) then punched thru the 50da MA and the current divergence
from that average is warning #1, second a continuous falling of OBV, third the market is Overbought on many fronts... BUT.. the real test in my mind is the support at the neckline of the double bottom (113). This has to be in my trading experience THE TEST.. given the current Bullishness of the markets (here and abroad) I would likely use SPY 113 to determine my next move.. if we cut thru it like butter I would be short the market if we hold and start accumulation there I would be all over the Bull side.. This would be a big confirmation for the upside to me... Dean
+1
ben and apsll are always bullish.
|
|
Registered User
Joined: 7/1/2008
Posts: 889
|
I'm bullish in bull markets.
|
|
Registered User
Joined: 8/3/2010
Posts: 9
|
SPY
1 year daily chart
30 DMA above 200 DMA,
50 DMA moving towards 200 DMA,
price above prior two short term tops
Seems bullish to me
|
|
Registered User
Joined: 2/5/2006
Posts: 1,148
|
i'm looking for next months swing trade not last months. whether the next swing is simply corrective or something more severe remains to be scene.
whether its bull market or bear market depends on what time frame you look at. we've see how fast things can change, especially when these rallys are simply a result of the fed cheapening the dollar.
|
|
Registered User
Joined: 7/1/2008
Posts: 889
|
well, i think the next major data point is Nov 2nd. Republicans take both houses, and we ignite a bigger rally. The next data point after that is what happens with tax rates. Anything short of extending the current rate structure will cause at least a short term correction.
Since our Congress and White House are seemingly doing anything they can to inhibit business & growth, to have a republican takover in Congress would be like a management shake up at a company with incompetent management. It would be a bullish turnaround story...
IMHO.
|
|
Registered User
Joined: 7/1/2008
Posts: 889
|
I left off the other big data point - what the Fed does with QE in Nov.
3 big data points. I'd say the market is starting to expect somewhat positive outcomes on all 3 points.
The big risk would be a failure of any or all of these expected outcomes.
|
|
Registered User
Joined: 9/25/2007
Posts: 1,506
|
QUOTE (ben2k9) The next data point after that is what happens with tax rates
As it stands now ... a person's who makes enough to be wealthy according to Obama's criteria ... will pay 7.5% lower federal income taxes ... if they sell ... and nail down their gains in 2010 ...
And given that the estate tax exemption is unlimited this year ... I suspect that quite a few high net worth individuals ... will be assessing just what the rest of their life is worth ... if Congress adjourns with no action ...

|
|
Registered User
Joined: 7/1/2008
Posts: 889
|
QUOTE (funnymony) i'm looking for next months swing trade not last months. whether the next swing is simply corrective or something more severe remains to be scene.
whether its bull market or bear market depends on what time frame you look at. we've see how fast things can change, especially when these rallys are simply a result of the fed cheapening the dollar.
meanwhile this thing keeps melting up. I think an 18 month bull market gaining 70% qualifies as a bull, market, no matter how you slice it. The H&S top breakdown failed, which was bullish. The inverted H&S base breakout succeeded. Volume and breadth has expanded lately. Broading our global palette, there are several countries at all-time highs. Leading stocks are at all-time highs. Now all risk markets are breaking out (ie: all commodities).
What other evidence are you waiting for?
|
|
Registered User
Joined: 3/16/2006
Posts: 2,214
|
|
|
Registered User
Joined: 2/5/2006
Posts: 1,148
|
QUOTE (ben2k9) QUOTE (funnymony) i'm looking for next months swing trade not last months. whether the next swing is simply corrective or something more severe remains to be scene.
whether its bull market or bear market depends on what time frame you look at. we've see how fast things can change, especially when these rallys are simply a result of the fed cheapening the dollar.
meanwhile this thing keeps melting up. I think an 18 month bull market gaining 70% qualifies as a bull, market, no matter how you slice it. The H&S top breakdown failed, which was bullish. The inverted H&S base breakout succeeded. Volume and breadth has expanded lately. Broading our global palette, there are several countries at all-time highs. Leading stocks are at all-time highs. Now all risk markets are breaking out (ie: all commodities).
What other evidence are you waiting for?
i recall having a similiar conversation last april, and what happened then? this is not a time for new longs. the market is very overbought. the next swing will be to the downside, whether its simply corrective or deeper remaiins to be seen. and as i said i'm looking for my next trade not last months.
|
|
Registered User
Joined: 2/5/2006
Posts: 1,148
|
woohoo! another meltup today. lol.
shorty mcshort gettin warmed up.
|
|
Registered User
Joined: 7/1/2008
Posts: 889
|
QUOTE (funnymony)
woohoo! another meltup today. lol.
shorty mcshort gettin warmed up.
http://www.sadtrombone.com/
|
|
Registered User
Joined: 2/5/2006
Posts: 1,148
|
another meltup. gettin interesting.

|
|
|
Guest-1 |