| Welcome Guest, please sign in to participate in a discussion. | Search | Active Topics | |
Registered User
Joined: 8/13/2005
Posts: 3
|
My first post so do not expect anything great. Any thoughts would be appreciated. (As long as you are gentle.)
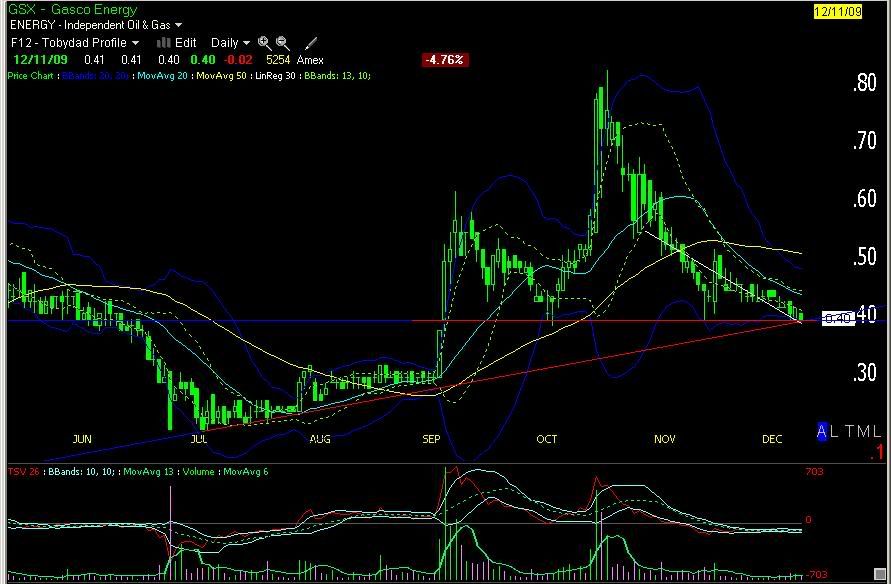
GSX - Tobydad Crowbar trade:
Is GSX a 'Tobydad Crowbar' or is it to late?
If it is still a 'Tobydad Crowbar' trade, would the $0.60 resistance level be to close - to strong - for even a short swing trade?
GSX - Longer-term Trade - WEEKLY
Any good ideas on how to play the longer-term weekly pattern?
I was also noticing the Double Bottom, or even Reverse Head & Shoulders, pattern on the GSX weekly chart.
GSX seems to have strong support at the $0.40 level with the 200SMA at approx. the same level.
Of course there is still that pesky strong resistance at $0.60. For the longer-term trade would it be best to wait until it moves above $0.60 or maybe by now with a STOP just under $0.40. Or, maybe buy part now and more when it breaks $0.60?? (or if it, but then again, maybe if it - Why is this bozo trying to trade stocks???)
I guess all I need you to tell me for the weekly pattern trade is:
Will it be the coldest winter on record?? (Whoops, forgot about that nasty GLOBAL WARMING thing!!)
Will Natural Gas hit $10.00 in January 2010??
I been reading all of your posts for a long time, and with so MANY intelligent, resourceful, expert traders on this forum, I'm SURE many of you have the answers to my questions. (Did I kiss up enough?)
No pressure - I just need absolutely correct answers, which I know are so easy to come by with technical analysis.
Thank you much for your time, 3crows
|
|
Registered User
Joined: 2/13/2005
Posts: 368
|
GSX - No workie IMHO
back up the GSX chart to 12/14/09. That is more representative of a stock at the LBB and sitting on the LR30 with a strong candlestick.
|
|
Registered User
Joined: 8/31/2009
Posts: 60
|
Support & Resistance do play a prominent role. Around the 11th you could see the Support lines meeting. This would have been a added confirmation for Tobydad's Profile Setup.
|
|

Registered User
Joined: 10/7/2004
Posts: 2,181
|
I think GSX works as a trade but it is not a good example of the Crowbar. The original use of the Crowbar terminology had to do with watching candles getting pried out of the mud--as in "bottom fishing". So, thekubiaks has called--p this correctly as 12/14 would have been the perfect trigger signal.
that said, it has some of the markings of one of David's Dragon patterns; it's just sort of a mini-dragon up close (but if you look at a 1-year chart, it looks like a rather long-snouted dragon).
As to the trade itself, one of my rules of thumb is "Price above LR30=Good" (or, at least, much safer than price below LR30). You could enter at 0.60 or begin entering buy orders above HOD. (for swing traders--pick your timeframe if you're intraday).
0.48 would be my stop loss if I was in this trade. This would be a classic example of a 1-2-3 stop.
|
|
Registered User
Joined: 8/13/2005
Posts: 3
|
tobydad, thekubiaks & rysa,
Thank you for your input on GSX, it is a big help in understanding the use of the "Tobydad Profile" (Tobydad Crowbar.) Of course, explanation from the originator never hurts.
Now maybe if I could cause trouble just one more time?
What about ENG? Does it fit the "Tobydad Profile?"
ENG closed above BB13, LR30 and numerous past highs. TSV26 moved above 0. Moving up from a short (squat) double bottom.
Problems would be the 50 SMA and the descending trendline? Also, the move occured on Thursday, a half day of trading.
Earnings were reported on Nov 3, 2009 and ENG's price held in there fairly tight.
Thanks again, 3crows
|
|
|
Guest-1 |