| rysa |
|
Gold User, Member, TeleChart
|
| Registered User |
|
|
|
|
| Gender: |
|
| Monday, August 31, 2009 |
| Saturday, July 3, 2010 3:16:24 PM |
60
[0.02% of all post / 0.01 posts per day] |
|
I had sent in my MTM application request along with my Tax Returns this April.
I haven't received any communications whether the application was approved or not.
Should I assume, my application has been approved or Is there a number we can talk to to get the status ?
|
|
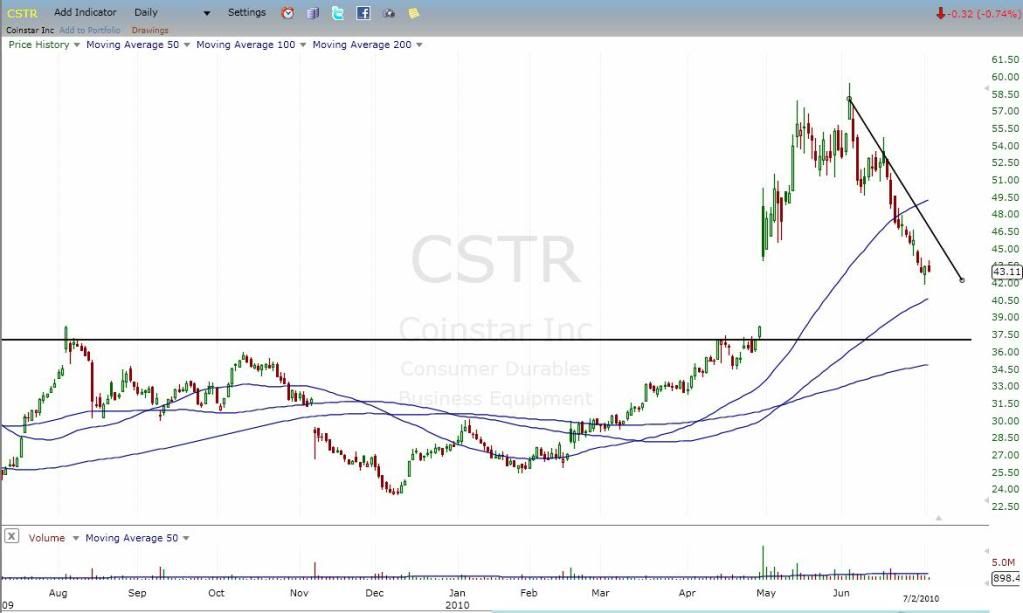
CSTR rose to new highs in the last couple of months. It is trying to close the gap created earlier.
I am in @ 43.5. Close position around 38.
www.freestockcharts.com
|
|
Closeup...
|
|
Previous chart was a weekly chart. Here is the Daily Chart -
 OVERVIEW.... OVERVIEW....
|
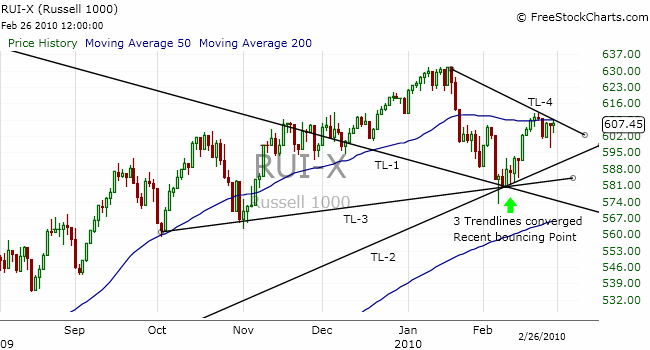
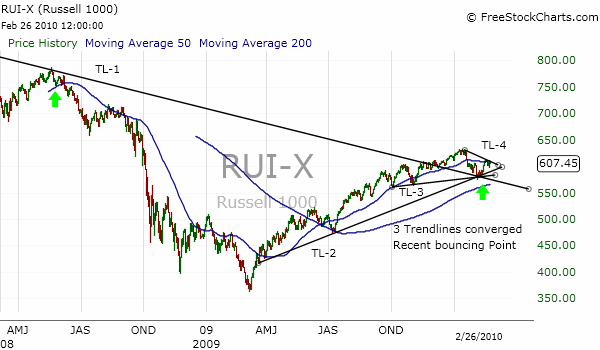
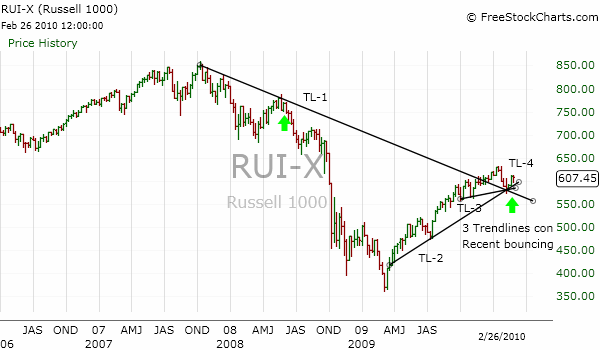
Russell 1000 looks ready to change course. I am playing the BGZ (RUI-X's Triple leveraged ETF) - In @ 16.75 (last Friday).
TL-1 : Trend line - Oct 07 - May 08 - (Weekly Chart)
TL-2 : Trend line - Mar 09 - Jul 09 - (Daily Chart)
TL -3 : Trend line - Low Pts - Oct 09 - Nov 09 - (Daily Chart)
TL-4: Trend line - Recent Highs - Jan 10 - Feb 10
SMA-50 has turned out to be a resistance and RUI-X seems not to be able to penetrate. Expectation is - It could hit TL-1 again and bounce back. Get out if it closes above the TL-4 - STOP-LOSS.
Would like to hear everyone's comments...
|
If you want to trade Stocks less than a Dollar and want to buy large lots - say 10,000 +, You get hit with huge commission with most brokers....
10,000 Shares : Fidelity, Schwab, Zecco... : $0.015 / Share : $150 (approx)
10,000 Shares : Scot Trade, IB : .5 % / Share : $ 50 (approx)
Any broker suggestions for Large Lot traders...
|
Here is the Weekly Chart of DJ-30. DJ-30 has broken the long term trend line. Not with increase in Volume though...
We can expect a bounce for tomorrow from this point.
But, Is this the signal of the beginning of a Major Correction ???
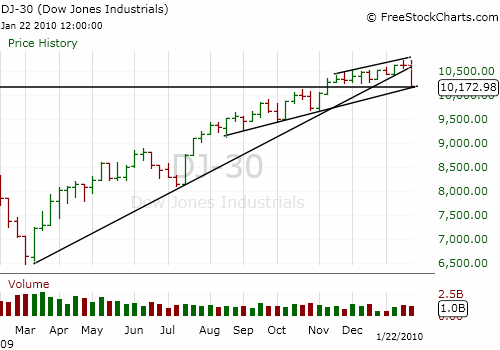
On a Side Note - Save Image feature in FreeStockCharts does not allow you to chage color of TREND LINES. Any one know of a workaround...
|
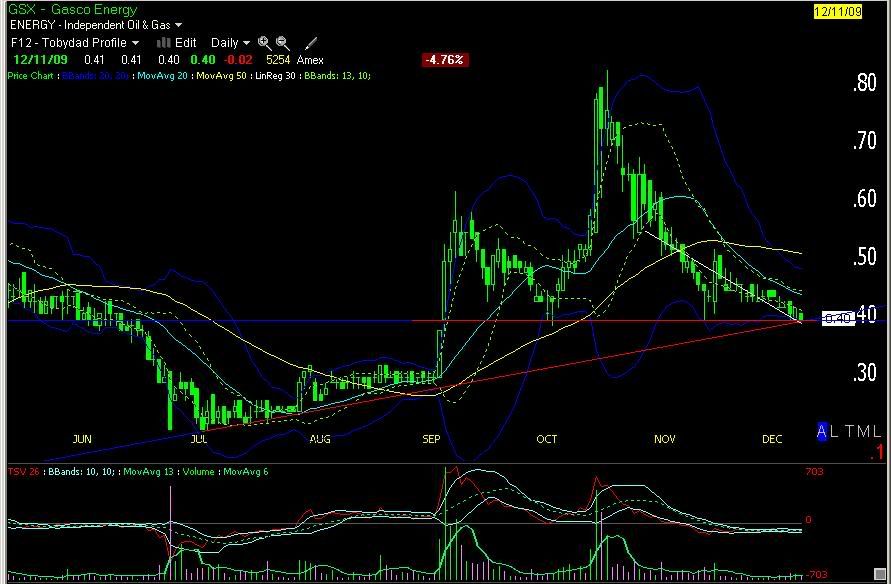
Support & Resistance do play a prominent role. Around the 11th you could see the Support lines meeting. This would have been a added confirmation for Tobydad's Profile Setup.
|
QUOTE (jz94117) Oops. I figured it out. "lower bollinger band". But what width for the band are you using?God bless,Jim in SF.
Bollinger Bands 20,.20
Check out the following Post for more details:
http://forums.worden.com/Default.aspx?g=posts&t=30752
|
|