| Welcome Guest, please sign in to participate in a discussion. | Search | Active Topics | |
Registered User
Joined: 3/16/2006
Posts: 2,214
|
|
|

Registered User
Joined: 10/7/2004
Posts: 2,181
|
Nice Sig. Good stuff. Thanks.
|
|
Registered User
Joined: 3/14/2005
Posts: 25
|
signal; it would be nice if you posted the formula, i can't seem to read it! thank you
|
|
Registered User
Joined: 12/31/2005
Posts: 2,499
|
Could make out (2.95* so did a search and these might be canidates:
L < ((2.95 * MINL15.7) - MAXH7.3) / 2 AND STOC50.3 < 10 AND L < L1
and:
H > ((3.05 * MAXH15.7) - MINL7.3) / 2 AND H > H1 AND STOC50.3 > 50 AND TSV3 < TSV8
|
|
Registered User
Joined: 1/18/2008
Posts: 209
|
Hi,
How you get the colored candles in telechart. Ithought that was Blocks specific??
Thnx
Sharp
|
|

Administration
Joined: 9/30/2004
Posts: 9,187
|
QUOTE (sharppolly) Hi,
How you get the colored candles in telechart. Ithought that was Blocks specific??
Thnx
Sharp
There is an option on the Balance of Power (BOP) indicator to paint the price chart the same colors as the BOP plot. It looks like he has this option selected and the BOP plot set to not visible.
|
|
Registered User
Joined: 1/18/2008
Posts: 209
|
Hi Stock Guy,
Ahh I see.
Thnx
Sharp
|
|
Registered User
Joined: 3/16/2006
Posts: 2,214
|
|
|
Registered User
Joined: 3/16/2006
Posts: 2,214
|
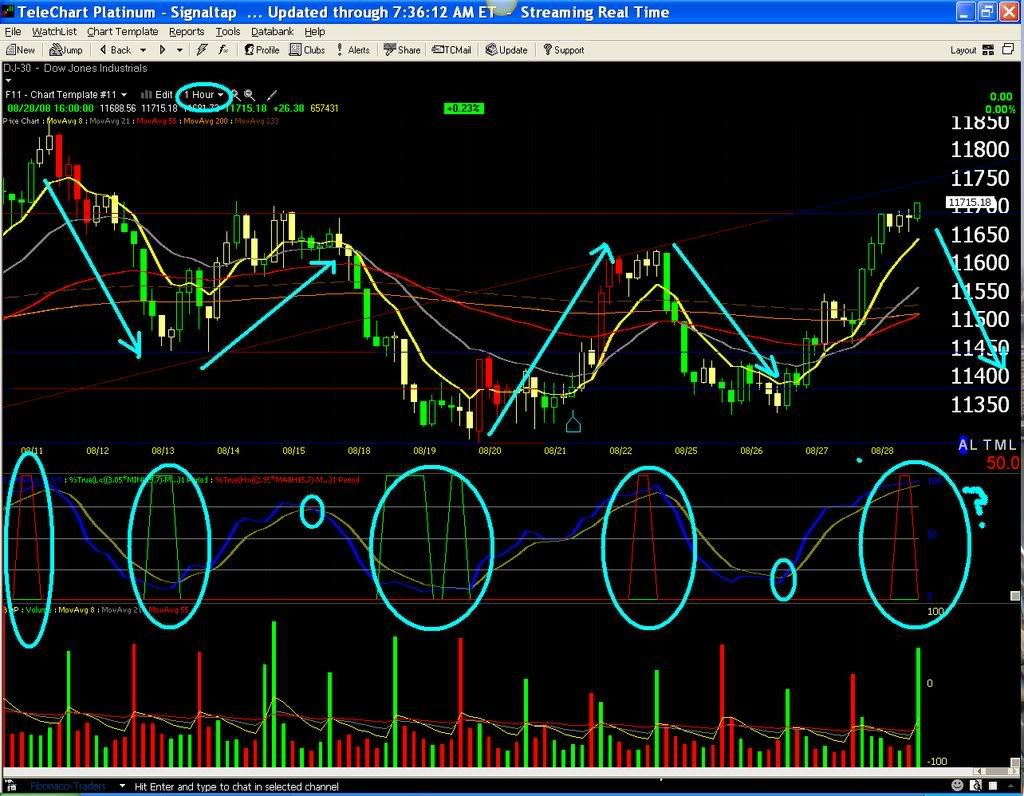
green spike oversold and ready to pop:
L<((3.05*MINL15.7)-MAXH7.3)/2 AND STOC12.5<10 AND L<L1
red spike overbought and read to comedown:
H>((2.95*MAXH15.7)-MINL7.3)/2 AND H>H1 AND STOC12.5>90 AND TSV3<TSV8
if you read Don Worden's Jan4th 2008 nightly report, you can see that the original formulas from Sir Oversold's ( the green one, I use 3.05 and I use stoch's 12.5 instead of 50.3) and Sir Rocket Scientist (the red one, I use 2.95 and use 12.5 stoch's and above 90 instead 50.3 ,above 50) have been changed slightly, I feel that these settings are DEAD ON, Signaltap
|
|
Registered User
Joined: 3/16/2006
Posts: 2,214
|
just a perfect top! over 500 points ago! and making money
|
|
Registered User
Joined: 2/14/2006
Posts: 8
|
great stuff, sig
|
|
Registered User
Joined: 3/16/2006
Posts: 2,214
|
try to paste (into boolean formula area and test the formula, it should work) both formulas, then click "chart template " then % true, have smooth avg = 1, and exponential and visible.
thanks for your time, Sig
|
|
Registered User
Joined: 3/16/2006
Posts: 2,214
|
I meant each formula separate. 
|
|
Registered User
Joined: 2/19/2008
Posts: 193
|
I get the red spike but not the green. Can someone help?
|
|
Registered User
Joined: 2/19/2008
Posts: 193
|
Nevermind, I see it. There hasn't been a green spike on a daily chart since March,
|
|
Registered User
Joined: 1/28/2005
Posts: 6,049
|
Red=Overbought. (may be time to sell)
Green=Oversold (may be time to buy)
Notice in the chart above Red at tops, Green at bottoms.
Like anything else its an indicator not a guarantee.
You should confirm decisions with your normal analysis.
Thanks
diceman
|
|
Registered User
Joined: 9/25/2007
Posts: 1,506
|
QUOTE (sailnadream) Nevermind, I see it. There hasn't been a green spike on a daily chart since March,
Yeah ....
But that was a good one ....

|
|
Registered User
Joined: 3/16/2006
Posts: 2,214
|
QUOTE (signaltap) green spike oversold and ready to pop:
L<((3.05*MINL15.7)-MAXH7.3)/2 AND STOC12.5<10 AND L<L1
red spike overbought and read to comedown:
H>((2.95*MAXH15.7)-MINL7.3)/2 AND H>H1 AND STOC12.5>90 AND TSV3<TSV8
if you read Don Worden's Jan4th 2008 nightly report, you can see that the original formulas from Sir Oversold's ( the green one, I use 3.05 and I use stoch's 12.5 instead of 50.3) and Sir Rocket Scientist (the red one, I use 2.95 and use 12.5 stoch's and above 90 instead 50.3 ,above 50) have been changed slightly, I feel that these settings are DEAD ON, Signaltap
How to apply these two % true Custom PCF indicator into the charts itself as a visual, not just a scan sort? http://i196.photobucket.com/albums/aa104/signaltap2/greenspike_zps9826d251.png?t=1366450880
|
|
Registered User
Joined: 3/16/2006
Posts: 2,214
|

|
|
|
Guest-1 |