Registered User
Joined: 3/11/2005
Posts: 8
|
Could some kind soul translate the text of Sir Free Market Thinker's system into the actual settings?
1) I scan the Russell 1000 using a 30 day linear regression line for all stocks in a sharp downtrend.
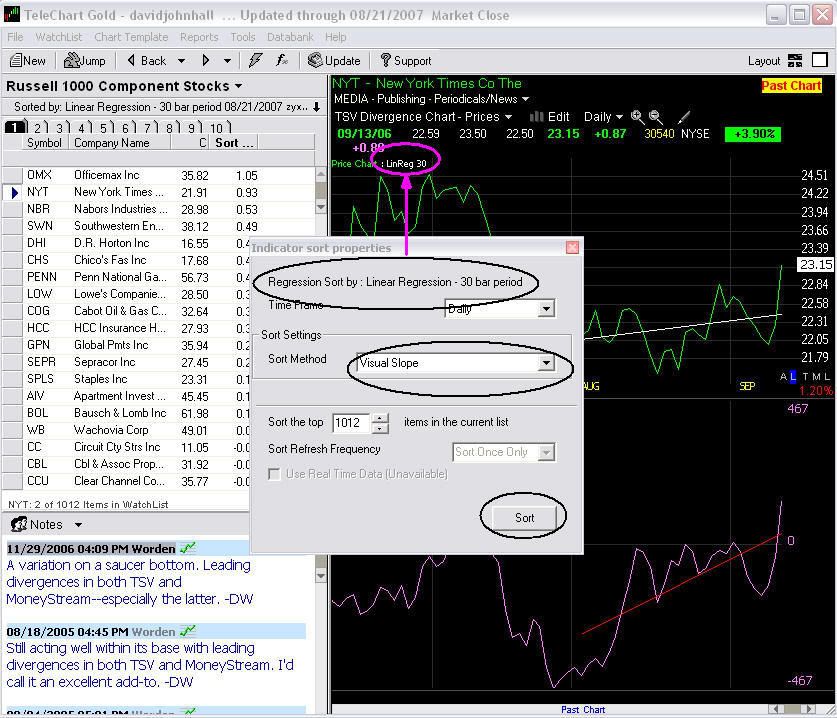
2) sort them using a 30 day linear regression of TSV
3) flag the stocks with the greatest upsloping TSV regression lines
Thank you.
|
|
Registered User
Joined: 1/28/2005
Posts: 6,049
|
See this video for linear regression
sorts:
Using Linear Regression Sorts to Help Spot Divergences
Thanks
diceman
|
|

Registered User
Joined: 6/6/2005
Posts: 1,157
|
Hello Zen,
I've put together a little visual demo to help explain. First, I must explain what a bullish divergence is for anyone who may not know...
Most of the time the TSV indicator confirms price action like this...

But once in awhile you will see a bullish divergence between TSV and price like this...
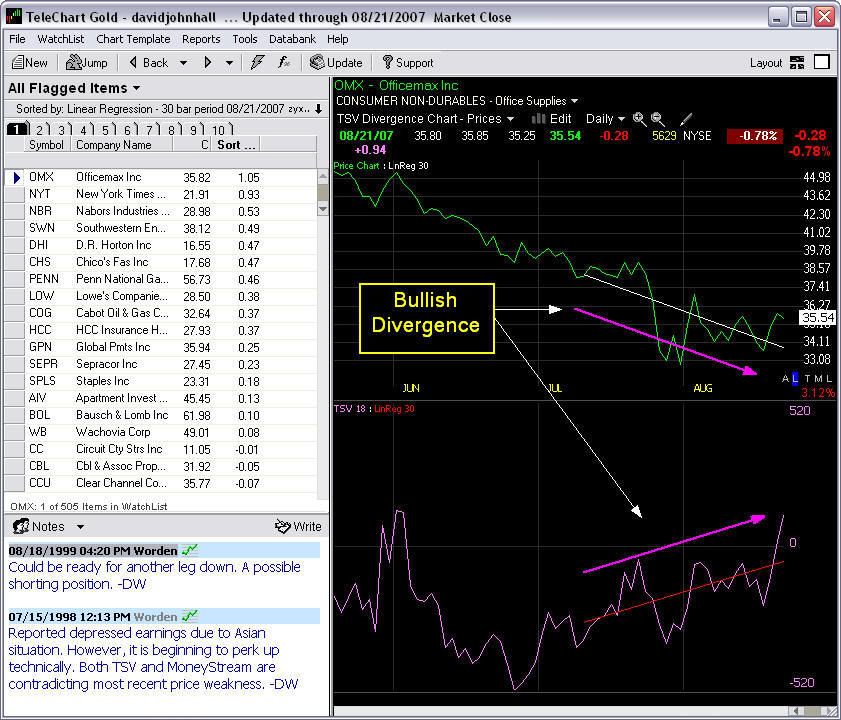
With price falling and TSV rising it signals what might be accumulation at a significant bottom.
To find these at potential market bottoms, I wait for the t2108 indicator to approach the levels of prior reversals, like this...

When it is, I scan for bullish divergences in TSV.
To find them I begin by loading the Russell 1000 (my watchlist of choice) and sort price by a 30 day linear regression line, like this... (you can use a shorter or longer term regression - this one simply works best for me).
From here I flag all stocks with values of negative (-2.0) down...

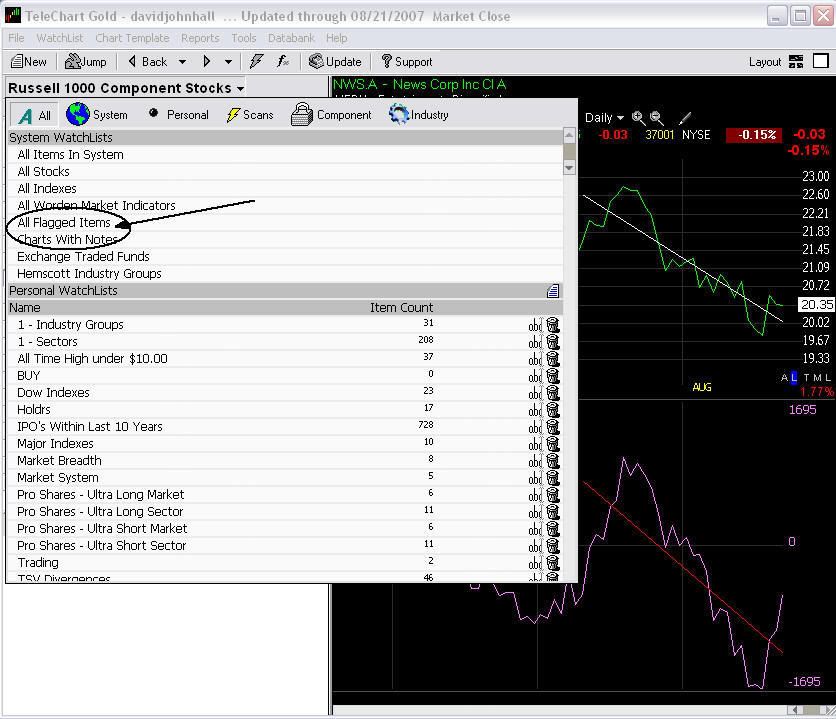
Afetr I have done this I open up the "All Flagged items watchlist...
Once I have this watchlist loaded I unflag all items and I sort them again -- this time by the TSV visual slope value...

Now I flag all of the stocks with a value greater than zero, and save them as a personal watchlist.
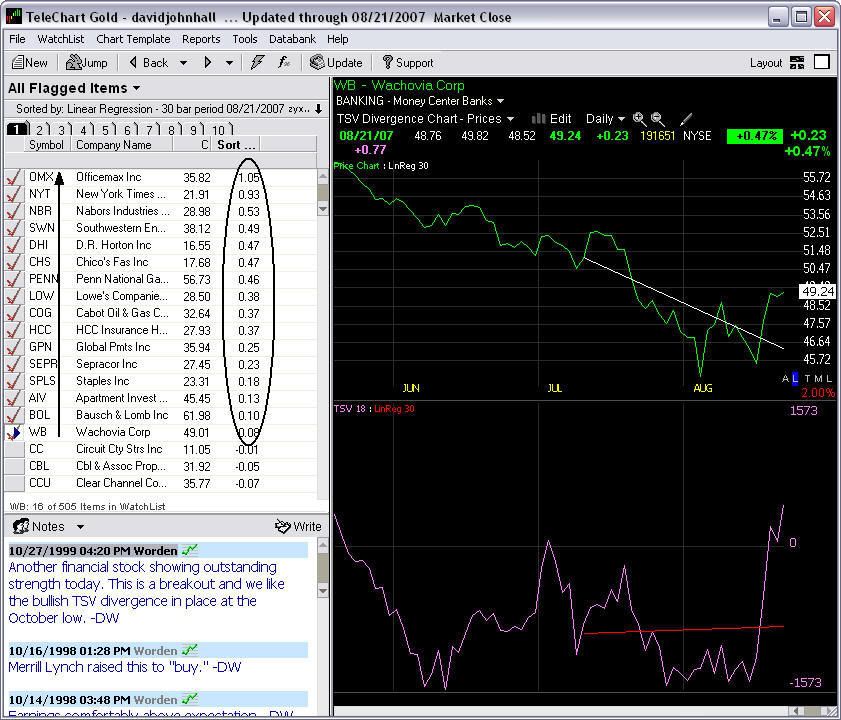
Now I have several stocks that have the divergences I'm looking for.
Would they all just be blind buys at this point? No. I never buy from one signal. I always look for confirmation. Like this...
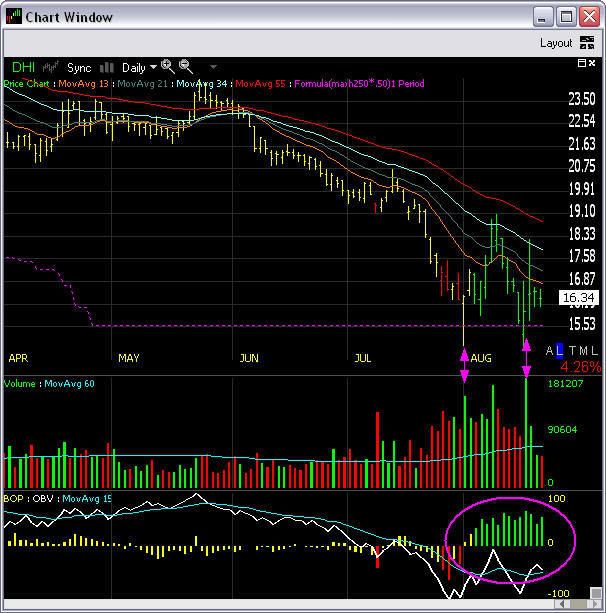
Here we have BOP confirmation and some strong up volume days at the lows. I might be looking at this stock.
Another way I wait for confirmation is to buy once price has broken channel roofs. AMD presented 2 opportunities in 06. One when it broken the 5 day channel for a more agrressive entry and one when it broke the 20 day.

How did the divergence look on AMD before the reversal. Pretty good.

Once the move is underway, I look for TSV confirmation like this...

Well, that's about it. I don't think I have left anything out. If I have, please feel free to ask.
Good luck.
David
|
|
Registered User
Joined: 12/21/2004
Posts: 902
|
Hey Congratulations on your knighthood, David! And thank you for taking the time to share your system with us in such detail - very informative and educational - and very generous of you.
And, if I may add, I'm obnoxiously infatuated with MACD-H (I think it's good to take one indicator or pattern or setup at a time and just really live and breathe it until I've figured everything I can about it from every direction, but I digress). When I look at the DHI chart that you posted for confirmation, the first thing that I thought of was "I bet there's a MACD-H divergence there" - and sure enough there's a nice one there. That would be my confirmation.
|
|
Registered User
Joined: 6/6/2005
Posts: 1,157
|
Thanks, hohandy! I agree with you -- it wasn't until I decided to focus on the one pattern I liked best that I begin being profitable. I read somewhere that it pays to specialize, just like it does in an field, and that traders should do the same. I have since added one more pattern to the ones I trade, but find reversals and divergences the most compelling.
Thanks again for the kind words.
|
|
Registered User
Joined: 1/28/2005
Posts: 6,049
|
Very nice. davidjohnhall.
Is there anything special that led you to:
MAXH250*.5 ?
or is it just in the catagory of "half a range".
Thanks
diceman
|
|
Registered User
Joined: 9/21/2005
Posts: 566
|
David, great job. I am wondering what formula you use for the five day and 20 day channel that were broken? Can you provide them?
Thanks.
|
|
Registered User
Joined: 6/6/2005
Posts: 1,157
|
Hi diceman,
Thanks! I came across the 250*.50 line based on two things. The first was the writings of the ever eccentric W.D. Gann who believed the 50% retracement from a stocks high to be a very powerful point in a stocks life. He believed that when a stock trades lower than 50% of it's all time high it's best to leave it alone until it trades back.
I, myself, trading on a shorter timescale than GANN wondered if there were a correlation between the 250 day high and stocks that traded above or below that point.
At first I used that line as an indication of which stocks to stay in or out of -- at first looking at only stocks that traded above the line. There were way too many of them. Then I began to get a feeling that I might want to be looking at the place where only a few stocks go -- the 50% retrace and beyond.
I believed that if they traded that low in a year or less they might get traveling fast enough to create a panic driven sell climax.
I was also looking for a price level that would, for the most part, remain the same. Of course these were only thoughts until I applied them to a backtest and discovered that picking stocks below this line helped my trading system performance immensly.
What I noticed was that stocks only trade below this line once every few years. When they approach the line one of 2 things happens -- they either bounce off it and reverse up -- or crash right through and reverse much lower. Once they do they almost always revert to the mean.
The second part of the idea came while reading Market Wizards when a fund manager mentioned that he wouldn't even look at stocks unless they were 50% off their highs for the year -- then he'd buy them no matter what they were. that seemed like a bold statement to me and the reason why i trade stocks in the Rus 1000 - institutional sponsorship and more stocks to chose from than the s&p 500.
I keep a watchlist dedicated to stocks below this line -- and i can always tell when the bottom is near because the watchlist fills up. During trending markets I'll be lucky to get 1 or 2 stocks in there and they don't trade as well as when there are 14 like there are now.
|
|
Registered User
Joined: 6/6/2005
Posts: 1,157
|
hey jcfla7,
I use channels based on closing prices. From the Turtle traders I got the idea to use a max c 20 day channel for the roof and a min close 10 day channel for the floor.
For an aggressive entry (on stocks that are below the 250*.50 mark only) I use the max close 5 day channel. I plot these as custom indicators in the middle window because that works best for me and makes it functional.
The custom indicators are:
20 Day roof
maxc20
10 day floor
minc10
5 day aggressive entry
maxc5
Price
c
You will want also want to check the "plot using price scale" tab.
I also think I forgot to mention that with reversal trades I use a larger stop-loss of 12% due to the nature of reversals. I adjust for the larger stop-loss levels by trading fewer shares.
Good luck.
David
|
|
Registered User
Joined: 1/28/2005
Posts: 6,049
|
Thanks for the info.
I seem to remember some analysis by
Thomas Bulkowski. That stocks were a
better buy in the bottom third of their
annual range.
Thanks
diceman
|
|
Registered User
Joined: 3/11/2005
Posts: 8
|
David:
I think you were short-changed: Knighthood wasn't good enough.
The Worden's ought to ordain you an Investing Wizard!!!!
Fantastic job of explaining what was way beyond this investing peasant's ability to decipher on his own.
Thank you very much.
|
|

Registered User
Joined: 10/7/2004
Posts: 319
|
Terrific presentation David.
How are you able to draw the arrows, circles and eclipses on your chart? Or is this part of that TCC product you mentioned?
Thx,
Survivor
|
|
Registered User
Joined: 6/6/2005
Posts: 1,157
|
Thank you, Zenprofit -- it's great to get such positive feedback! I'm happy to share and have learned so much since becoming a member myself. Don't worry, you'll be getting your own bottle of bubbly some day!
|
|
Registered User
Joined: 6/6/2005
Posts: 1,157
|
Thanks Survivor,
The arrows come from my screen capture software "Hyper Snap" and can be found at www.hyperionics.com. It lets me capture a portion of my screen or the entire active window. Once I've done that I can draw arrows, boxes, ellipses, lines and then save as a jpeg file.
|
|
Registered User
Joined: 10/7/2004
Posts: 319
|
Thx David.
|
|
Registered User
Joined: 3/11/2005
Posts: 8
|
David:
Your screen shots were perfect for helping me set up the Free Thinker Knight-worthy system.
Could you (or some other reader) post the complete Middle Screen setup mentioned in your reply to jcfla7?
I cannot get the Roof and Floor Channels to match the screen shot you provided.
Thanks again.
|
|
Registered User
Joined: 9/13/2006
Posts: 143
|
David:
I truly acknoledge you for taking time and sharing all this. Thank you.Moe
|
|
Registered User
Joined: 1/28/2005
Posts: 6,049
|
zenprofit
When you plot the 3 custom indicators:
-----------------------------------------
MAXC20 (green)
MINC10 (red)
MAXC5 (dotted line)
----------------------------------
make sure you select:
Plot using price scale.
(otherwise they will just fill the window)
Thanks
diceman
|
|
Registered User
Joined: 1/28/2005
Posts: 6,049
|
zenprofit
Just incase its not clear. You will also
need:
C
(the close as a custom indicator( white))
When you plot the 3 custom indicators:
-----------------------------------------
MAXC20 (green)
MINC10 (red)
MAXC5 (dotted line)
make sure you select:
Plot using price scale.
(on all four indicators)
Thanks
diceman
|
|
Registered User
Joined: 3/11/2005
Posts: 8
|
diceman:
Got it!!! Perfect match to screen shot.
Now for the Bonus Question. What did David mean by this:
QUOTE
Another way I wait for confirmation is to buy once price has broken channel roofs. AMD presented 2 opportunities in 06. One when it broke the 5 day channel for a more agressive entry and one when it broke the 20 day.
The circled line convergences in the screen shot show the white Close Price line touching the dotted MaxC5 line and the Green MaxC20 line. Does touch = broken channel roof?
I never knew Telechart could plot these sophisticated processes.
This forum is great.
Thank you for your help.
|
|
Registered User
Joined: 9/22/2005
Posts: 849
|
David
I believe that this is the first time that anyone has given this much detail when posting the methodology of their search for candidates.
I wish others would do the same.
|
|
Registered User
Joined: 3/11/2005
Posts: 8
|
bcraig73450:
My Mother taught me a long time ago:
"If you don't ask, you don't get."
I am grateful for David's sharing. To be honest, I never expected a brand-new Knight to even be reading this Forum.
Perhaps the Worden's ought to double the bubbly offer if the new Knight agrees to host a Forum about their winning strategy for a week.
I've learned more from David than from any other Knight whose strategy I tried to copy after many years as a Worden subscriber.
|
|
Registered User
Joined: 1/28/2005
Posts: 6,049
|
"Now for the Bonus Question. What did David mean by this:
QUOTE
Another way I wait for confirmation is to buy once price has broken channel roofs. AMD presented 2 opportunities in 06. One when it broke the 5 day channel for a more agressive entry and one when it broke the 20 day.
The circled line convergences in the screen shot show the white Close Price line touching the dotted MaxC5 line and the Green MaxC20 line. Does touch = broken channel roof?"
-------------------------------------------------------------------
zenprofit
Because the green line is the "max close". The close can never break it. If the close goes up
through it. The green line will move with it.
So a breakout will be when the green line
moves up.
(the close can only equal the max close or
be below it)
Does that make sense?
Thanks
diceman
|
|
Registered User
Joined: 6/6/2005
Posts: 1,157
|
Thanks zen and bcraig, I truly appreciate all of the positive comments surrounding the post and the report. It's my firm belief that when it comes to trading we should all be helping each other. Most of the time the guys on the other end of the trade are the institutions and learning to trade with them will make all of us more profitable.
Regarding the circle around price in the channel -- just as diceman pointed out -- they are breaks of the high through the channel. If you can't watch the screen all day you can lock in you buy before you leave for work by placing a "buy stop" order a few cents above the roof.
Another thing to consider is a profit target. After the stock raises 5% or more I would consider trailing a stop loss to lock in those initial gains. Sometimes you will be stopped out while the stock continues higher, but man times you'll be out with real profits as price reverses.
Another thing to consider is the "rebuy". If the stock climbs and then consolidates, another break of the roof might be cause for another buy. The choice is yours.
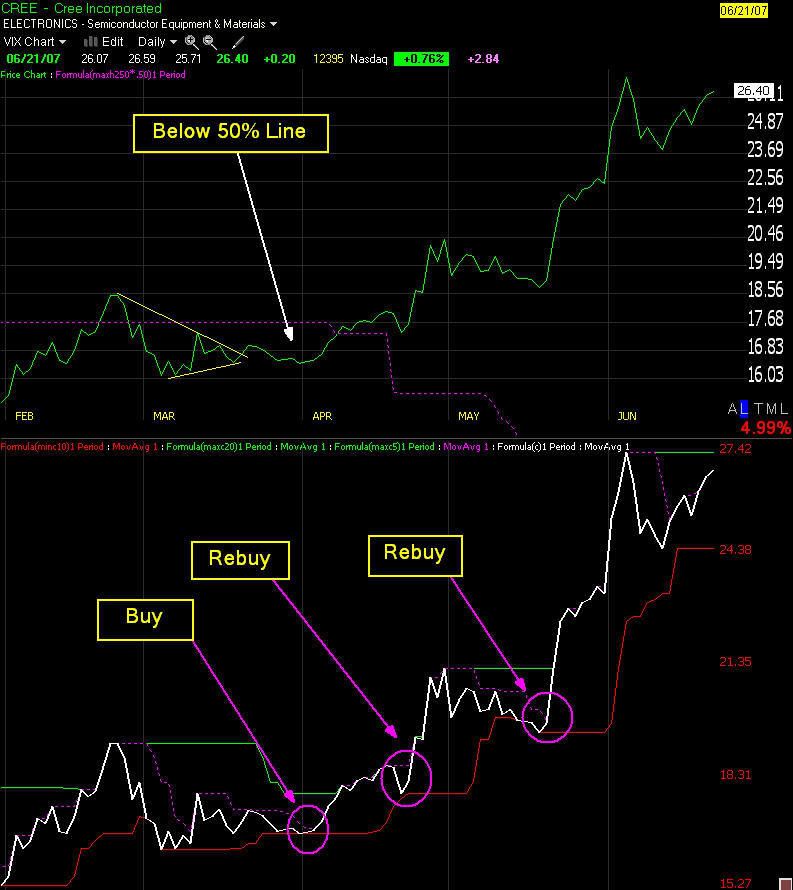
Here's CREE earlier this year. After a failed break of the 50% line a couple months earlier (which would have been a successful trade had you used a the 5 day roof aggressive entry) CREE set up again in late march. After its initial run up it consolidated and once again penetrated the 5 day roof. Depending on how much you like the stock it would be a good rebuy point.
The second rebuy is a little more tricky. If you use the 10 day floor as an exit you would be out. But it doesn't mean you can't rebuy when it breaks the 5 day roof again. in this case you would have been a happy trader indeed. The first run would have gotten you just over 10% -- the first rebuy would have gotten you another 7% and the final rebuy would have gotten you 50% Not bad!
Of course, it's always easy to say what you would have gotten, and would have done, and with system trading it's important to take slippage and commission cots into consideration as well.
Oh, by the way -- did anyone see how our watchlist performed?

Only 2 down. Not bad. But remember -- this is the market -- anything can be happen and NONE of these are buy recommendations. As one of my favorite traders Dave Landry is fond of saying...if you've been trading for more than a day...you know that you can lose money!
Good luck everyone. Keep the ideas flowing.
|
|
Registered User
Joined: 6/6/2005
Posts: 1,157
|
I'm not sure what happened to the CREE example, but here it is:
|
|

Registered User
Joined: 3/21/2006
Posts: 4,308
|
David, let me first say that coming back from my vacation and finding your Great contributions is a breath of fresh air.
I have sometimes wondered why the Knights of the Round Table, while sipping their Venve Clicquot Ponsardin have not visited this forum to share with us not their libation but their pearls of wisdom.
I have enjoyed and implemented your system into my Templates. My first duty was to create a new easy scan with all stocks, a filter for volume of course, and the PCF max250*.5 - I netted 1,238 charts. I then used your method of sorting by linear regression on both price and TSV (Visual slope). Next I removed all TSV candidates with a slope less then 000.
I was left after all this process of elimination with 32 great charts to analyze. The cream that rose to the very top is the chart for CNS. The maxh20, the maxh5 and price all seem to be converging at the same time. BOP is also showing some strength. I will leave everyone with the following chart to see what I was looking at. Again it is nice to have someone with your experience and knowledge that is willing to share.
Apsll.

|
|
Registered User
Joined: 3/11/2005
Posts: 8
|
diceman and david:
Now I've got it.
Here is my humble bubbly reward: 
Thank you both.
zenprofit
|
|
Registered User
Joined: 3/21/2006
Posts: 4,308
|
PS: I forgot to mention that as a condition (in my easy scan) for the PCF maxh250*.5 - I used condition type List Rank 76-99
Again thank you David, You are truly a worthy Knight.
|
|
Registered User
Joined: 6/6/2005
Posts: 1,157
|
That's a great looking chart, Apsll -- and an interesting idea about the meeting of the 5 and 20 day ceilings. It really is fantastic to know that the scan and the post have been appreciated as I have learned so much from this board and Telechart.
And cheers to you, zen -- that six pack should keep me busy for awhile!
|
|
Registered User
Joined: 1/1/2005
Posts: 2,645
|
One of David's charts will be used to illustrate the ambiguities which can be obtained by using TSV Simple.
Please set up a template exactly as David's second chart (that of OMX). Now change TSV18 Simple to TSV87 Simple. Observe that the "Bullish Divergence" is no longer present.
The ambiguity observed is a property of simple moving averages and does not indicate anything detrimental about TSV.
Thanks,
Jim Murphy
|
|
Registered User
Joined: 3/21/2006
Posts: 4,308
|
Bustermu, I have always enjoyed and respect your comments in reference to TSV interpretation. A question for you if I may. A shorter period moving average will give a faster and more up to date read on a given direction then say a longer period moving average will. So when striving to aquire up to date information, would not one want a faster time period on the moving average as apposed to the longer?
Any insights or facts would be appreciated.
|
|
Registered User
Joined: 9/22/2005
Posts: 849
|
Bustermu
Is this phenomenon of moving averages giving different results depending on the length of time covered peculiar to TSV or is it operable with other indicators?
In keeping with apsll’s question, with small differences in the length 0f the moving average it is possible (probable?) that larger differences will result in different stocks fitting the indicator. Then I see no reason to prefer one over the other.
|
|
Registered User
Joined: 12/21/2004
Posts: 902
|
BCraig - it is similar to all indicators I think. One reason why the argument goes for using exp rather than simple when using longer-term indicators and signals. On a simple TSV87 or ma, what happened 86 bars ago has equal weight to what happened yesterday. An extraordinary one-time event will have equal weight in constructing the TSV or ma for the entire length of the time period. Using a longer time period, how realistic should that be - especially if one is doing short-term trading. The exp TSV and ma decreases the weight of each bar the further it gets into the past so it has less influence on the current indicator.
I don't have access to Telechart here at work, but does Bustermu's point (and it is a good observation, actually) still hold true if one applies TSV87 exp?
|
|
Registered User
Joined: 1/28/2005
Posts: 6,049
|
Why would anyone consider it odd that different
smoothing lengths would show different things.
Look at a chart of JNJ.
(or just about any other symbol)
Apply a 10 day and 80 day simple moving
average to price.
Do you see times when they are not in
agreement?
(a counter-trend within a trend)
Thanks
diceman
|
|
Registered User
Joined: 3/21/2006
Posts: 4,308
|
Why would anyone consider it odd that different
smoothing lengths would show different things.
Diceman, I think that most are aware of this already, for me - I was just responding to Bustermu's illustration above. After having time to think more on the reasons for his posting the obvious, I realized that his message was more intended to enlighten the un-aware and that I should not have responed.
I just prefer to expose a divergence by using the shorter term moving average as opposed to missing it entirely by using a longer moving average.
It is also a good idea to use both maybe so one can also see a (a counter-trend within a trend).
Apsll.
|
|
Registered User
Joined: 1/1/2005
Posts: 2,645
|
It is not possible to determine whether there is any accumulation or any distribution (as measured by TSV) from a knowledge of the slope of a linear regression line on any moving average of TSV1. This is not an opinion; it is a fact.
That should be enough to stop anyone from claiming a positive TSV divergence just because TSV18 Simple has increased and Price has not.
Again, TSV is not the cause of the deception, the misuse of moving averages are.
Thanks,
Jim Murphy
|
|
Registered User
Joined: 3/21/2006
Posts: 4,308
|
Jim, not to oppose you, but I have viewed some of the wordens products and they sure talk about divergence between price and TSV as if it were very important. Correct me if I am wrong but did they not invent or create the indicator. Maybe I have miss-interpreted their instructional CD’s.
I have studied raw TSV when last this was an issue on this forum and I believe that the idea of adding a moving average to the indicator is no more difficult to interpret than adding a moving average to any indicator.
I am aware that the moving average is not the actual indicator, but it can be a useful toll if interpreted correctly.
(IMO)
Apsll.
|
|
Registered User
Joined: 3/21/2006
Posts: 4,308
|
Jim, I hope that you will take my response in the spirit that it was intended, Not argumentative . I have been reading your clinical responses involving TSV for quit some time, and You say that you are not bashing the indicator, only the miss-interpretations. On the surface you appear to dispel all notions of using a moving average on TSV1. Is that how you plot the indicator on your templates? I have done so and find it very difficult to interpret that way.
Please, instead of the lectures on our miss-use of this indicators could you not share with us the proper way to interpret its usefulness if any?
Thanks for your time.
Apsll.
|
|
Registered User
Joined: 1/1/2005
Posts: 2,645
|
QUOTE (Apsll) Jim, not to oppose you, but I have viewed some of the wordens products and they sure talk about divergence between price and TSV as if it were very important. Correct me if I am wrong but did they not invent or create the indicator. Maybe I have miss-interpreted their instructional CD’s.
Your problem appears to be with the "wordens products".
QUOTE (Apsll) I am aware that the moving average is not the actual indicator, but it can be a useful toll if interpreted correctly.
I am sure that is true "if interpreted correctly".
Thanks,
Jim Murphy
|
|
Registered User
Joined: 1/1/2005
Posts: 2,645
|
Just to clear up matters, I presented facts, not opinions.
Every one who does not know the facts should be interested in them.
No one should be interested in my opinions.
Please notice that I have just expressed two opinions.
Thanks,
Jim Murphy
|
|
|
Guest-1 |