Registered User
Joined: 3/16/2006
Posts: 2,214
|
 
|
|
Registered User
Joined: 3/16/2006
Posts: 2,214
|

|
|
Registered User
Joined: 3/16/2006
Posts: 2,214
|
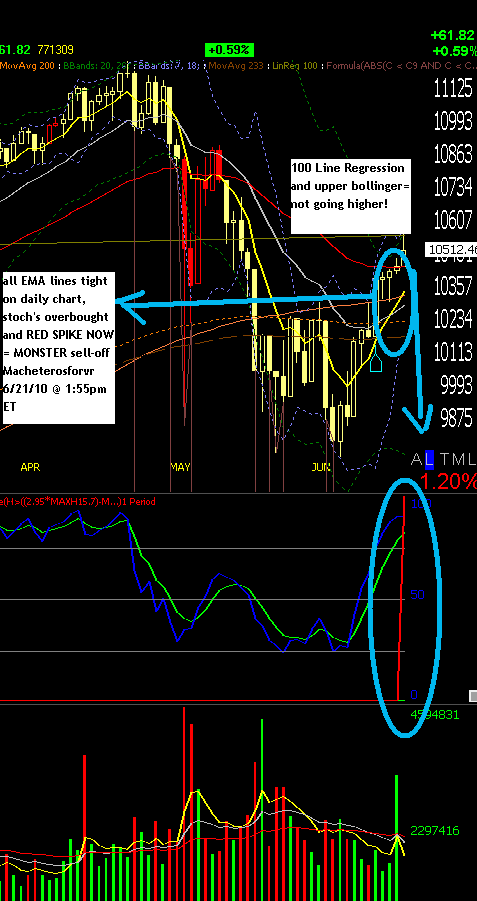
DOW30 REDSPIKE EXIT SIGNAL GIVEN TODAY! = GET OUT OF STOCKS! 9,800 coming!
|
|
Registered User
Joined: 3/16/2006
Posts: 2,214
|
even the monthly chart is tight! (see green charts above)

|
|
Registered User
Joined: 3/16/2006
Posts: 2,214
|
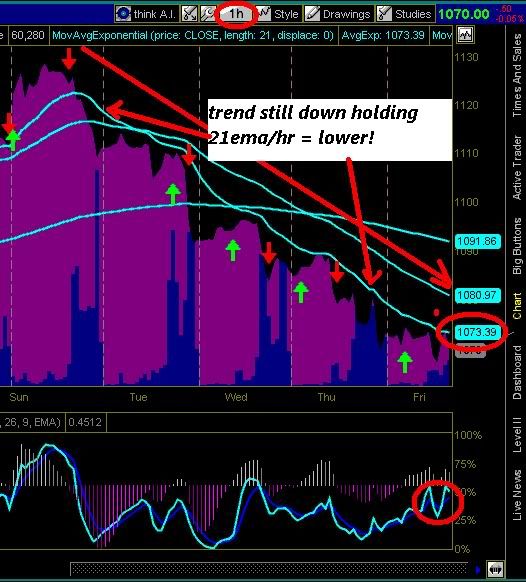
60min is the ONLY timeframe thats NOT n'sync with the other 5! the"2k-3k pt move in 30 days"will come @ dow 10,200 http://bit.ly/dwjTnS $SPX
but the month chart is also tight! so 8 timeframes WILLbe n'sync soon!(1,5,10,15,60min,D,W,M)when that occursThe REALtrend WILL emerge $SPX
which is down, started Oct 9th 2007 - so I expect chopzone area btwn 10,150 and 10,200 for a day, THEN THE REAL FALLING BEGINS! $spx
The reason why I say chopzone near 10,2K dow is because the 233ema/hr is now @ 10,144 so in order to line up shorter timeframes (contd) $SPX
(1,5,10,15,60 min) that will make multiple timeframes were EMA are tight, then market Armageddon begins $SPX
when that time comes,another FLASHCRASH like event could ignite.I dare to say that dow30 will be btwn 7,300 to 8,300 in 2 months!(8/25) $SPX
I said that in Twitter 5:30am ET on June 24th 2010 Macheterosforvr (aka Signaltap)
|
|
Registered User
Joined: 3/16/2006
Posts: 2,214
|
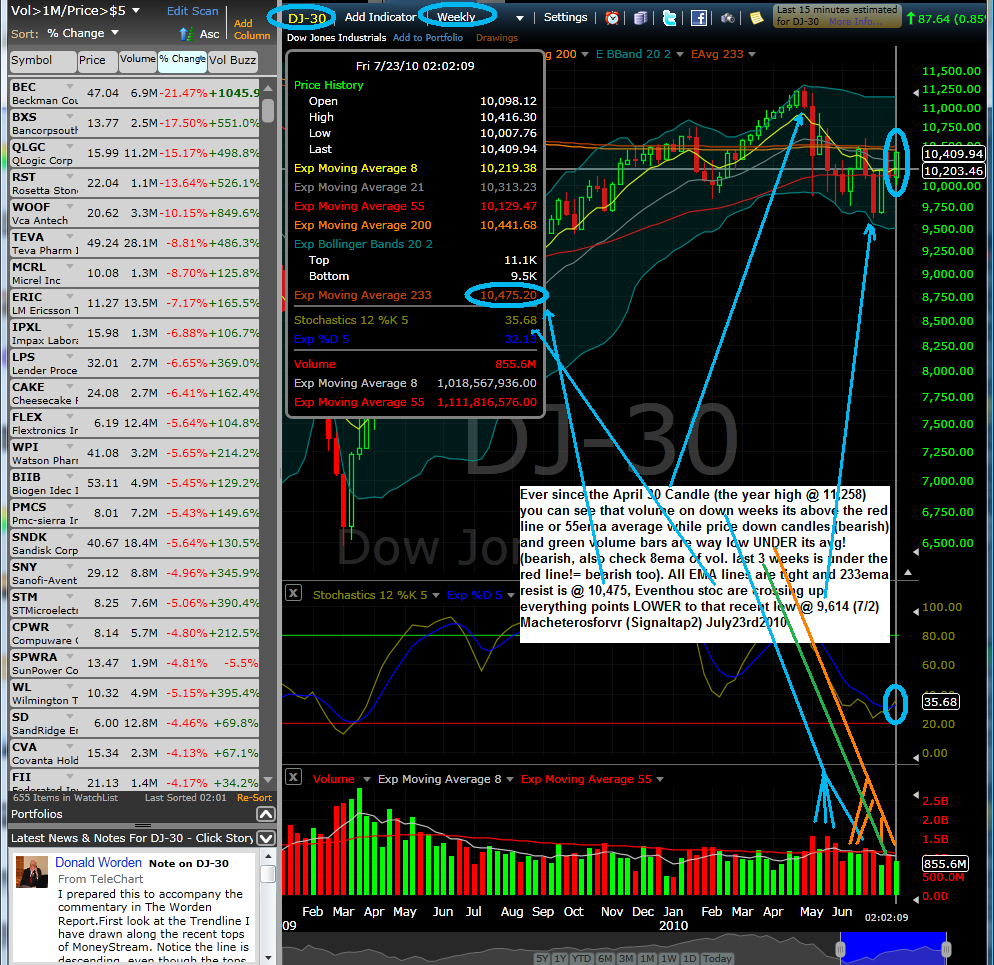
the last time we saw this was 05/19/08, plz take a D chart and zoom back 2 show tightness EMA lines(use 8,21,55,233 ema lines) $SPX 6 minutes ago via TweetDeck
on the daily chart the 233ema @ 10,193 and the 55ema @ 10,438 = only 245 pts tight! = this one is tight as a Boa snake would! $SPX 8 minutes ago via TweetDeck
on the wkly chart (10yr)the 233ema line is @ 10,508 and the widest one, the 55ema @ 10,138 = 370 pts tight for W chart is tight! $SPX 11 minutes ago via TweetDeck
I want remind everyone that EMA lines are DYNAMIC in nature! or that for every NEW close bar a calc is made and change $SPX 14 minutes ago via TweetDeck
dow30 key levels to keep in mind : 21ema/15min @ 10,303 (55/233 are as ONE line!) then on 60min @,222 and 233ema/D @ 10,193 $SPX 17 minutes ago via TweetDeck
the more t'frames you see all EMAlines tight,the more pressure in price you'll see to move in the LT timeframes! 'ndow30 D,W,M r DOWN! $SPX 28 minutes ago via TweetDeck
on a daily chart of I have 21ema @ 1,229.7 -- the 55ema @ 1,201.8 and 233ema @ 1,114.7 those are SUPPORT levels or point 2 BUY!! $SPX 32 minutes ago via TweetDeck
but the good thing about are the longterm timeframes (daily,Weekly, monthly) which are in a STRONG UPTREND! $SPX 34 minutes ago via TweetDeck
I'm sorry I forgot to include 21 in those $SPX 35 minutes ago via TweetDeck
the pressure you see now in is cuz the 60min chart EMA tightness $SPX 37 minutes ago via TweetDeck
I have one exeption, I always include 200 cuz everybody uses it $SPX 41 minutes ago via TweetDeck
3,5,8,13,34,55,89,144,233 those are the the most relevant for me in EMA lines $SPX 42 minutes ago via TweetDeck
I believe in Fractals,but in a diff way-- combining the Golden ratio (1.618~ = God's formula )to everything including EMA in Fib seq $SPX 44 minutes ago via TweetDeck
or the one who dictactes the main trend $SPX about 1 hour ago via TweetDeck
move in harmony) every hour-1 turn and the 5min turns 12 times and 60 times in the minute chart.Bigger timeframes are always in command $SPX about 1 hour ago via TweetDeck
I compare all those timeframes (from 133 tick to a monthly one) on ANY stock to an inside of a swisswatch! (many wheels in diff sizes $SPX about 1 hour ago via TweetDeck
everything is synchronized, from the most minuscle atom or blood cell to the Galaxies in Space, gravity/mass interaction @ its best! $SPX about 1 hour ago via TweetDeck
let me clarify it, first 1min EMA lines get tight and @ sametime 5min/55ema holding price, then sinkage comes.. $SPX about 1 hour ago via TweetDeck
those are computers,the ones selling /es now,I have seen this pattern come up so many times(1min EMA and 55/5 holding price, then POW!) $SPX
|
|
Registered User
Joined: 3/16/2006
Posts: 2,214
|

|
|
Registered User
Joined: 3/16/2006
Posts: 2,214
|
|
|

Registered User
Joined: 2/28/2005
Posts: 825
|
Here's some confirmation for you that I have been watching for awhile
http://baminvestor.com/members/wp-content/uploads/letters/BAM_REPORT_MAY.pdf
Thank you for posting this
art
|
|

Registered User
Joined: 7/1/2008
Posts: 889
|
link did not work
|
|
Registered User
Joined: 2/28/2005
Posts: 825
|
That was weird, If you click on the Bam Report tab at the top and then select the May 2010 report that will get it for you. My bad. I thought I was sending you a direct link. I found it a pretty interesting read.
art
|
|
Registered User
Joined: 3/16/2006
Posts: 2,214
|
FLASHCRASH 2 just began! --- from May 19th 2008 to July 15th 2008 the dow30 dropped 2,800 points in 40 days straight! OVERSOLD DID NOT MATTER! $SPX #gold #forex #dollar
|
|
Registered User
Joined: 8/17/2007
Posts: 2
|
Hey Signaltap.....Nice call
Your charting skills are sharp!
|
|
Registered User
Joined: 3/16/2006
Posts: 2,214
|

|
|
Registered User
Joined: 5/1/2007
Posts: 158
|
It's a trap! Bull trap or bear trap, I don't know. What I do notice is that the drive-bys are allowing the bears on, so this plunge has been approved. Best I can guess is that Treasury needs/wants to sell a load of long U.S. bonds.
Of course the recent data pretty much stinks - new unemployment claims, new houses sold. I do notice the U.S. dollar stopped rising, while the yen bull market continues - Japan is close to Asia, so that makes sense. My estimate for this leg of the bear - starting late June - was a further drop of 6-40%. We've already hit 6%. My quick guess is support areound 8250 Dow, and QQQQ to show beta-adjusted strength. Europe seems to be awaiting music stoppage in its game of musical chairs, while we seem to be tone-deaf.
I thought we were going to rise all this week. Glad I didn't invest that way.Q: When will ECRI report that the long-leading indicator has ticked down? Perhaps they already have - to their institutional investors.
|
|
Registered User
Joined: 3/12/2005
Posts: 2
|
Nice call Signaltap.
Are you on twitter ?
|
|
Registered User
Joined: 9/25/2007
Posts: 1,506
|
QUOTE (tllucero) Q: When will ECRI report that the long-leading indicator has ticked down? Perhaps they already have - to their institutional investors.
Months ago ...
Check out the front page of businesscycle.com

|
|
Registered User
Joined: 3/16/2006
Posts: 2,214
|
|
|

Registered User
Joined: 3/21/2006
Posts: 4,308
|

|
|
|
Guest-1 |