Registered User
Joined: 3/16/2006
Posts: 2,214
|
sp futures are wildly to the upside this am because of Countrywide/Bank of America news, so that helps to get there(+150 more for the dow and +16 more for the sp.)
The TSV crossed the zero line on both, but I'm a little skeptical on the volume on this rebound, so keep watching for those levels mentioned. I will post both charts later, because photobucket is under maintenance now.  
|
|
Registered User
Joined: 3/16/2006
Posts: 2,214
|
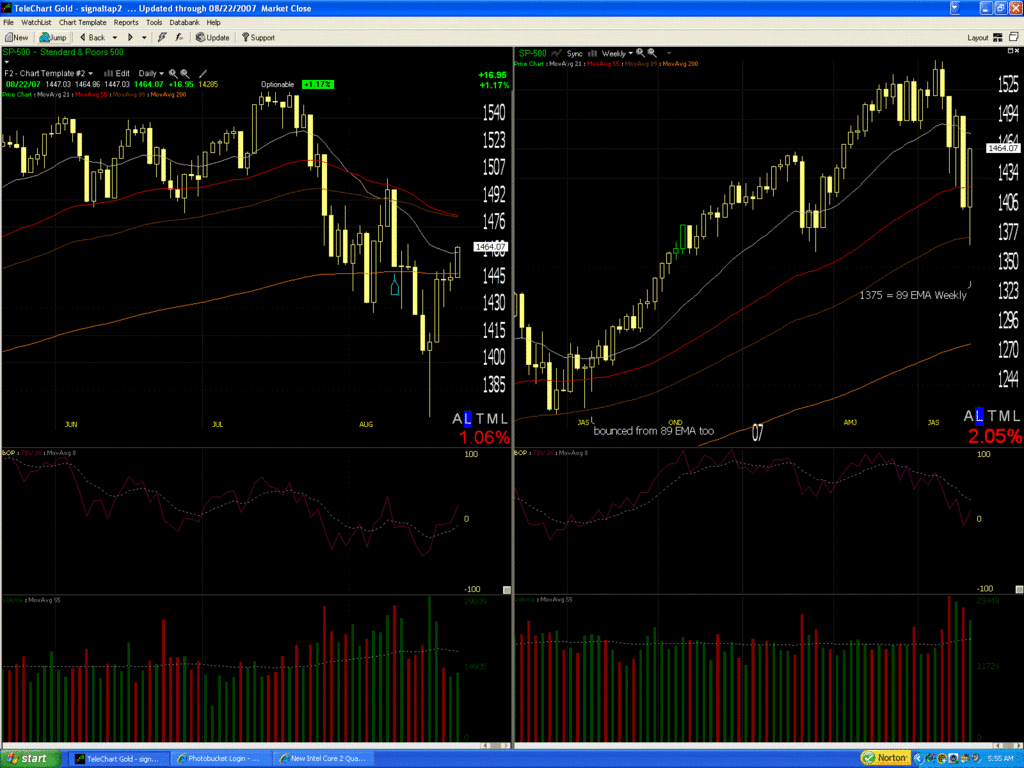
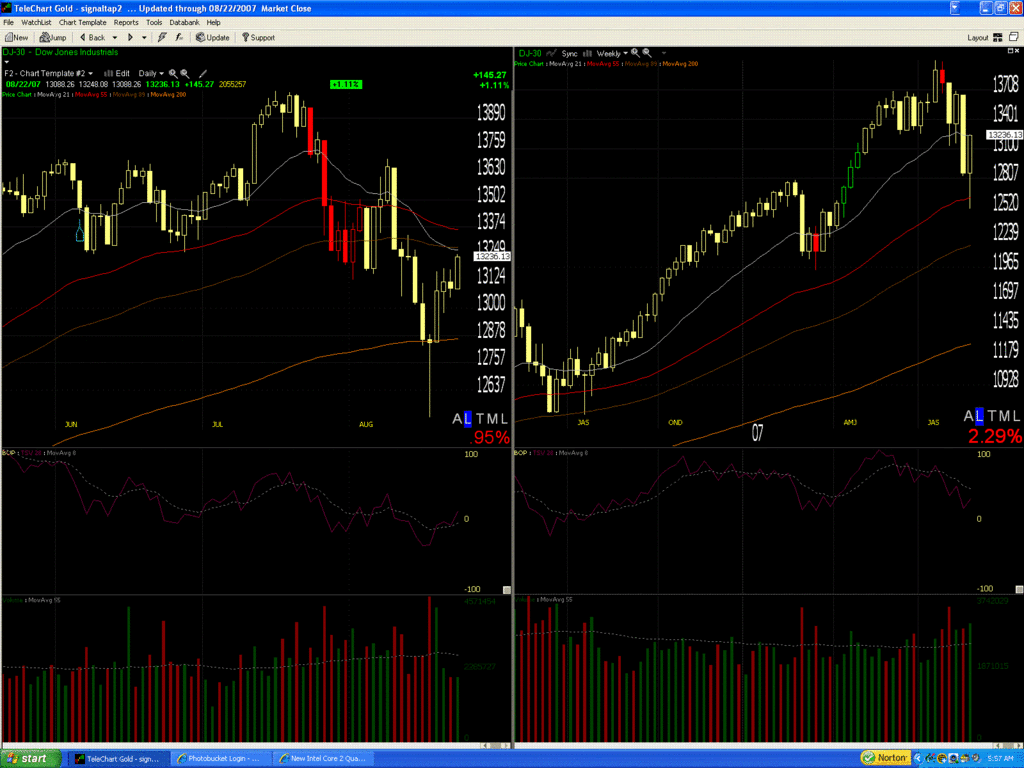
check the 55 EMA daily (redline) thats the crucial level to break!  
|
|
Registered User
Joined: 3/16/2006
Posts: 2,214
|
DJ-30 has 100 pts to go!  
|
|
Registered User
Joined: 3/16/2006
Posts: 2,214
|
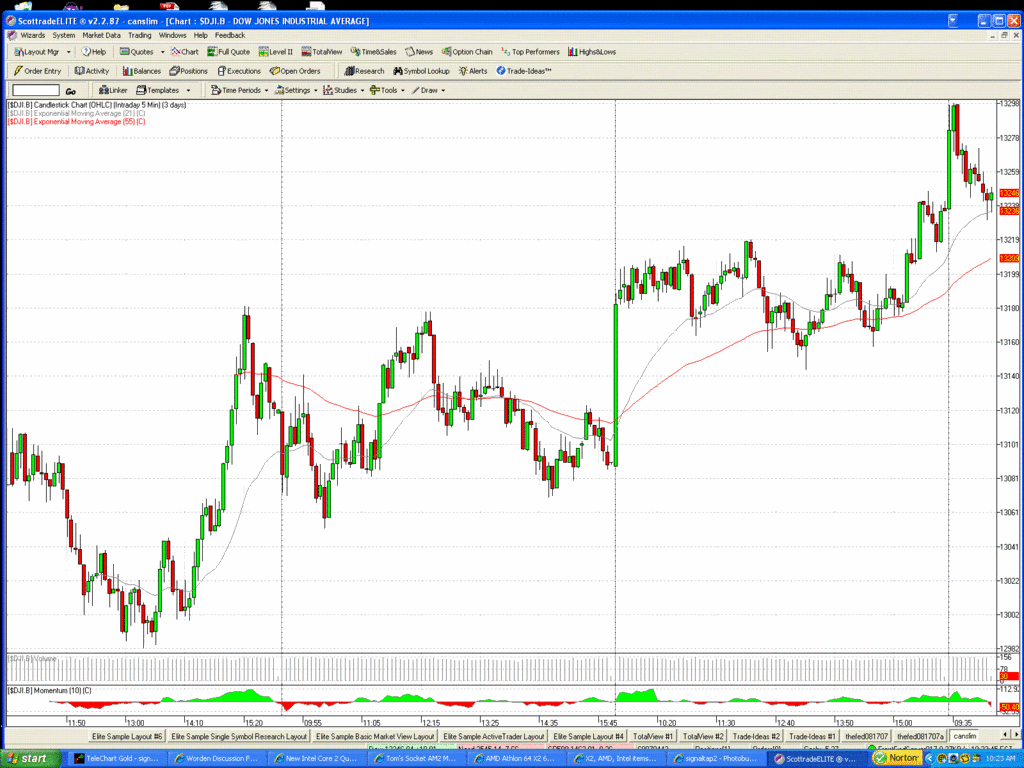
crucial level to hold on a 5min chart 13,210 area=55ema  
|
|
Registered User
Joined: 3/16/2006
Posts: 2,214
|
but is holding the 21 ema 5min (greyline) as of now
|
|
Registered User
Joined: 12/21/2004
Posts: 902
|
Just wanted to say thanks, Signaltap - I don't have access to intraday charts so I appreciate your posts and your commentary, and especially, your enthusiasm   
|
|
Registered User
Joined: 3/16/2006
Posts: 2,214
|
12,310 (5min 55ema) needs to hold here. If not, this comback from the bottom needs to hold 13,159 (60min 55ema) ! from the other day.
If that one breaks will return to a downtrend
|
|
Registered User
Joined: 3/16/2006
Posts: 2,214
|
than you for your comments, hohandy. I do this on the fly while I trade and make decisions  
|
|

Registered User
Joined: 3/21/2006
Posts: 4,308
|
Hohandy, you can go to Bigcharts.com to get intra-day charts for free. They have some basic indicators as well.
Keep in mind that all charts are 15 min delay, so although it is intra-day they are not in realtime.
|
|
Registered User
Joined: 12/21/2004
Posts: 902
|
Thanks Apsll - I guess I knew that - and I can also access via my Amertrade platform if I want (don't know why I never do). I guess I enjoy the added value of Signaltap's commentary.
btw - glad you had a nice vacation
|
|
Registered User
Joined: 3/16/2006
Posts: 2,214
|
looking good! we need 13,370 (it should be a little bit lower now, so we are close!)to be above the 55 ema daily!  
|
|
Registered User
Joined: 3/16/2006
Posts: 2,214
|
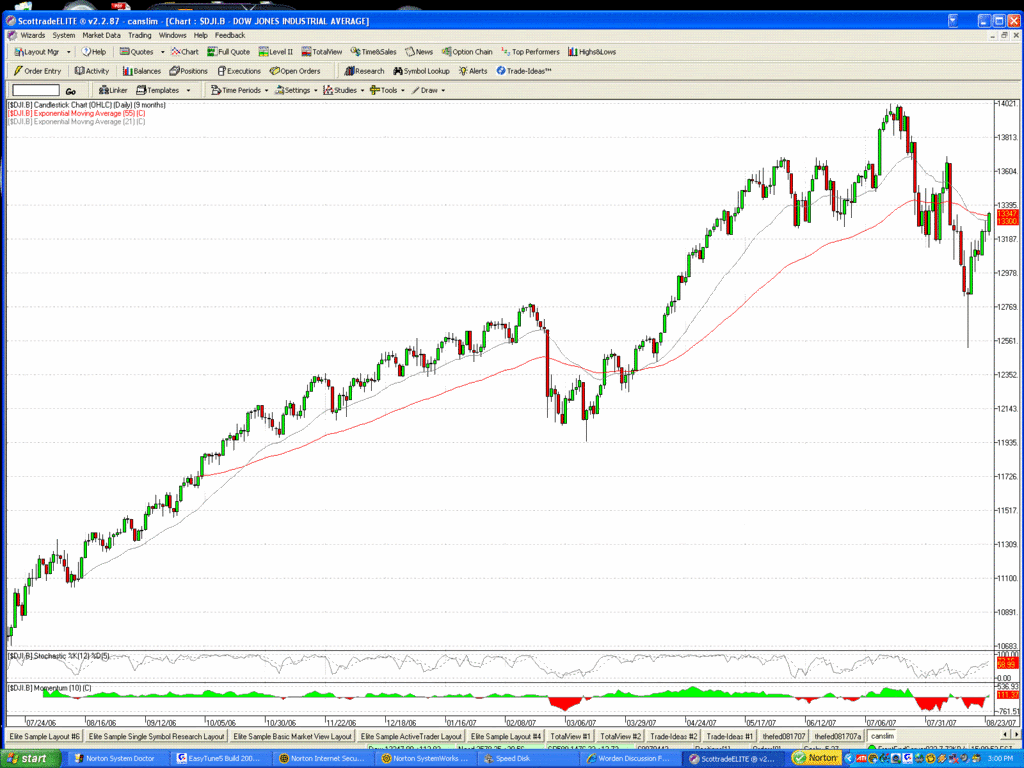
This one is the daily chart for the last 9 months!
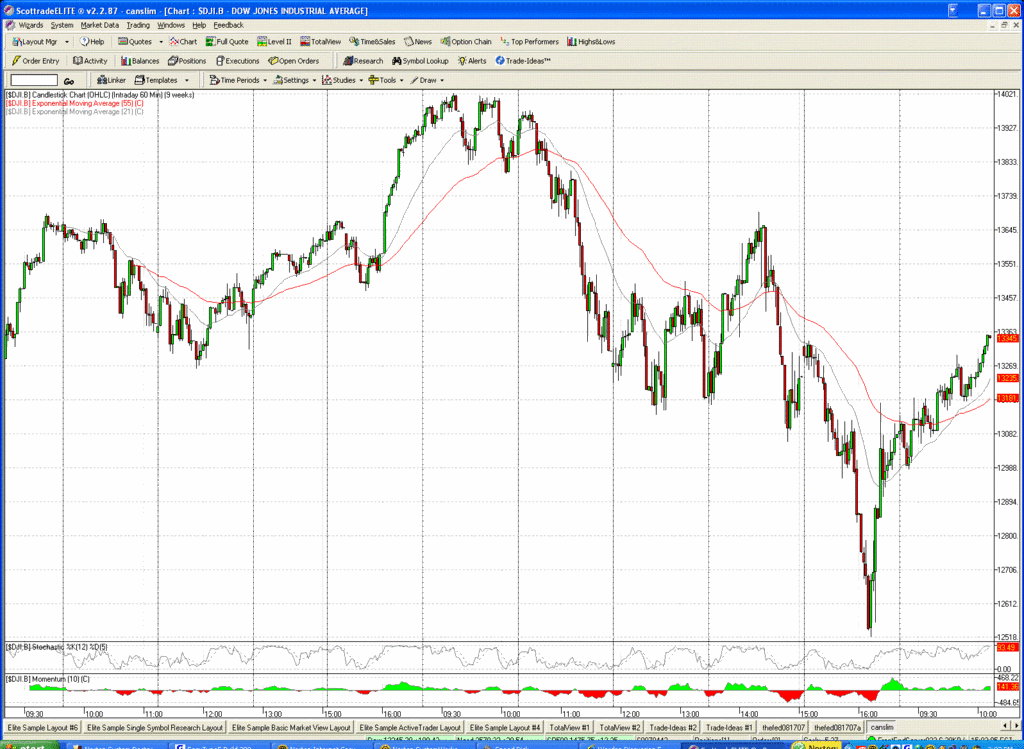
This one is the hourly chart for the last 9 weeks!
|
|
Registered User
Joined: 3/16/2006
Posts: 2,214
|
the 60 min's 55 ema line is well under price (13,181)
the daily one's 55 ema line is at price now! (we need to clear this one too)
|
|
Registered User
Joined: 3/16/2006
Posts: 2,214
|
wow bigtime buying accelerating! shorts think twice of letting "you wounds covered"
|
|
Registered User
Joined: 3/16/2006
Posts: 2,214
|
you wounds uncovered, i meant
|
|
Registered User
Joined: 3/16/2006
Posts: 2,214
|
anything higher than 13,340 which is the 55ema daily IS GREAT!
|
|
Registered User
Joined: 3/16/2006
Posts: 2,214
|
yea! onto 13,645 now!
|
|

Registered User
Joined: 3/21/2006
Posts: 4,308
|
Signaltap2, I would like to play Devils Advocate if I may. 
It is my opinion that the DJ-30 will fall below 13,000 next week. Notice on my chart that the volume was very weak on this last bounce. On the 3 day chart price is above the 55 ema but on the daily chart it just gave it a kiss goodbye (IMO).
I could be wrong in my theory, but if you look at the average market correction they generaly come in 3 waves to the bottom.

|
|
Registered User
Joined: 1/28/2005
Posts: 6,049
|
I'm not sure we will know the truth until after
labor day. (as it relates to volume)
Volume indicators are clouded by holiday/vacation
issues going into labor day weekend.
Thanks
diceman
|
|

Registered User
Joined: 2/9/2005
Posts: 42
|
A rising ascending bearish wedge on low volume, and the retrace now at 61.8% of the drop on most indices, means we are extremely likely to retest, and likely break, the recent lows.
V-bottoms are not bottoms, just bounces, expecially when the volume is low.
The next leg down will begin this week.
|
|
|
Guest-1 |