Registered User
Joined: 9/26/2005
Posts: 49
|
This is the formula for RMO. I need help to impliment it. MOV is moving average, HHV is highest high value of last 10 bars. LLV is lowest low value. Any help would be appreciated.
RMO =
MOV((100 * (C - ((MOV(C,2,S)+
MOV(MOV(C,2,S),2,S)+
MOV(MOV(MOV(C,2,S),2,S),2,S) +
MOV(MOV(MOV(MOV(C,2,S),2,S),2,S),2,S) +
MOV(MOV(MOV(MOV(MOV(C,2,S),2,S),2,S),2,S),2,S) +
MOV(MOV(MOV(MOV(MOV(MOV(C,2,S),2,S),2,S),2,S),2,S),2,S) +
MOV(MOV(MOV(MOV(MOV(MOV(MOV(C,2,S),2,S),2,S),2,S),2,S),2,S),2,S)+
MOV(MOV(MOV(MOV(MOV(MOV(MOV(MOV(C,2,S),2,S),2,S),2,S),2,S),2,S),2,S),2,S)+
MOV(MOV(MOV(MOV(MOV(MOV(MOV(MOV(MOV(C,2,S),2,S),2,S),2,S),2,S),2,S),2,S), 2,S),2,S)+
MOV(MOV(MOV(MOV(MOV(MOV(MOV(MOV(MOV(MOV(C,2,S),2,S),2,S),2,S),2,S),2,S), 2,S),2,S),2,S),2,S))
/10))/(HHV(C,10)-LLV(C,10))),81,E)
|
|


Worden Trainer
Joined: 10/7/2004
Posts: 65,138
|
Please try the following RealCode Indicator:
'# Cumulative
Static EMA As Single
Static sumWeight As Single
Static termRatio As Single = 80 / 82
If CurrentIndex >= 10 Then
Dim Weight As Single = 1 / sumWeight
If Price.MaxClose(10) <> Price.MinClose(10)
EMA = EMA * (1 - Weight) + Weight * 100 * (Price.Last - _
(1023 * Price.Last + _
2036 * Price.Last(1) + _
1981 * Price.Last(2) + _
1816 * Price.Last(3) + _
1486 * Price.Last(4) + _
1024 * Price.Last(5) + _
562 * Price.Last(6 ) + _
232 * Price.Last(7) + _
67 * Price.Last(8) + _
12 * Price.Last(9) + _
Price.Last(10)) / 10240) / _
(Price.MaxClose(10) - Price.MinClose(10))
Else
EMA = EMA * (1 - Weight)
End If
sumWeight = sumWeight * termRatio + 1
Plot = EMA
Else
If isFirstBar Then
EMA = 0
sumWeight = 1
End If
Plot = Single.NaN
End If
-Bruce
Personal Criteria Formulas
TC2000 Support Articles
|
|
Registered User
Joined: 9/26/2005
Posts: 49
|
Thanks, I checked it out and it works great. You are a Wizard.
I would be interested in how you came up with this. A couple of pointers would help. I may want to do something like this again.
The basis of the indicator taken from a Rainbow Oscillator. But the modification is the basis of the RMO system. I think I can do the other indicators in the system. If not I will be back.
|
|
Registered User
Joined: 9/26/2005
Posts: 49
|
Bruce,
I out foxed my self. The RMO system uses 3 indicators
SwingTrd1
SwingTrd2= EMA(SwingTrd1,30);
SwingTrd3= EMA(SwingTrd2,30);
RMO= EMA(SwingTrd1,81);
I ask for help in coding RMO and I should have ask for SwingTrd1. Given a SwingTrd1 plot I can create the other three moving averages within StockFinder.
Sorry to ask twice but can you modify the above to give me SwingTrd1 as shown below. Note that it is similar to the above without the outer EMV
SwingTrd1 = 100 * (Close - ((MA(C,2)+
MA(MA(C,2),2)+
MA(MA(MA(C,2),2),2) +
MA(MA(MA(MA(C,2),2),2),2) +
MA(MA(MA(MA(MA(C,2),2),2),2),2) +
MA(MA(MA(MA(MA(MA(C,2),2),2),2),2),2) +
MA(MA(MA(MA(MA(MA(MA(C,2),2),2),2),2),2),2)+
MA(MA(MA(MA(MA(MA(MA(MA(C,2),2),2),2),2),2),2),2)+
MA(MA(MA(MA(MA(MA(MA(MA(MA(C,2),2),2),2),2),2),2), 2),2)+
MA(MA(MA(MA(MA(MA(MA(MA(MA(MA(C,2),2),2),2),2),2), 2),2),2),2))
/10))/(HHV(C,10)-LLV(C,10));
|
|
Worden Trainer
Joined: 10/7/2004
Posts: 65,138
|
It's a little more straightforward without the 81-Period EMA:
If CurrentIndex >= 10
Plot = 100 * (Price.Last - _
(1023 * Price.Last + _
2036 * Price.Last(1) + _
1981 * Price.Last(2) + _
1816 * Price.Last(3) + _
1486 * Price.Last(4) + _
1024 * Price.Last(5) + _
562 * Price.Last(6 ) + _
232 * Price.Last(7) + _
67 * Price.Last(8) + _
12 * Price.Last(9) + _
Price.Last(10)) / 10240) / _
(Price.MaxClose(10) - Price.MinClose(10))
Else
Plot = Single.NaN
End If
I just determined what the contribution of each of the past prices would be to the combined Moving Averages. Unfortunately, there wasn't any sort of trick or short cut to it. I just calculated it by hand. I did it this way because it was easier than manually creating all of the Moving Averages in the formula in RealCode (at least for me). It also seemed like it would be less computationally intensive than the algorithms that came to mind.
-Bruce
Personal Criteria Formulas
TC2000 Support Articles
|
|
Registered User
Joined: 9/26/2005
Posts: 49
|
Bruce,
I sometimes get angry at Worden because of poor communications and broken promises. I have been a customer back to the days of DOS under several user ID's. Remember TC2000/FUNDS. I have quit several times but so far I keep coming back.
But you never dissapoint. You are a credit to Worden. If there were more of you Worden would be better off.
I hope you share this with your boss or his boss.
|
|
Worden Trainer
Joined: 10/7/2004
Posts: 65,138
|
Thank you. I appreciate the feedback. I won't need to explicitly point it out since my boss both reads the forums and answers posts.
-Bruce
Personal Criteria Formulas
TC2000 Support Articles
|
|
Registered User
Joined: 12/31/2005
Posts: 2,499
|
QUOTE (CGTrader)
Bruce,
I out foxed my self. The RMO system uses 3 indicators
SwingTrd1
SwingTrd2= EMA(SwingTrd1,30);
SwingTrd3= EMA(SwingTrd2,30);
RMO= EMA(SwingTrd1,81);
I ask for help in coding RMO and I should have ask for SwingTrd1. Given a SwingTrd1 plot I can create the other three moving averages within StockFinder.
Sorry to ask twice but can you modify the above to give me SwingTrd1 as shown below. Note that it is similar to the above without the outer EMV
SwingTrd1 = 100 * (Close - ((MA(C,2)+
MA(MA(C,2),2)+
MA(MA(MA(C,2),2),2) +
MA(MA(MA(MA(C,2),2),2),2) +
MA(MA(MA(MA(MA(C,2),2),2),2),2) +
MA(MA(MA(MA(MA(MA(C,2),2),2),2),2),2) +
MA(MA(MA(MA(MA(MA(MA(C,2),2),2),2),2),2),2)+
MA(MA(MA(MA(MA(MA(MA(MA(C,2),2),2),2),2),2),2),2)+
MA(MA(MA(MA(MA(MA(MA(MA(MA(C,2),2),2),2),2),2),2), 2),2)+
MA(MA(MA(MA(MA(MA(MA(MA(MA(MA(C,2),2),2),2),2),2), 2),2),2),2))
/10))/(HHV(C,10)-LLV(C,10));
Here is an alternate approach of getting the actual solution to the formula for the RMO.
I think Bruce's RMO is not the EMA(SwingTrd1,81).
Anyway this is an outline for the alternative. The approach is a moving average of a moving average of a etc. etc.
1. Add a simple moving average of period 2 to the chart, call it MA2
2. apply a simple moving average to MA2 with period 2, call it MA2x2
3. apply a simple moving average to MA2x2 with period 2. call it MA2x2p2
4. continue, call it MA2x2p3
5. continue, call it MA2x2p4
6. continue call it MA2x2p5
7. continue, call it MA2x2p6
8. continue, call it MA2x2p7
9. continue, call it MA2x2p8
10. continue, call it MA2x2p9
'
' the follwoing is untested and uncompiled and attempts to duplicate the
' MA(MA(MA... code exactly
'
'# MA2 = indicator.MAwhatever
'# MA2x2 = indicator.MAwhatever
'# MA2x2p2 = indicator.MAwhatever
'# MA2x2p3 = indicator.MAwhatever
'# MA2x2p4 = indicator.MAwhatever
'# MA2x2p5 = indicator.MAwhatever
'# MA2x2p6 = indicator.MAwhatever
'# MA2x2p7 = indicator.MAwhatever
'# MA2x2p8 = indicator.MAwhatever
'# MA2x2p9 = indicator.MAwhatever
dim SwingTrd1 as single
SwingTrd1 = 100* (price.close - _
((MA2.value + _
MA2x2.value + _
MA2x2p2.value + _
MA2x2p3.value + _
MA2x2p4.value + _
MA2x2p5.value + _
MA2x2p6.value + _
MA2x2p7.value + _
MA2x2p8.value + _
MA2x2p9.value)/10)/(Price.MaxClose(10) - Price.MinClose(10)))
plot = SwingTrd1
Apply an EMA of period 81 to SwingTrd1's plot for RMO
Apply an EMA of period 30 to SwingTrd1's plot for SwingTrd2
Apply an Ema of period 30 to SwingTrd2's plot for SwingTrd3
|
|
Worden Trainer
Joined: 10/7/2004
Posts: 65,138
|
QUOTE (jas0501) I think Bruce's RMO is not the EMA(SwingTrd1,81).
I am somewhat curious as to why you would think such a thing. I could certainly be wrong, but I think the first RealCode I provided in this topic does in fact represent EMA(SwingTrd1,81) and that the second RealCode I provided accurately reproduces the raw SwingTrd1.
In any case, I don't think the parentheses are correct in your version. I suspect the following line:
MA2x2p9.value)/10)/(Price.MaxClose(10) - Price.MinClose(10)))
Needs to be the following instead to match the code supplied by CGTrader (this leaves at least two unnecessary parentheses in the RealCode, but they should not be harmful and were contained in the original code provided):
MA2x2p9.value)/10))/(Price.MaxClose(10) - Price.MinClose(10))
-Bruce
Personal Criteria Formulas
TC2000 Support Articles
|
|
Registered User
Joined: 12/31/2005
Posts: 2,499
|
Bruce,
You are correct. I misread your post. The post from Monday, January 19, 2009 7:46:36 PM was just SwingTrd1 not the RMO.
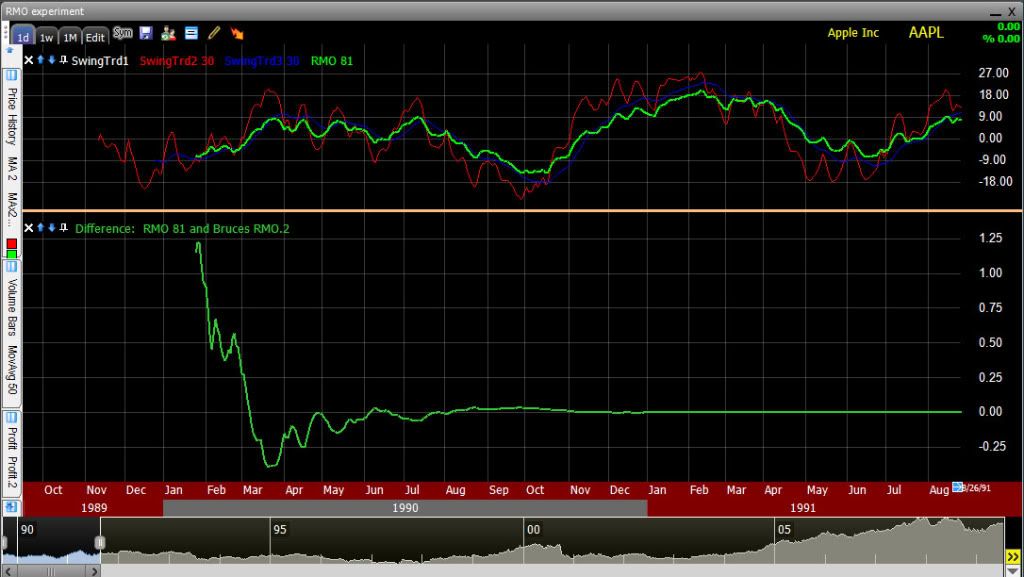
I did a difference between your RMO formula and a composed indicator, using Blocks 3.1, as I don't have Stockfinder on this machine. Aside from startup differences the first few months, the differences are negligible. See screen shot below.
I'm sure the performance of your RMO formula posted on Monday, January 19, 2009 12:10:34 PM is far far better than mine as mine needs to add 11 extra indicators to the chart!
I aplogize for my incorrect assertion.
Here is an example showing the early differences in a difference plot of AAPL:
|
|
Registered User
Joined: 12/31/2005
Posts: 2,499
|
Here is the corrected SwingTrd1 code uses as the basis for the 3 EMA's, SwingTrd2. SwingTrd3, and RMO.
'# MA2 = indicator.MovingAverage.3
'# MA2x2 = indicator.MovingAverage
'# MA2x2p2 = indicator.MovingAverage.4
'# MA2x2p3 = indicator.MovingAverage.5
'# MA2x2p4 = indicator.MovingAverage.6
'# MA2x2p5 = indicator.MovingAverage.7
'# MA2x2p6 = indicator.MovingAverage.8
'# MA2x2p7 = indicator.MovingAverage.9
'# MA2x2p8 = indicator.MovingAverage.10
'# MA2x2p9 = indicator.MovingAverage.11
dim SwingTrd1 as single
SwingTrd1 = _
100* _
(price.close - _
( _
(MA2.value + _
MA2x2.value + _
MA2x2p2.value + _
MA2x2p3.value + _
MA2x2p4.value + _
MA2x2p5.value + _
MA2x2p6.value + _
MA2x2p7.value + _
MA2x2p8.value + _
MA2x2p9.value) _
/10) _
) _
/(Price.MaxClose(10) - Price.MinClose(10) _
)
plot = SwingTrd1
|
|
Registered User
Joined: 11/16/2005
Posts: 19
|
Bruce,
First, I do agree w/ the post about your customer service. You and the Worden team have always been good to work with.
I am a little confused by all these post.
What is the total RealCode formula for RMO (See Below):
Also, what is the formula so it will give the "buy" and "Sell" indicators ?
As always, thanks for your time and help.
-=SwingTrd 1=-
100 *
(CLOSE - ((Mov(C,2,S) +
Mov(Mov(C,2,S),2,S) +
Mov(Mov(Mov(C,2,S),2,S),2,S) +
Mov(Mov(Mov(Mov(C,2,S),2,S),2,S),2,S) +
Mov(Mov(Mov(Mov(Mov(C,2,S),2,S),2,S),2,S),2,S) +
Mov(Mov(Mov(Mov(Mov(Mov(C,2,S),2,S),2,S),2,S),2,S),2,S) +
Mov(Mov(Mov(Mov(Mov(Mov(Mov(C,2,S),2,S),2,S),2,S),2,S),2,S),2,S) +
Mov(Mov(Mov(Mov(Mov(Mov(Mov(Mov(C,2,S),2,S),2,S),2,S),2,S),2,S),2,S),2,S) +
Mov(Mov(Mov(Mov(Mov(Mov(Mov(Mov(Mov(C,2,S),2,S),2,S),2,S),2,S),2,S),2,S),2,S),2,S) +
Mov(Mov(Mov(Mov(Mov(Mov(Mov(Mov(Mov(Mov(C,2,S),2,S),2,S),2,S),2,S),2,S),2,S),2,S),2,S),2,S)) / 10)) /
(HHV(C,10) - LLV(C,10))
-=SwingTrd 2=-
Mov(Fml("SwingTrd 1"),30,E)
-=SwingTrd 3=-
Mov(Fml("SwingTrd 2"),30,E)
Expert:
-=RMO + SwingTrd + Market Trend=-
Bullish Trend:
Mov(Fml("SwingTrd 1"),81,E)>0
BearishTrend:
Mov(Fml("SwingTrd 1"),81,E)<0
Highlights Sell:
Mov(Fml("SwingTrd 1"),81,E)<0
Highlights Buy:
(Mov(Fml("SwingTrd 1"),30,E)) > 0
Buy Arrow:
Cross( Fml( "swingTrd 2"),Fml( "swingTrd 3") )
Sell Arrow:
Cross( Fml( "swingTrd 3") , Fml( "swingTrd 2"))
|
|
Administration
Joined: 9/30/2004
Posts: 9,187
|
Try the attached chart b212u.
Edit: I've attached my version as well (for SF5 and called Rahul Mohindar Oscillator) - Bruce_LAttachments:
RMO System.sfChart - 71 KB, downloaded 620 time(s).
Rahul Mohindar Oscillator.sfChart - 70 KB, downloaded 639 time(s).
|
|
Registered User
Joined: 11/16/2005
Posts: 19
|
Stockguy / Bruce
I downloaded them and tried add them as an Indicator but they don't work.
They show up as yellow triangles in the "indicator window"
Did I do something wrong?
|
|
Administration
Joined: 9/30/2004
Posts: 9,187
|
Are you running version 4 or version 5? My chart will only work in version 5.
|
|
Registered User
Joined: 11/16/2005
Posts: 19
|
I have stockfinder 5
|
|
Registered User
Joined: 11/16/2005
Posts: 19
|
When I opened it in the folder I placed it in; it worked. It's in a new tab.
I still can't get in the indicator library.
|
|
Administration
Joined: 9/30/2004
Posts: 9,187
|
It's not in the indicator library. The files Bruce and I posted are charts, not indicators.
If you load the chart, then right click on RMO you can save the indicator to your local library.
|
|
Registered User
Joined: 11/16/2005
Posts: 19
|
Thanks.......I got it.
I really appreciate your time, kindness, and patience.
Happy Investing. :-)
Bill
|
|
Registered User
Joined: 11/16/2005
Posts: 19
|
One last question on this item...I should know but I am having some difficulty.
If you don't mind, how do I edit these indicators to only sort between 1 bar and 5 bars?
Again...........Thanks
Bill
|
|
Worden Trainer
Joined: 10/7/2004
Posts: 65,138
|
b212u,
I really don't understand the question. I can't figure out what is supposed to be between 1 bar and 5 bars?
-Bruce
Personal Criteria Formulas
TC2000 Support Articles
|
|
Registered User
Joined: 11/16/2005
Posts: 19
|
When Stockinder scans RMO it shows all the stocks from 1 to 50 in a row.
how do I get it to scan just showing the stocks from 1 to 5 in a row?
I hope this explanation helps...........
Bill
|
|
Worden Trainer
Joined: 10/7/2004
Posts: 65,138
|
The only way I can think of would be by creating another Condition based on the original Condition. For example, if you Dragged and Dropped the Bullish Trend Condition into the Code tab of the RealCode Editor of a RealCode Condition, it would create the # BT = chartCondition.BullishTrend line of the following RealCode Condition (you could Drag and Drop a different Condition into the RealCode Condition to check that base Condition instead):
'|*****************************************************************|
'|*** StockFinder RealCode Condition - Version 5.0 www.worden.com
'|*** Copy and paste this header and code into StockFinder *********
'|*** Condition:In a Row At or Below
'|******************************************************************
'# BT = chartCondition.BullishTrend
'# MaxInARow = UserInput.Integer = 5
Static Count As Integer
If isFirstBar Then
Count = 0
End If
If BT.Value = True Then
Count += 1
If Count <= MaxInARow Then
Pass
End If
Else
Count = 0
End If
-Bruce
Personal Criteria Formulas
TC2000 Support Articles
|
|
Registered User
Joined: 11/16/2005
Posts: 19
|
Bruce,
Thanks. That's what I was trying to accomplish. There still a few stocks, after the scan, that had more than 5 bars, after the "Buy" indicator.
I appreciate the help.
Bill
|
|
Worden Trainer
Joined: 10/7/2004
Posts: 65,138
|
You're welcome.
-Bruce
Personal Criteria Formulas
TC2000 Support Articles
|
|
|
Guest-1 |