| db |
|
Gold User, Member, Platinum User, TeleChart
|
| Registered User |
|
|
|
|
| Unsure |
|
| Sunday, January 30, 2005 |
| Saturday, December 7, 2019 6:50:05 PM |
25
[0.01% of all post / 0.00 posts per day] |
|
|
I haven't visited this thread for a while. There are two detailed readings to grasp the logic for wave volume. The first is : Studies in Tape Reading by Richard D. Wyckoff. The discussion on wave volume starts on page 123 near the bottom. The second is: Trades about to happen by David H Weis. This is very detailed starting on page 127, chapter 9.
One can create a custom custom cumulative indicator like this: up condition c>c1+0.75, down condition c<c1-0.75, value to add/subrtact v.
This leaves the figure amount easy to adjust to the stock and intra day time.
The obvious draw back is the volume count does not change back to 0 for the wave count after the price change.
Hoping if the program team takes this indicator on this will give them some quick reference.
db
|
|
Back again,
Dummy here said multiple charts, but could change the amounts for the box size and use multiple indicators on the same chart to follow what works best with that stock.
db
|
|
Thanks Stryder,
I will try to explain how I might try and approach this, but may be a little long. Two terms in PF charting: 1. Box size = point or dollar figure to continue column of X's or O's, that would be the Retrace Figure in my last post. 2. Reversal = number of box sizes to form a new column of X's or O's (a price reversal), that would be the Retrace Method.
That is why Bruce said the formula would be long.
Maybe a work around would be to start out with a one box size reversal. For example say we are trading a 10.00 dollar stock and our box size was 0.50 and the Reversal number was one. Assume the stock is in a column of X's, the price would have to change down by at least 0.50 for a reversal. The volume count would begin one bar after this set amount. As long as price did not advance by 0.50 the count would continue. This may keep the formula fairly simple.
This would also mean creation of several price charts for different box sizes or amounts. This is common practice to have to change box size and reversals to study different priced charts in PF. Something else to consider is Dow, Wyckoff, and others only used one box reversals in their studies. The two and three reversals are something not that old.
http://i120.photobucket.com/albums/o173/dblack90/Chartcraft_zps9793f927.jpg
Hope this helps
db
|
|
Hi Stryder,
First I want to compliment Bruce on excellent work.
The Weis wave is based around point and figure charting. Most boxes used are based on a set amount/point of change. The cummulative volume wave is built around David's wave chart. That means it is basically a indicator of an indicator. Below is the example of this thought:
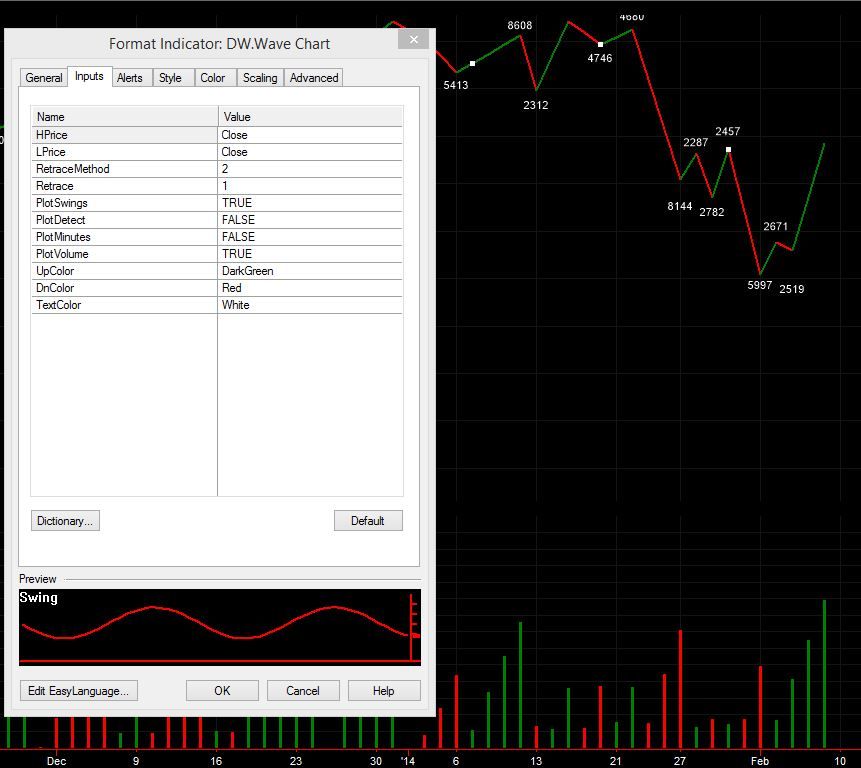
Instead of using the high and low David used the Close. The retrace is the amount in points or dollar figures.
The cummulative wave is figured from the same data which means the reversal is always started one bar after the signal bar.
Hope this helps in your studies.
db
|
|
FWIW
CHANGE BAR CANDLE BOLDNESS
8/5/13
DB
Bars and Candles are easier to see for older folks like me if they are slightly bolder than the default settings, epically if I shade an area of congestion with a similar color to the chart/bar colors.
Step 1: Click Price History, Edit.
Step 2: Down arrow at Plot Style, Line.
 
Step 3: Choose thicker Line Width from Default.
Step 4: Plot Style down arrow, choose Style you like to use, eg. OHLC Bar, CandleStick, etc.
Step 5: Click OK.
Enjoy
db
|
Thanks Bruce you do great work for all of us out here.
db
|
Jmesin here is a good article on the Volume Zone Oscillator. http://www.ifta.org/public/files/journal/d_ifta_journal_09.pdf
Bruce would you consider writing a real code indicator for Volume Zone Oscillator that can be used in Stockfinder.
As always Thanks much
db
|
Thanks Bruce. I worked four or five hours and all I ever managed was crap, so much to study. Course to learn one gets to do some crap first.
thanks again
db
|
Hi Bruce,
I am a failure at real code, but will keep trying to learn from the great examples you guys share. I would like to calculate the average volume from a swing low to swing high and swing high to swing low.
Swing high definition: H < H1 and also H1 > H2
Swing low definition: L > L1 and also L1 < L2
Example for start count:: If swing low definition is true then start add volume at todays bar(L>L1). Continue to add volume and average the volume until Swing high becomes true. The last volume to be added and averaged would be bar H1. The opposite would occur for the average volume going from swing high to swing low.
The logic is comparing volume against previous upswings and downswings along with upswings to downswings. Drawbacks are areas of whipsaw, but one cannot control all in life. Would a indicator like this work better as a class or just code for the indicator? Much to learn. If you can do the upswing code for me I will try and adapt that for the downswing average. That way I can attempt to study the code in depth to continue to learn. If I fail I will call out uncle, lol.
Thanks
Darrell
|
Thank you Bruce. You guys are great at helping us and I really do appriciate your pride in the quality of work you do.
Darrell
|
|