Registered User
Joined: 6/7/2013
Posts: 16
|
Hi there,
Im wanting to create a Cumulative Wave indicator.
So basically, say u have 1 up wave, then a down wave, then another up wave on the price action chart. I want the indicator at the bottom of the screen to show the cumulative volume of each wave from swing high to swing low. So the cumulative volume of wave 1 say its takes 6 5min bars, then start again and work out the cumulative volume of wave 2 then 3 and so on.
What would be good is if the up wave bars at the bottom of the screen were coloured green and the down wave cumulative volume would colour red.
And between each wave on the actual price action chart it draws a line from each swing high to swing low and so on. And it could write the total number of cumulative volume at the end of each wave on the price action chart.
Hope that makes sense.
It can be explained easier in a diagram, but not sure if i can attach one.
Cheers Rich!
|
|


Worden Trainer
Joined: 10/7/2004
Posts: 65,138
|
We could do this fairly easily in StockFinder, but I cannot think of a way to do this in TC2000.
I cannot think of any way at all to create a Zig Zag indicator in TC2000.
The cumulative volume portion of the request is theoretically possible using the techniques in the Days Since Last Peak (or other day-counting needs) topic if we limit the lookback period over which any particular wave can occur, but the resulting formula for what you actually want will probably end up being too long and slow to be practical or post in the forums.
Attempting such a formula would start with creating an anambiguous objective definition of what constitutes the point at which you switch between waves. The simpler the definition is to express in the Personal Criteria Formula Language, the longer the lookback period over which we can calculate volume will be.
-Bruce
Personal Criteria Formulas
TC2000 Support Articles
|
|
Registered User
Joined: 6/7/2013
Posts: 16
|
Right ok so......
An anambiguous objective definition of what constitutes the point at which you switch between waves = a high with 2 lower highs straight after it to a low with 2 higher lows straight after it (Swing high & swing low).
The lookback period for each wave would only have to be the amount of bars that are in that wave, lets say 6 bars in an up wave. So its the volume of each bar added together as u go along.
Howz that lookin, are we on the right track?
Oh and whats StockFinder? Another charting package?
Right, where do we go from here Bruce?
Cheers Rich!
|
|
Worden Trainer
Joined: 10/7/2004
Posts: 65,138
|
The lookback is a fixed number of bars. It is the limit of how many bars will be checked for your requirements (in this case a pivot high or pivot low). This means that if a pivot high or pivot low is not detected during the lookback period, the formula cannot calculate correctly.
A lookback perod of 6 did not seem long enough, so I increased it to 20. You will probably want to add Custom PCF Indicators with the following settings to the same pane and scale to see how the unambiguous objective definition you supplied matches up with what you want.
Adding and Moving Indicators
Note that cumulated volume will not appear until two bars after the pivot as that is when the pivot is actually identified.
A Custom PCF Indicator displaying the amount of volume since the most recently identified pivot if that pivot is a pivot low could be created using the following settings:
- Plot Style: Histogram
- Plot Color: Green
- Negative Value Color: Unchecked
- Period: 1
- Average Type: Simple
- Formula: ABS((MAXH2.0 < H2 AND H2 > MAXH2.3) OR (MINL2.0 > L2 AND L2 < MINL2.3)) * ((MINL2.0 > L2 AND L2 < MINL2.3) * (-3) * AVGV3.0) - NOT((MAXH2.0 < H2 AND H2 > MAXH2.3) OR (MINL2.0 > L2 AND L2 < MINL2.3)) * (ABS((MAXH2.1 < H3 AND H3 > MAXH2.4) OR (MINL2.1 > L3 AND L3 < MINL2.4)) * ((MINL2.1 > L3 AND L3 < MINL2.4) * (-4) * AVGV4.1) - NOT((MAXH2.1 < H3 AND H3 > MAXH2.4) OR (MINL2.1 > L3 AND L3 < MINL2.4)) * (ABS((MAXH2.2 < H4 AND H4 > MAXH2.5) OR (MINL2.2 > L4 AND L4 < MINL2.5)) * ((MINL2.2 > L4 AND L4 < MINL2.5) * (-5) * AVGV5.2) - NOT((MAXH2.2 < H4 AND H4 > MAXH2.5) OR (MINL2.2 > L4 AND L4 < MINL2.5)) * (ABS((MAXH2.3 < H5 AND H5 > MAXH2.6) OR (MINL2.3 > L5 AND L5 < MINL2.6)) * ((MINL2.3 > L5 AND L5 < MINL2.6) * (-6) * AVGV6.3) - NOT((MAXH2.3 < H5 AND H5 > MAXH2.6) OR (MINL2.3 > L5 AND L5 < MINL2.6)) * (ABS((MAXH2.4 < H6 AND H6 > MAXH2.7) OR (MINL2.4 > L6 AND L6 < MINL2.7)) * ((MINL2.4 > L6 AND L6 < MINL2.7) * (-7) * AVGV7.4) - NOT((MAXH2.4 < H6 AND H6 > MAXH2.7) OR (MINL2.4 > L6 AND L6 < MINL2.7)) * (ABS((MAXH2.5 < H7 AND H7 > MAXH2.8) OR (MINL2.5 > L7 AND L7 < MINL2.8)) * ((MINL2.5 > L7 AND L7 < MINL2.8) * (-8) * AVGV8.5) - NOT((MAXH2.5 < H7 AND H7 > MAXH2.8) OR (MINL2.5 > L7 AND L7 < MINL2.8)) * (ABS((MAXH2.6 < H8 AND H8 > MAXH2.9) OR (MINL2.6 > L8 AND L8 < MINL2.9)) * ((MINL2.6 > L8 AND L8 < MINL2.9) * (-9) * AVGV9.6) - NOT((MAXH2.6 < H8 AND H8 > MAXH2.9) OR (MINL2.6 > L8 AND L8 < MINL2.9)) * (ABS((MAXH2.7 < H9 AND H9 > MAXH2.10) OR (MINL2.7 > L9 AND L9 < MINL2.10)) * ((MINL2.7 > L9 AND L9 < MINL2.10) * (-10) * AVGV10.7) - NOT((MAXH2.7 < H9 AND H9 > MAXH2.10) OR (MINL2.7 > L9 AND L9 < MINL2.10)) * (ABS((MAXH2.8 < H10 AND H10 > MAXH2.11) OR (MINL2.8 > L10 AND L10 < MINL2.11)) * ((MINL2.8 > L10 AND L10 < MINL2.11) * (-11) * AVGV11.8) - NOT((MAXH2.8 < H10 AND H10 > MAXH2.11) OR (MINL2.8 > L10 AND L10 < MINL2.11)) * (ABS((MAXH2.9 < H11 AND H11 > MAXH2.12) OR (MINL2.9 > L11 AND L11 < MINL2.12)) * ((MINL2.9 > L11 AND L11 < MINL2.12) * (-12) * AVGV12.9) - NOT((MAXH2.9 < H11 AND H11 > MAXH2.12) OR (MINL2.9 > L11 AND L11 < MINL2.12)) * (ABS((MAXH2.10 < H12 AND H12 > MAXH2.13) OR (MINL2.10 > L12 AND L12 < MINL2.13)) * ((MINL2.10 > L12 AND L12 < MINL2.13) * (-13) * AVGV13.10) - NOT((MAXH2.10 < H12 AND H12 > MAXH2.13) OR (MINL2.10 > L12 AND L12 < MINL2.13)) * (ABS((MAXH2.11 < H13 AND H13 > MAXH2.14) OR (MINL2.11 > L13 AND L13 < MINL2.14)) * ((MINL2.11 > L13 AND L13 < MINL2.14) * (-14) * AVGV14.11) - NOT((MAXH2.11 < H13 AND H13 > MAXH2.14) OR (MINL2.11 > L13 AND L13 < MINL2.14)) * (ABS((MAXH2.12 < H14 AND H14 > MAXH2.15) OR (MINL2.12 > L14 AND L14 < MINL2.15)) * ((MINL2.12 > L14 AND L14 < MINL2.15) * (-15) * AVGV15.12) - NOT((MAXH2.12 < H14 AND H14 > MAXH2.15) OR (MINL2.12 > L14 AND L14 < MINL2.15)) * (ABS((MAXH2.13 < H15 AND H15 > MAXH2.16) OR (MINL2.13 > L15 AND L15 < MINL2.16)) * ((MINL2.13 > L15 AND L15 < MINL2.16) * (-16) * AVGV16.13) - NOT((MAXH2.13 < H15 AND H15 > MAXH2.16) OR (MINL2.13 > L15 AND L15 < MINL2.16)) * (ABS((MAXH2.14 < H16 AND H16 > MAXH2.17) OR (MINL2.14 > L16 AND L16 < MINL2.17)) * ((MINL2.14 > L16 AND L16 < MINL2.17) * (-17) * AVGV17.14) - NOT((MAXH2.14 < H16 AND H16 > MAXH2.17) OR (MINL2.14 > L16 AND L16 < MINL2.17)) * (ABS((MAXH2.15 < H17 AND H17 > MAXH2.18) OR (MINL2.15 > L17 AND L17 < MINL2.18)) * ((MINL2.15 > L17 AND L17 < MINL2.18) * (-18) * AVGV18.15) - NOT((MAXH2.15 < H17 AND H17 > MAXH2.18) OR (MINL2.15 > L17 AND L17 < MINL2.18)) * (ABS((MAXH2.16 < H18 AND H18 > MAXH2.19) OR (MINL2.16 > L18 AND L18 < MINL2.19)) * ((MINL2.16 > L18 AND L18 < MINL2.19) * (-19) * AVGV19.16) - NOT((MAXH2.16 < H18 AND H18 > MAXH2.19) OR (MINL2.16 > L18 AND L18 < MINL2.19)) * (ABS((MAXH2.17 < H19 AND H19 > MAXH2.20) OR (MINL2.17 > L19 AND L19 < MINL2.20)) * ((MINL2.17 > L19 AND L19 < MINL2.20) * (-20) * AVGV20.17) - NOT((MAXH2.17 < H19 AND H19 > MAXH2.20) OR (MINL2.17 > L19 AND L19 < MINL2.20)) * (ABS((MAXH2.18 < H20 AND H20 > MAXH2.21) OR (MINL2.18 > L20 AND L20 < MINL2.21)) * ((MINL2.18 > L20 AND L20 < MINL2.21) * (-21) * AVGV21.18) - NOT((MAXH2.18 < H20 AND H20 > MAXH2.21) OR (MINL2.18 > L20 AND L20 < MINL2.21)) * (ABS((MAXH2.19 < H21 AND H21 > MAXH2.22) OR (MINL2.19 > L21 AND L21 < MINL2.22)) * ((MINL2.19 > L21 AND L21 < MINL2.22) * (-22) * AVGV22.19))))))))))))))))))))
A Custom PCF Indicator displaying as a negative number the amount of volume since the most recently identified pivot if that pivot is a pivot high could be created using the following settings:
- Plot Style: Histogram
- Plot Color: Red
- Negative Value Color: Unchecked
- Period: 1
- Average Type: Simple
- Formula: ABS((MAXH2.0 < H2 AND H2 > MAXH2.3) OR (MINL2.0 > L2 AND L2 < MINL2.3)) * ((MAXH2.0 < H2 AND H2 > MAXH2.3) * 3 * AVGV3.0) - NOT((MAXH2.0 < H2 AND H2 > MAXH2.3) OR (MINL2.0 > L2 AND L2 < MINL2.3)) * (ABS((MAXH2.1 < H3 AND H3 > MAXH2.4) OR (MINL2.1 > L3 AND L3 < MINL2.4)) * ((MAXH2.1 < H3 AND H3 > MAXH2.4) * 4 * AVGV4.1) - NOT((MAXH2.1 < H3 AND H3 > MAXH2.4) OR (MINL2.1 > L3 AND L3 < MINL2.4)) * (ABS((MAXH2.2 < H4 AND H4 > MAXH2.5) OR (MINL2.2 > L4 AND L4 < MINL2.5)) * ((MAXH2.2 < H4 AND H4 > MAXH2.5) * 5 * AVGV5.2) - NOT((MAXH2.2 < H4 AND H4 > MAXH2.5) OR (MINL2.2 > L4 AND L4 < MINL2.5)) * (ABS((MAXH2.3 < H5 AND H5 > MAXH2.6) OR (MINL2.3 > L5 AND L5 < MINL2.6)) * ((MAXH2.3 < H5 AND H5 > MAXH2.6) * 6 * AVGV6.3) - NOT((MAXH2.3 < H5 AND H5 > MAXH2.6) OR (MINL2.3 > L5 AND L5 < MINL2.6)) * (ABS((MAXH2.4 < H6 AND H6 > MAXH2.7) OR (MINL2.4 > L6 AND L6 < MINL2.7)) * ((MAXH2.4 < H6 AND H6 > MAXH2.7) * 7 * AVGV7.4) - NOT((MAXH2.4 < H6 AND H6 > MAXH2.7) OR (MINL2.4 > L6 AND L6 < MINL2.7)) * (ABS((MAXH2.5 < H7 AND H7 > MAXH2.8) OR (MINL2.5 > L7 AND L7 < MINL2.8)) * ((MAXH2.5 < H7 AND H7 > MAXH2.8) * 8 * AVGV8.5) - NOT((MAXH2.5 < H7 AND H7 > MAXH2.8) OR (MINL2.5 > L7 AND L7 < MINL2.8)) * (ABS((MAXH2.6 < H8 AND H8 > MAXH2.9) OR (MINL2.6 > L8 AND L8 < MINL2.9)) * ((MAXH2.6 < H8 AND H8 > MAXH2.9) * 9 * AVGV9.6) - NOT((MAXH2.6 < H8 AND H8 > MAXH2.9) OR (MINL2.6 > L8 AND L8 < MINL2.9)) * (ABS((MAXH2.7 < H9 AND H9 > MAXH2.10) OR (MINL2.7 > L9 AND L9 < MINL2.10)) * ((MAXH2.7 < H9 AND H9 > MAXH2.10) * 10 * AVGV10.7) - NOT((MAXH2.7 < H9 AND H9 > MAXH2.10) OR (MINL2.7 > L9 AND L9 < MINL2.10)) * (ABS((MAXH2.8 < H10 AND H10 > MAXH2.11) OR (MINL2.8 > L10 AND L10 < MINL2.11)) * ((MAXH2.8 < H10 AND H10 > MAXH2.11) * 11 * AVGV11.8) - NOT((MAXH2.8 < H10 AND H10 > MAXH2.11) OR (MINL2.8 > L10 AND L10 < MINL2.11)) * (ABS((MAXH2.9 < H11 AND H11 > MAXH2.12) OR (MINL2.9 > L11 AND L11 < MINL2.12)) * ((MAXH2.9 < H11 AND H11 > MAXH2.12) * 12 * AVGV12.9) - NOT((MAXH2.9 < H11 AND H11 > MAXH2.12) OR (MINL2.9 > L11 AND L11 < MINL2.12)) * (ABS((MAXH2.10 < H12 AND H12 > MAXH2.13) OR (MINL2.10 > L12 AND L12 < MINL2.13)) * ((MAXH2.10 < H12 AND H12 > MAXH2.13) * 13 * AVGV13.10) - NOT((MAXH2.10 < H12 AND H12 > MAXH2.13) OR (MINL2.10 > L12 AND L12 < MINL2.13)) * (ABS((MAXH2.11 < H13 AND H13 > MAXH2.14) OR (MINL2.11 > L13 AND L13 < MINL2.14)) * ((MAXH2.11 < H13 AND H13 > MAXH2.14) * 14 * AVGV14.11) - NOT((MAXH2.11 < H13 AND H13 > MAXH2.14) OR (MINL2.11 > L13 AND L13 < MINL2.14)) * (ABS((MAXH2.12 < H14 AND H14 > MAXH2.15) OR (MINL2.12 > L14 AND L14 < MINL2.15)) * ((MAXH2.12 < H14 AND H14 > MAXH2.15) * 15 * AVGV15.12) - NOT((MAXH2.12 < H14 AND H14 > MAXH2.15) OR (MINL2.12 > L14 AND L14 < MINL2.15)) * (ABS((MAXH2.13 < H15 AND H15 > MAXH2.16) OR (MINL2.13 > L15 AND L15 < MINL2.16)) * ((MAXH2.13 < H15 AND H15 > MAXH2.16) * 16 * AVGV16.13) - NOT((MAXH2.13 < H15 AND H15 > MAXH2.16) OR (MINL2.13 > L15 AND L15 < MINL2.16)) * (ABS((MAXH2.14 < H16 AND H16 > MAXH2.17) OR (MINL2.14 > L16 AND L16 < MINL2.17)) * ((MAXH2.14 < H16 AND H16 > MAXH2.17) * 17 * AVGV17.14) - NOT((MAXH2.14 < H16 AND H16 > MAXH2.17) OR (MINL2.14 > L16 AND L16 < MINL2.17)) * (ABS((MAXH2.15 < H17 AND H17 > MAXH2.18) OR (MINL2.15 > L17 AND L17 < MINL2.18)) * ((MAXH2.15 < H17 AND H17 > MAXH2.18) * 18 * AVGV18.15) - NOT((MAXH2.15 < H17 AND H17 > MAXH2.18) OR (MINL2.15 > L17 AND L17 < MINL2.18)) * (ABS((MAXH2.16 < H18 AND H18 > MAXH2.19) OR (MINL2.16 > L18 AND L18 < MINL2.19)) * ((MAXH2.16 < H18 AND H18 > MAXH2.19) * 19 * AVGV19.16) - NOT((MAXH2.16 < H18 AND H18 > MAXH2.19) OR (MINL2.16 > L18 AND L18 < MINL2.19)) * (ABS((MAXH2.17 < H19 AND H19 > MAXH2.20) OR (MINL2.17 > L19 AND L19 < MINL2.20)) * ((MAXH2.17 < H19 AND H19 > MAXH2.20) * 20 * AVGV20.17) - NOT((MAXH2.17 < H19 AND H19 > MAXH2.20) OR (MINL2.17 > L19 AND L19 < MINL2.20)) * (ABS((MAXH2.18 < H20 AND H20 > MAXH2.21) OR (MINL2.18 > L20 AND L20 < MINL2.21)) * ((MAXH2.18 < H20 AND H20 > MAXH2.21) * 21 * AVGV21.18) - NOT((MAXH2.18 < H20 AND H20 > MAXH2.21) OR (MINL2.18 > L20 AND L20 < MINL2.21)) * (ABS((MAXH2.19 < H21 AND H21 > MAXH2.22) OR (MINL2.19 > L21 AND L21 < MINL2.22)) * ((MAXH2.19 < H21 AND H21 > MAXH2.22) * 22 * AVGV22.19))))))))))))))))))))
StockFinder is another charting package created by Worden Brothers. Clicking through the hyperlink will bring you to a webpage with more information.
-Bruce
Personal Criteria Formulas
TC2000 Support Articles
|
|
Registered User
Joined: 6/7/2013
Posts: 16
|
Bravo Bruce!!! Bravo!
Great work, it works to an extent. Thankyou very much.
Can i post pictures on here so i can show u whats wrong with it to see if we can iron the probelms out?
Or do u have an e-mail i could contact u on to send u this slide i have identifiying exactly how i want it to look. U see it would be much easier to show u on a diagram.
Cheers Rich!
|
|
Worden Trainer
Joined: 10/7/2004
Posts: 65,138
|
The best topic of which I am aware on posting images in the forums is Inserting A Chart into A Worden post.
-Bruce
Personal Criteria Formulas
TC2000 Support Articles
|
|
Registered User
Joined: 6/7/2013
Posts: 16
|

|
|
Registered User
Joined: 6/7/2013
Posts: 16
|
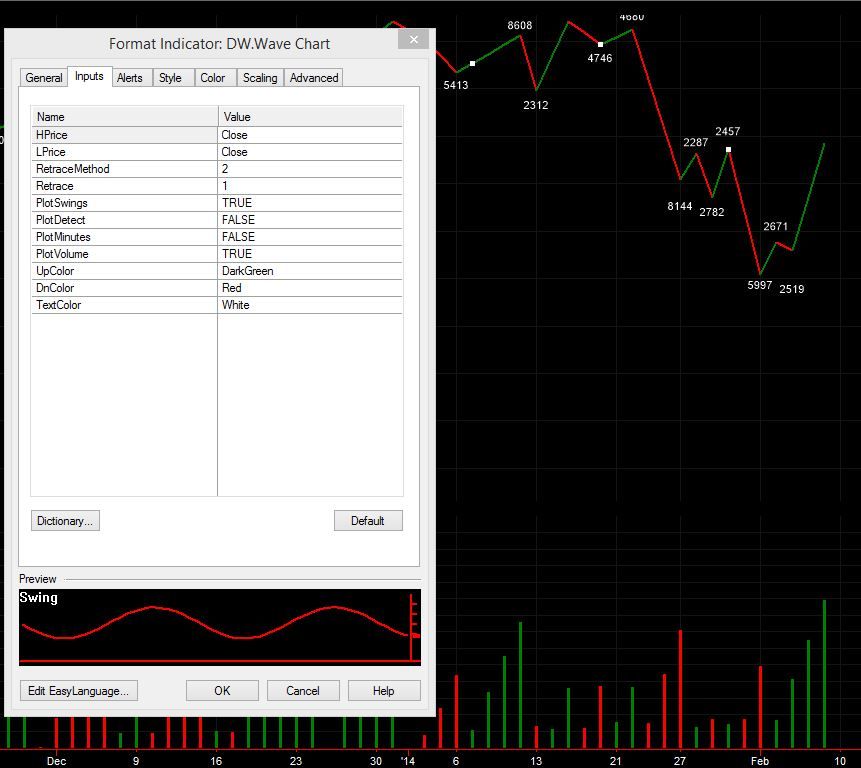
Thats the sort of thing im trying to achive Bruce. What u thinking? Rich!
|
|
Worden Trainer
Joined: 10/7/2004
Posts: 65,138
|
I have a guess as to how it is calculated based on the image and setting names, but could be wrong.
It looks like a Zig Zag Percent indicator which tracks the highest close in an up trend and the lowest close in a down trend. The trend switches directions when the close retreats a certain percentage (I'm guessing 1.5% in this case) from the highest or lowest close in the trend.
Note that the Zig Zag indicator is actually plotted from the highest or lowest close in the trend and not from the point where the change in trend is detected even if it is many bars after the highest or lowest close in the trend.
This means the Zig Zag indicator is "psychic" in that its value at any given point relies on future data and not only data that has happened up until that point. This type of Zig Zag indicator should never be used in backtesting.
It is not possible to implement a Zig Zag indicator in the Personal Criteria Formula Language because there is no way to reference future data in a PCF. This means that if my guess is correct, it is not possible to implement the cumulative wave indicator as pictured in the post either as it relies on the Zig Zag indicator for its calculation.
What we can do is take the technique you proposed and refine it a bit to more closely match what you see in the image.
To do this, we would start by basing the Pivot Highs and Pivot Lows on closing prices alone instead of using the highs and lows of the bars.
We would also reduce the number of qualifying bars after the pivot from 2 to 1 while leaving the number of qualifying before the pivot at 2.
The example starts accumulating volume on the bar after the pivot instead of the bar of the pivot and we can make that change as well.
Finally, we would have both types of waves plotted using positive values. The results won't match, but they might be a bit closer.
With these change, a Custom PCF Indicator displaying the amount of volume since the most recently identified pivot if that pivot is a pivot low could be created using the following settings:
- Plot Style: Histogram
- Plot Color: Green
- Negative Value Color: Unchecked
- Period: 1
- Average Type: Simple
- Formula: ABS((C0 > C1 AND C1 < MINC2.2) OR (C0 < C1 AND C1 > MAXC2.2)) * ((C0 > C1 AND C1 < MINC2.2) * (-1) * V) - NOT((C0 > C1 AND C1 < MINC2.2) OR (C0 < C1 AND C1 > MAXC2.2)) * (ABS((C1 > C2 AND C2 < MINC2.3) OR (C1 < C2 AND C2 > MAXC2.3)) * ((C1 > C2 AND C2 < MINC2.3) * (-2) * AVGV2) - NOT((C1 > C2 AND C2 < MINC2.3) OR (C1 < C2 AND C2 > MAXC2.3)) * (ABS((C2 > C3 AND C3 < MINC2.4) OR (C2 < C3 AND C3 > MAXC2.4)) * ((C2 > C3 AND C3 < MINC2.4) * (-3) * AVGV3) - NOT((C2 > C3 AND C3 < MINC2.4) OR (C2 < C3 AND C3 > MAXC2.4)) * (ABS((C3 > C4 AND C4 < MINC2.5) OR (C3 < C4 AND C4 > MAXC2.5)) * ((C3 > C4 AND C4 < MINC2.5) * (-4) * AVGV4) - NOT((C3 > C4 AND C4 < MINC2.5) OR (C3 < C4 AND C4 > MAXC2.5)) * (ABS((C4 > C5 AND C5 < MINC2.6) OR (C4 < C5 AND C5 > MAXC2.6)) * ((C4 > C5 AND C5 < MINC2.6) * (-5) * AVGV5) - NOT((C4 > C5 AND C5 < MINC2.6) OR (C4 < C5 AND C5 > MAXC2.6)) * (ABS((C5 > C6 AND C6 < MINC2.7) OR (C5 < C6 AND C6 > MAXC2.7)) * ((C5 > C6 AND C6 < MINC2.7) * (-6) * AVGV6) - NOT((C5 > C6 AND C6 < MINC2.7) OR (C5 < C6 AND C6 > MAXC2.7)) * (ABS((C6 > C7 AND C7 < MINC2.8) OR (C6 < C7 AND C7 > MAXC2.8)) * ((C6 > C7 AND C7 < MINC2.8) * (-7) * AVGV7) - NOT((C6 > C7 AND C7 < MINC2.8) OR (C6 < C7 AND C7 > MAXC2.8)) * (ABS((C7 > C8 AND C8 < MINC2.9) OR (C7 < C8 AND C8 > MAXC2.9)) * ((C7 > C8 AND C8 < MINC2.9) * (-8) * AVGV8) - NOT((C7 > C8 AND C8 < MINC2.9) OR (C7 < C8 AND C8 > MAXC2.9)) * (ABS((C8 > C9 AND C9 < MINC2.10) OR (C8 < C9 AND C9 > MAXC2.10)) * ((C8 > C9 AND C9 < MINC2.10) * (-9) * AVGV9) - NOT((C8 > C9 AND C9 < MINC2.10) OR (C8 < C9 AND C9 > MAXC2.10)) * (ABS((C9 > C10 AND C10 < MINC2.11) OR (C9 < C10 AND C10 > MAXC2.11)) * ((C9 > C10 AND C10 < MINC2.11) * (-10) * AVGV10) - NOT((C9 > C10 AND C10 < MINC2.11) OR (C9 < C10 AND C10 > MAXC2.11)) * (ABS((C10 > C11 AND C11 < MINC2.12) OR (C10 < C11 AND C11 > MAXC2.12)) * ((C10 > C11 AND C11 < MINC2.12) * (-11) * AVGV11) - NOT((C10 > C11 AND C11 < MINC2.12) OR (C10 < C11 AND C11 > MAXC2.12)) * (ABS((C11 > C12 AND C12 < MINC2.13) OR (C11 < C12 AND C12 > MAXC2.13)) * ((C11 > C12 AND C12 < MINC2.13) * (-12) * AVGV12) - NOT((C11 > C12 AND C12 < MINC2.13) OR (C11 < C12 AND C12 > MAXC2.13)) * (ABS((C12 > C13 AND C13 < MINC2.14) OR (C12 < C13 AND C13 > MAXC2.14)) * ((C12 > C13 AND C13 < MINC2.14) * (-13) * AVGV13) - NOT((C12 > C13 AND C13 < MINC2.14) OR (C12 < C13 AND C13 > MAXC2.14)) * (ABS((C13 > C14 AND C14 < MINC2.15) OR (C13 < C14 AND C14 > MAXC2.15)) * ((C13 > C14 AND C14 < MINC2.15) * (-14) * AVGV14) - NOT((C13 > C14 AND C14 < MINC2.15) OR (C13 < C14 AND C14 > MAXC2.15)) * (ABS((C14 > C15 AND C15 < MINC2.16) OR (C14 < C15 AND C15 > MAXC2.16)) * ((C14 > C15 AND C15 < MINC2.16) * (-15) * AVGV15) - NOT((C14 > C15 AND C15 < MINC2.16) OR (C14 < C15 AND C15 > MAXC2.16)) * (ABS((C15 > C16 AND C16 < MINC2.17) OR (C15 < C16 AND C16 > MAXC2.17)) * ((C15 > C16 AND C16 < MINC2.17) * (-16) * AVGV16) - NOT((C15 > C16 AND C16 < MINC2.17) OR (C15 < C16 AND C16 > MAXC2.17)) * (ABS((C16 > C17 AND C17 < MINC2.18) OR (C16 < C17 AND C17 > MAXC2.18)) * ((C16 > C17 AND C17 < MINC2.18) * (-17) * AVGV17) - NOT((C16 > C17 AND C17 < MINC2.18) OR (C16 < C17 AND C17 > MAXC2.18)) * (ABS((C17 > C18 AND C18 < MINC2.19) OR (C17 < C18 AND C18 > MAXC2.19)) * ((C17 > C18 AND C18 < MINC2.19) * (-18) * AVGV18) - NOT((C17 > C18 AND C18 < MINC2.19) OR (C17 < C18 AND C18 > MAXC2.19)) * (ABS((C18 > C19 AND C19 < MINC2.20) OR (C18 < C19 AND C19 > MAXC2.20)) * ((C18 > C19 AND C19 < MINC2.20) * (-19) * AVGV19) - NOT((C18 > C19 AND C19 < MINC2.20) OR (C18 < C19 AND C19 > MAXC2.20)) * (ABS((C19 > C20 AND C20 < MINC2.21) OR (C19 < C20 AND C20 > MAXC2.21)) * ((C19 > C20 AND C20 < MINC2.21) * (-20) * AVGV20))))))))))))))))))))
And a Custom PCF Indicator displaying as a negative number the amount of volume since the most recently identified pivot if that pivot is a pivot high could be created using the following settings:
- Plot Style: Histogram
- Plot Color: Red
- Negative Value Color: Unchecked
- Period: 1
- Average Type: Simple
- Formula: ABS((C0 > C1 AND C1 < MINC2.2) OR (C0 < C1 AND C1 > MAXC2.2)) * ((C0 < C1 AND C1 > MAXC2.2) * (-1) * V) - NOT((C0 > C1 AND C1 < MINC2.2) OR (C0 < C1 AND C1 > MAXC2.2)) * (ABS((C1 > C2 AND C2 < MINC2.3) OR (C1 < C2 AND C2 > MAXC2.3)) * ((C1 < C2 AND C2 > MAXC2.3) * (-2) * AVGV2) - NOT((C1 > C2 AND C2 < MINC2.3) OR (C1 < C2 AND C2 > MAXC2.3)) * (ABS((C2 > C3 AND C3 < MINC2.4) OR (C2 < C3 AND C3 > MAXC2.4)) * ((C2 < C3 AND C3 > MAXC2.4) * (-3) * AVGV3) - NOT((C2 > C3 AND C3 < MINC2.4) OR (C2 < C3 AND C3 > MAXC2.4)) * (ABS((C3 > C4 AND C4 < MINC2.5) OR (C3 < C4 AND C4 > MAXC2.5)) * ((C3 < C4 AND C4 > MAXC2.5) * (-4) * AVGV4) - NOT((C3 > C4 AND C4 < MINC2.5) OR (C3 < C4 AND C4 > MAXC2.5)) * (ABS((C4 > C5 AND C5 < MINC2.6) OR (C4 < C5 AND C5 > MAXC2.6)) * ((C4 < C5 AND C5 > MAXC2.6) * (-5) * AVGV5) - NOT((C4 > C5 AND C5 < MINC2.6) OR (C4 < C5 AND C5 > MAXC2.6)) * (ABS((C5 > C6 AND C6 < MINC2.7) OR (C5 < C6 AND C6 > MAXC2.7)) * ((C5 < C6 AND C6 > MAXC2.7) * (-6) * AVGV6) - NOT((C5 > C6 AND C6 < MINC2.7) OR (C5 < C6 AND C6 > MAXC2.7)) * (ABS((C6 > C7 AND C7 < MINC2.8) OR (C6 < C7 AND C7 > MAXC2.8)) * ((C6 < C7 AND C7 > MAXC2.8) * (-7) * AVGV7) - NOT((C6 > C7 AND C7 < MINC2.8) OR (C6 < C7 AND C7 > MAXC2.8)) * (ABS((C7 > C8 AND C8 < MINC2.9) OR (C7 < C8 AND C8 > MAXC2.9)) * ((C7 < C8 AND C8 > MAXC2.9) * (-8) * AVGV8) - NOT((C7 > C8 AND C8 < MINC2.9) OR (C7 < C8 AND C8 > MAXC2.9)) * (ABS((C8 > C9 AND C9 < MINC2.10) OR (C8 < C9 AND C9 > MAXC2.10)) * ((C8 < C9 AND C9 > MAXC2.10) * (-9) * AVGV9) - NOT((C8 > C9 AND C9 < MINC2.10) OR (C8 < C9 AND C9 > MAXC2.10)) * (ABS((C9 > C10 AND C10 < MINC2.11) OR (C9 < C10 AND C10 > MAXC2.11)) * ((C9 < C10 AND C10 > MAXC2.11) * (-10) * AVGV10) - NOT((C9 > C10 AND C10 < MINC2.11) OR (C9 < C10 AND C10 > MAXC2.11)) * (ABS((C10 > C11 AND C11 < MINC2.12) OR (C10 < C11 AND C11 > MAXC2.12)) * ((C10 < C11 AND C11 > MAXC2.12) * (-11) * AVGV11) - NOT((C10 > C11 AND C11 < MINC2.12) OR (C10 < C11 AND C11 > MAXC2.12)) * (ABS((C11 > C12 AND C12 < MINC2.13) OR (C11 < C12 AND C12 > MAXC2.13)) * ((C11 < C12 AND C12 > MAXC2.13) * (-12) * AVGV12) - NOT((C11 > C12 AND C12 < MINC2.13) OR (C11 < C12 AND C12 > MAXC2.13)) * (ABS((C12 > C13 AND C13 < MINC2.14) OR (C12 < C13 AND C13 > MAXC2.14)) * ((C12 < C13 AND C13 > MAXC2.14) * (-13) * AVGV13) - NOT((C12 > C13 AND C13 < MINC2.14) OR (C12 < C13 AND C13 > MAXC2.14)) * (ABS((C13 > C14 AND C14 < MINC2.15) OR (C13 < C14 AND C14 > MAXC2.15)) * ((C13 < C14 AND C14 > MAXC2.15) * (-14) * AVGV14) - NOT((C13 > C14 AND C14 < MINC2.15) OR (C13 < C14 AND C14 > MAXC2.15)) * (ABS((C14 > C15 AND C15 < MINC2.16) OR (C14 < C15 AND C15 > MAXC2.16)) * ((C14 < C15 AND C15 > MAXC2.16) * (-15) * AVGV15) - NOT((C14 > C15 AND C15 < MINC2.16) OR (C14 < C15 AND C15 > MAXC2.16)) * (ABS((C15 > C16 AND C16 < MINC2.17) OR (C15 < C16 AND C16 > MAXC2.17)) * ((C15 < C16 AND C16 > MAXC2.17) * (-16) * AVGV16) - NOT((C15 > C16 AND C16 < MINC2.17) OR (C15 < C16 AND C16 > MAXC2.17)) * (ABS((C16 > C17 AND C17 < MINC2.18) OR (C16 < C17 AND C17 > MAXC2.18)) * ((C16 < C17 AND C17 > MAXC2.18) * (-17) * AVGV17) - NOT((C16 > C17 AND C17 < MINC2.18) OR (C16 < C17 AND C17 > MAXC2.18)) * (ABS((C17 > C18 AND C18 < MINC2.19) OR (C17 < C18 AND C18 > MAXC2.19)) * ((C17 < C18 AND C18 > MAXC2.19) * (-18) * AVGV18) - NOT((C17 > C18 AND C18 < MINC2.19) OR (C17 < C18 AND C18 > MAXC2.19)) * (ABS((C18 > C19 AND C19 < MINC2.20) OR (C18 < C19 AND C19 > MAXC2.20)) * ((C18 < C19 AND C19 > MAXC2.20) * (-19) * AVGV19) - NOT((C18 > C19 AND C19 < MINC2.20) OR (C18 < C19 AND C19 > MAXC2.20)) * (ABS((C19 > C20 AND C20 < MINC2.21) OR (C19 < C20 AND C20 > MAXC2.21)) * ((C19 < C20 AND C20 > MAXC2.21) * (-20) * AVGV20))))))))))))))))))))
-Bruce
Personal Criteria Formulas
TC2000 Support Articles
|
|
Registered User
Joined: 6/7/2013
Posts: 16
|
Bruce,
Can i start by saying, really great work, im very impressed. Thanku for taking the time to help me.
See the image below for a couple of queries.
Cheers Rich!

|
|
Worden Trainer
Joined: 10/7/2004
Posts: 65,138
|
The algorithm used for switching trends is both incredibly simple and very sensitive.
The "pivot high" for example just checks for the close of the pivot bar to be above the closes of the prior two bars and the bar after the pivot bar. So it is very, very sensitive to changing direction. I made it this sensitive because the example did include single bar changes in the direction of the trend. It also allows the volume to start accumulating at the bar after the pivot. Keep in mind that the first bar where you can start displaying the accumulated volume for a trend is the bar where the change in trend can first be identified (even though the change in trend would have happened prior to this).
There is no reasonable way to continue the accumulation if a pivot low happens in an uptrend or a pivot high happens in a downtrend. It will restart the accumulation even though the color of the trend is the same. The reason for this is that any check for the color of the previous bar is just as long as the check for the color of the current bar. Since you would need to make this check at each bar and because the checks are effectively recursive (remember, PCFs can't use variables or looping), the PCF size would increase exponentially.
We can certainly make the change in trend less sensitive. But we can't really make it much more complex or the resulting formula will end up being too long and slow to be practical or post in the forums.
Ideas for simple ways to detect changes in trend involving something other than pivots could be crossovers of price through its moving average or a short moving average through a longer moving average (MACD), Stochastics or a plain (not Wilder's Smoothed) RSI. I really don't know what would work best. The detection method is entirely up to you, but it has to be simple to express in a PCF and relatively efficient to calculate or the technique we are using won't work (the formulas are already long enough as it is).
Your next step would be to experiment with different methods of identifying trends to see which methods come closest to matching your visual interpretation of the chart. Once you have done that, we can see if the method is simple enough to implement as a volume accumulation indicator using a PCF.
-Bruce
Personal Criteria Formulas
TC2000 Support Articles
|
|
Registered User
Joined: 6/7/2013
Posts: 16
|
Hmmm, right ok.
I'll monitor it and see how i get on & get back to you.
Thanks again for ur help Bruce!
Cheers Rich!
|
|
Registered User
Joined: 6/7/2013
Posts: 16
|
Bruce,
Is there a way to make the histogram bars individual bars not joined together with a line at the base of them?
Cheers Rich!
|
|
Worden Trainer
Joined: 10/7/2004
Posts: 65,138
|
I cannot think of a way to do so besides zooming the chart out more.
-Bruce
Personal Criteria Formulas
TC2000 Support Articles
|
|
Registered User
Joined: 6/7/2013
Posts: 16
|
Ok thanks
|
|
Registered User
Joined: 6/7/2013
Posts: 16
|
Bruce,
Is this classed as Divergence, do u know? Your my go to guy now Bruce! :)
Thanks again Rich!

|
|
Worden Trainer
Joined: 10/7/2004
Posts: 65,138
|
I can be your go to guy for some TC2000 related things but not others. The trainers can't give setting, interpretation or investment advice. That said, I have seen both directions described as divergences by customers asking about it in the forums. The only thing consistent between various divergence requests is that the slope of price and the slope of the indicator be in opposite directions.
-Bruce
Personal Criteria Formulas
TC2000 Support Articles
|
|
Registered User
Joined: 6/7/2013
Posts: 16
|
Sweet, niceone Bruce
Thanks Rich!
|
|
Registered User
Joined: 6/7/2013
Posts: 16
|
Hi Bruce,
Hope your well,
So yeah, i've been back testing the indicator yesterday & this morning and am finding it is starting a new cumulative wave when it should'nt in some cases. So say a down wave is in place, 1 upbar will start a new wave on the histogram when it should continue as the price action then continues going down.
Is there anyway round this? Like altering a value so i can just have a play around with it to see what the best settings are? (As in the programme language not the period in the indicator settings). U see I didnt really understand what u wrote yesterday.
Cheers Rich!
|
|
Registered User
Joined: 6/7/2013
Posts: 16
|
Could u say like 2 upbar closes starts a new wave instead of 1 or somthing like that
|
|
Worden Trainer
Joined: 10/7/2004
Posts: 65,138
|
The following require two bars after the pivot instead of one bar after the pivot. Note that this means the display of volume accumulation will be delayed by one bar.
With these change, a Custom PCF Indicator displaying the amount of volume since the most recently identified pivot if that pivot is a pivot low could be created using the following settings:
- Plot Style: Histogram
- Plot Color: Green
- Negative Value Color: Unchecked
- Period: 1
- Average Type: Simple
- Formula: ABS((MAXC2.0 < C2 AND C2 > MAXC2.3) OR (MINC2.0 > C2 AND C2 < MINC2.3)) * ((MINC2.0 > C2 AND C2 < MINC2.3) * (-2) * AVGV2) - NOT((MAXC2.0 < C2 AND C2 > MAXC2.3) OR (MINC2.0 > C2 AND C2 < MINC2.3)) * (ABS((MAXC2.1 < C3 AND C3 > MAXC2.4) OR (MINC2.1 > C3 AND C3 < MINC2.4)) * ((MINC2.1 > C3 AND C3 < MINC2.4) * (-3) * AVGV3) - NOT((MAXC2.1 < C3 AND C3 > MAXC2.4) OR (MINC2.1 > C3 AND C3 < MINC2.4)) * (ABS((MAXC2.2 < C4 AND C4 > MAXC2.5) OR (MINC2.2 > C4 AND C4 < MINC2.5)) * ((MINC2.2 > C4 AND C4 < MINC2.5) * (-4) * AVGV4) - NOT((MAXC2.2 < C4 AND C4 > MAXC2.5) OR (MINC2.2 > C4 AND C4 < MINC2.5)) * (ABS((MAXC2.3 < C5 AND C5 > MAXC2.6) OR (MINC2.3 > C5 AND C5 < MINC2.6)) * ((MINC2.3 > C5 AND C5 < MINC2.6) * (-5) * AVGV5) - NOT((MAXC2.3 < C5 AND C5 > MAXC2.6) OR (MINC2.3 > C5 AND C5 < MINC2.6)) * (ABS((MAXC2.4 < C6 AND C6 > MAXC2.7) OR (MINC2.4 > C6 AND C6 < MINC2.7)) * ((MINC2.4 > C6 AND C6 < MINC2.7) * (-6) * AVGV6) - NOT((MAXC2.4 < C6 AND C6 > MAXC2.7) OR (MINC2.4 > C6 AND C6 < MINC2.7)) * (ABS((MAXC2.5 < C7 AND C7 > MAXC2.8) OR (MINC2.5 > C7 AND C7 < MINC2.8)) * ((MINC2.5 > C7 AND C7 < MINC2.8) * (-7) * AVGV7) - NOT((MAXC2.5 < C7 AND C7 > MAXC2.8) OR (MINC2.5 > C7 AND C7 < MINC2.8)) * (ABS((MAXC2.6 < C8 AND C8 > MAXC2.9) OR (MINC2.6 > C8 AND C8 < MINC2.9)) * ((MINC2.6 > C8 AND C8 < MINC2.9) * (-8) * AVGV8) - NOT((MAXC2.6 < C8 AND C8 > MAXC2.9) OR (MINC2.6 > C8 AND C8 < MINC2.9)) * (ABS((MAXC2.7 < C9 AND C9 > MAXC2.10) OR (MINC2.7 > C9 AND C9 < MINC2.10)) * ((MINC2.7 > C9 AND C9 < MINC2.10) * (-9) * AVGV9) - NOT((MAXC2.7 < C9 AND C9 > MAXC2.10) OR (MINC2.7 > C9 AND C9 < MINC2.10)) * (ABS((MAXC2.8 < C10 AND C10 > MAXC2.11) OR (MINC2.8 > C10 AND C10 < MINC2.11)) * ((MINC2.8 > C10 AND C10 < MINC2.11) * (-10) * AVGV10) - NOT((MAXC2.8 < C10 AND C10 > MAXC2.11) OR (MINC2.8 > C10 AND C10 < MINC2.11)) * (ABS((MAXC2.9 < C11 AND C11 > MAXC2.12) OR (MINC2.9 > C11 AND C11 < MINC2.12)) * ((MINC2.9 > C11 AND C11 < MINC2.12) * (-11) * AVGV11) - NOT((MAXC2.9 < C11 AND C11 > MAXC2.12) OR (MINC2.9 > C11 AND C11 < MINC2.12)) * (ABS((MAXC2.10 < C12 AND C12 > MAXC2.13) OR (MINC2.10 > C12 AND C12 < MINC2.13)) * ((MINC2.10 > C12 AND C12 < MINC2.13) * (-12) * AVGV12) - NOT((MAXC2.10 < C12 AND C12 > MAXC2.13) OR (MINC2.10 > C12 AND C12 < MINC2.13)) * (ABS((MAXC2.11 < C13 AND C13 > MAXC2.14) OR (MINC2.11 > C13 AND C13 < MINC2.14)) * ((MINC2.11 > C13 AND C13 < MINC2.14) * (-13) * AVGV13) - NOT((MAXC2.11 < C13 AND C13 > MAXC2.14) OR (MINC2.11 > C13 AND C13 < MINC2.14)) * (ABS((MAXC2.12 < C14 AND C14 > MAXC2.15) OR (MINC2.12 > C14 AND C14 < MINC2.15)) * ((MINC2.12 > C14 AND C14 < MINC2.15) * (-14) * AVGV14) - NOT((MAXC2.12 < C14 AND C14 > MAXC2.15) OR (MINC2.12 > C14 AND C14 < MINC2.15)) * (ABS((MAXC2.13 < C15 AND C15 > MAXC2.16) OR (MINC2.13 > C15 AND C15 < MINC2.16)) * ((MINC2.13 > C15 AND C15 < MINC2.16) * (-15) * AVGV15) - NOT((MAXC2.13 < C15 AND C15 > MAXC2.16) OR (MINC2.13 > C15 AND C15 < MINC2.16)) * (ABS((MAXC2.14 < C16 AND C16 > MAXC2.17) OR (MINC2.14 > C16 AND C16 < MINC2.17)) * ((MINC2.14 > C16 AND C16 < MINC2.17) * (-16) * AVGV16) - NOT((MAXC2.14 < C16 AND C16 > MAXC2.17) OR (MINC2.14 > C16 AND C16 < MINC2.17)) * (ABS((MAXC2.15 < C17 AND C17 > MAXC2.18) OR (MINC2.15 > C17 AND C17 < MINC2.18)) * ((MINC2.15 > C17 AND C17 < MINC2.18) * (-17) * AVGV17) - NOT((MAXC2.15 < C17 AND C17 > MAXC2.18) OR (MINC2.15 > C17 AND C17 < MINC2.18)) * (ABS((MAXC2.16 < C18 AND C18 > MAXC2.19) OR (MINC2.16 > C18 AND C18 < MINC2.19)) * ((MINC2.16 > C18 AND C18 < MINC2.19) * (-18) * AVGV18) - NOT((MAXC2.16 < C18 AND C18 > MAXC2.19) OR (MINC2.16 > C18 AND C18 < MINC2.19)) * (ABS((MAXC2.17 < C19 AND C19 > MAXC2.20) OR (MINC2.17 > C19 AND C19 < MINC2.20)) * ((MINC2.17 > C19 AND C19 < MINC2.20) * (-19) * AVGV19) - NOT((MAXC2.17 < C19 AND C19 > MAXC2.20) OR (MINC2.17 > C19 AND C19 < MINC2.20)) * (ABS((MAXC2.18 < C20 AND C20 > MAXC2.21) OR (MINC2.18 > C20 AND C20 < MINC2.21)) * ((MINC2.18 > C20 AND C20 < MINC2.21) * (-20) * AVGV20) - NOT((MAXC2.18 < C20 AND C20 > MAXC2.21) OR (MINC2.18 > C20 AND C20 < MINC2.21)) * (ABS((MAXC2.19 < C21 AND C21 > MAXC2.22) OR (MINC2.19 > C21 AND C21 < MINC2.22)) * ((MINC2.19 > C21 AND C21 < MINC2.22) * (-21) * AVGV21))))))))))))))))))))
And a Custom PCF Indicator displaying the amount of volume since the most recently identified pivot if that pivot is a pivot high could be created using the following settings:
- Plot Style: Histogram
- Plot Color: Red
- Negative Value Color: Unchecked
- Period: 1
- Average Type: Simple
- Formula: ABS((MAXC2.0 < C2 AND C2 > MAXC2.3) OR (MINC2.0 > C2 AND C2 < MINC2.3)) * ((MAXC2.0 < C2 AND C2 > MAXC2.3) * (-2) * AVGV2) - NOT((MAXC2.0 < C2 AND C2 > MAXC2.3) OR (MINC2.0 > C2 AND C2 < MINC2.3)) * (ABS((MAXC2.1 < C3 AND C3 > MAXC2.4) OR (MINC2.1 > C3 AND C3 < MINC2.4)) * ((MAXC2.1 < C3 AND C3 > MAXC2.4) * (-3) * AVGV3) - NOT((MAXC2.1 < C3 AND C3 > MAXC2.4) OR (MINC2.1 > C3 AND C3 < MINC2.4)) * (ABS((MAXC2.2 < C4 AND C4 > MAXC2.5) OR (MINC2.2 > C4 AND C4 < MINC2.5)) * ((MAXC2.2 < C4 AND C4 > MAXC2.5) * (-4) * AVGV4) - NOT((MAXC2.2 < C4 AND C4 > MAXC2.5) OR (MINC2.2 > C4 AND C4 < MINC2.5)) * (ABS((MAXC2.3 < C5 AND C5 > MAXC2.6) OR (MINC2.3 > C5 AND C5 < MINC2.6)) * ((MAXC2.3 < C5 AND C5 > MAXC2.6) * (-5) * AVGV5) - NOT((MAXC2.3 < C5 AND C5 > MAXC2.6) OR (MINC2.3 > C5 AND C5 < MINC2.6)) * (ABS((MAXC2.4 < C6 AND C6 > MAXC2.7) OR (MINC2.4 > C6 AND C6 < MINC2.7)) * ((MAXC2.4 < C6 AND C6 > MAXC2.7) * (-6) * AVGV6) - NOT((MAXC2.4 < C6 AND C6 > MAXC2.7) OR (MINC2.4 > C6 AND C6 < MINC2.7)) * (ABS((MAXC2.5 < C7 AND C7 > MAXC2.8) OR (MINC2.5 > C7 AND C7 < MINC2.8)) * ((MAXC2.5 < C7 AND C7 > MAXC2.8) * (-7) * AVGV7) - NOT((MAXC2.5 < C7 AND C7 > MAXC2.8) OR (MINC2.5 > C7 AND C7 < MINC2.8)) * (ABS((MAXC2.6 < C8 AND C8 > MAXC2.9) OR (MINC2.6 > C8 AND C8 < MINC2.9)) * ((MAXC2.6 < C8 AND C8 > MAXC2.9) * (-8) * AVGV8) - NOT((MAXC2.6 < C8 AND C8 > MAXC2.9) OR (MINC2.6 > C8 AND C8 < MINC2.9)) * (ABS((MAXC2.7 < C9 AND C9 > MAXC2.10) OR (MINC2.7 > C9 AND C9 < MINC2.10)) * ((MAXC2.7 < C9 AND C9 > MAXC2.10) * (-9) * AVGV9) - NOT((MAXC2.7 < C9 AND C9 > MAXC2.10) OR (MINC2.7 > C9 AND C9 < MINC2.10)) * (ABS((MAXC2.8 < C10 AND C10 > MAXC2.11) OR (MINC2.8 > C10 AND C10 < MINC2.11)) * ((MAXC2.8 < C10 AND C10 > MAXC2.11) * (-10) * AVGV10) - NOT((MAXC2.8 < C10 AND C10 > MAXC2.11) OR (MINC2.8 > C10 AND C10 < MINC2.11)) * (ABS((MAXC2.9 < C11 AND C11 > MAXC2.12) OR (MINC2.9 > C11 AND C11 < MINC2.12)) * ((MAXC2.9 < C11 AND C11 > MAXC2.12) * (-11) * AVGV11) - NOT((MAXC2.9 < C11 AND C11 > MAXC2.12) OR (MINC2.9 > C11 AND C11 < MINC2.12)) * (ABS((MAXC2.10 < C12 AND C12 > MAXC2.13) OR (MINC2.10 > C12 AND C12 < MINC2.13)) * ((MAXC2.10 < C12 AND C12 > MAXC2.13) * (-12) * AVGV12) - NOT((MAXC2.10 < C12 AND C12 > MAXC2.13) OR (MINC2.10 > C12 AND C12 < MINC2.13)) * (ABS((MAXC2.11 < C13 AND C13 > MAXC2.14) OR (MINC2.11 > C13 AND C13 < MINC2.14)) * ((MAXC2.11 < C13 AND C13 > MAXC2.14) * (-13) * AVGV13) - NOT((MAXC2.11 < C13 AND C13 > MAXC2.14) OR (MINC2.11 > C13 AND C13 < MINC2.14)) * (ABS((MAXC2.12 < C14 AND C14 > MAXC2.15) OR (MINC2.12 > C14 AND C14 < MINC2.15)) * ((MAXC2.12 < C14 AND C14 > MAXC2.15) * (-14) * AVGV14) - NOT((MAXC2.12 < C14 AND C14 > MAXC2.15) OR (MINC2.12 > C14 AND C14 < MINC2.15)) * (ABS((MAXC2.13 < C15 AND C15 > MAXC2.16) OR (MINC2.13 > C15 AND C15 < MINC2.16)) * ((MAXC2.13 < C15 AND C15 > MAXC2.16) * (-15) * AVGV15) - NOT((MAXC2.13 < C15 AND C15 > MAXC2.16) OR (MINC2.13 > C15 AND C15 < MINC2.16)) * (ABS((MAXC2.14 < C16 AND C16 > MAXC2.17) OR (MINC2.14 > C16 AND C16 < MINC2.17)) * ((MAXC2.14 < C16 AND C16 > MAXC2.17) * (-16) * AVGV16) - NOT((MAXC2.14 < C16 AND C16 > MAXC2.17) OR (MINC2.14 > C16 AND C16 < MINC2.17)) * (ABS((MAXC2.15 < C17 AND C17 > MAXC2.18) OR (MINC2.15 > C17 AND C17 < MINC2.18)) * ((MAXC2.15 < C17 AND C17 > MAXC2.18) * (-17) * AVGV17) - NOT((MAXC2.15 < C17 AND C17 > MAXC2.18) OR (MINC2.15 > C17 AND C17 < MINC2.18)) * (ABS((MAXC2.16 < C18 AND C18 > MAXC2.19) OR (MINC2.16 > C18 AND C18 < MINC2.19)) * ((MAXC2.16 < C18 AND C18 > MAXC2.19) * (-18) * AVGV18) - NOT((MAXC2.16 < C18 AND C18 > MAXC2.19) OR (MINC2.16 > C18 AND C18 < MINC2.19)) * (ABS((MAXC2.17 < C19 AND C19 > MAXC2.20) OR (MINC2.17 > C19 AND C19 < MINC2.20)) * ((MAXC2.17 < C19 AND C19 > MAXC2.20) * (-19) * AVGV19) - NOT((MAXC2.17 < C19 AND C19 > MAXC2.20) OR (MINC2.17 > C19 AND C19 < MINC2.20)) * (ABS((MAXC2.18 < C20 AND C20 > MAXC2.21) OR (MINC2.18 > C20 AND C20 < MINC2.21)) * ((MAXC2.18 < C20 AND C20 > MAXC2.21) * (-20) * AVGV20) - NOT((MAXC2.18 < C20 AND C20 > MAXC2.21) OR (MINC2.18 > C20 AND C20 < MINC2.21)) * (ABS((MAXC2.19 < C21 AND C21 > MAXC2.22) OR (MINC2.19 > C21 AND C21 < MINC2.22)) * ((MAXC2.19 < C21 AND C21 > MAXC2.22) * (-21) * AVGV21))))))))))))))))))))
-Bruce
Personal Criteria Formulas
TC2000 Support Articles
|
|
Registered User
Joined: 6/7/2013
Posts: 16
|
Ok thanks Bruce, i will give it a whirl and let u know how i get on.
Cheers Rich!
|
|
Registered User
Joined: 1/30/2005
Posts: 25
|
Hi Stryder,
First I want to compliment Bruce on excellent work.
The Weis wave is based around point and figure charting. Most boxes used are based on a set amount/point of change. The cummulative volume wave is built around David's wave chart. That means it is basically a indicator of an indicator. Below is the example of this thought:
Instead of using the high and low David used the Close. The retrace is the amount in points or dollar figures.
The cummulative wave is figured from the same data which means the reversal is always started one bar after the signal bar.
Hope this helps in your studies.
db
|
|
Registered User
Joined: 6/7/2013
Posts: 16
|
Hi There db,
Yeah Bruce has done some real good work on my request. But I still havent got the indicator working as perfectly as i'd like.
Thanku very much for taking the time to advise me how the Weis Wave works in great deal. I really apprciate it!
Bruce, can u see anything with the information that db has kindly provided that may help us get the indicator more accuate?
Thanks again to all!!
Cheers Rich!
|
|
Worden Trainer
Joined: 10/7/2004
Posts: 65,138
|
There really isn't a way to use point and figure type calculations to determine the changes in direction in TC2000. The formulas would just be too long and slow to be practical or post in the forums (and as you can probably tell from the above, I am not particular shy about creating relatively long formulas).
-Bruce
Personal Criteria Formulas
TC2000 Support Articles
|
|
Registered User
Joined: 1/30/2005
Posts: 25
|
Thanks Stryder,
I will try to explain how I might try and approach this, but may be a little long. Two terms in PF charting: 1. Box size = point or dollar figure to continue column of X's or O's, that would be the Retrace Figure in my last post. 2. Reversal = number of box sizes to form a new column of X's or O's (a price reversal), that would be the Retrace Method.
That is why Bruce said the formula would be long.
Maybe a work around would be to start out with a one box size reversal. For example say we are trading a 10.00 dollar stock and our box size was 0.50 and the Reversal number was one. Assume the stock is in a column of X's, the price would have to change down by at least 0.50 for a reversal. The volume count would begin one bar after this set amount. As long as price did not advance by 0.50 the count would continue. This may keep the formula fairly simple.
This would also mean creation of several price charts for different box sizes or amounts. This is common practice to have to change box size and reversals to study different priced charts in PF. Something else to consider is Dow, Wyckoff, and others only used one box reversals in their studies. The two and three reversals are something not that old.
http://i120.photobucket.com/albums/o173/dblack90/Chartcraft_zps9793f927.jpg
Hope this helps
db
|
|
Registered User
Joined: 1/30/2005
Posts: 25
|
Back again,
Dummy here said multiple charts, but could change the amounts for the box size and use multiple indicators on the same chart to follow what works best with that stock.
db
|
|
Registered User
Joined: 6/7/2013
Posts: 16
|
Hi all,
Ahhh yes i see what u mean db thanks again for the explaination, i'm going to go away and read up more on Point and Figure.
And yeah, i understand Bruce that the formulas will be too long hense not practical at all.
I just want to thank you both for your help on this, its been much appriciated.
Cheers Rich!!
|
|
Registered User
Joined: 1/31/2005
Posts: 7
|
Hi Bruce:
I was reading the thread since I was interested in a Cumulative Wave Indicator as well. I was wondering if adding something like a linear regression component to the PCF you wrote to identify the trend would help limit the indicator flipping to red in an uptrend situation or a green in a downtrend?
On another note, would Worden be able to create a wave volume indicator and include it in their TC2000 platform, maybe it would be easily programmed by one of the Worden programmers if the PCF is unable to work properly.
Thanks for your help.
|
|
Worden Trainer
Joined: 10/7/2004
Posts: 65,138
|
Using a Linear Regression component would also end up making the formula too long and slow to be practical or post in the forums.
I have referenced this topic in the email you submitted with your suggestion to add this a built in indicator to TC2000 to help clarify with the developers exactly what is being attempting.
-Bruce
Personal Criteria Formulas
TC2000 Support Articles
|
|
Registered User
Joined: 1/31/2005
Posts: 7
|
Bruce:
Thank you for your help on this indicator and forwarding the topic to the developers. Maybe with your clout, they will add it in the next update!
Thanks again!
rodche
|
|
Registered User
Joined: 1/30/2005
Posts: 25
|
I haven't visited this thread for a while. There are two detailed readings to grasp the logic for wave volume. The first is : Studies in Tape Reading by Richard D. Wyckoff. The discussion on wave volume starts on page 123 near the bottom. The second is: Trades about to happen by David H Weis. This is very detailed starting on page 127, chapter 9.
One can create a custom custom cumulative indicator like this: up condition c>c1+0.75, down condition c<c1-0.75, value to add/subrtact v.
This leaves the figure amount easy to adjust to the stock and intra day time.
The obvious draw back is the volume count does not change back to 0 for the wave count after the price change.
Hoping if the program team takes this indicator on this will give them some quick reference.
db
|
|
Registered User
Joined: 11/29/2013
Posts: 2
|
Hi, I need to understand the above PCFs, but I have difficulty because I am not familiar with a complex formula such as the one above. For example the following: ABS((C0 > C1 AND C1 < MINC2.2) OR (C0 < C1 AND C1 > MAXC2.2)) * ((C0 > C1 AND C1 < MINC2.2) * (-1) * V) - NOT ((C0 > C1 AND C1 < MINC2.2) OR (C0 < C1 AND C1 > MAXC2.2)) * could you please help there. best regards, aaak
|
|
Worden Trainer
Joined: 10/7/2004
Posts: 65,138
|
The following portion:
ABS((C0 > C1 AND C1 < MINC2.2) OR (C0 < C1 AND C1 > MAXC2.2))
Returns a 1 when the close is above the previous close and the previous close is below the two closes before that or when the Close is below the previous close and the previous close is above the two closes before that and 0 otherwise.
The following portion:
((C0 > C1 AND C1 < MINC2.2) * (-1) * V)
Returns volume when price is above the previous close and the previous close is below the two closes below that and zero otherwise.
The following portion:
NOT ((C0 > C1 AND C1 < MINC2.2) OR (C0 < C1 AND C1 > MAXC2.2))
Returns 1 when the the first bit of formula explained above is not true and 0 when it is true.
So what happens is if the first part is true, it returns the second part and doesn't use any results from the rest of the formula.
But if the first part is false, nothing is returned from the second portion and the third portion then returns the results of the rest of the formula.
The Days Since Last Peak (or other day-counting needs) topic gives a more detailed explanation of how this technique works.
-Bruce
Personal Criteria Formulas
TC2000 Support Articles
|
|
|
Guest-1 |