| bknight |
|
Gold User, Member, TeleChart
|
| Registered User |
|
|
|
|
| Unsure |
|
| Sunday, December 19, 2004 |
| Thursday, August 15, 2013 10:28:50 PM |
415
[0.14% of all post / 0.05 posts per day] |
|
|
As funnymoney said it has been around for awhile. I have a text document that is dated early 2006, but it was probably around before this.
Diceman could you provide a link to the T2105 indicator, I couldn't find it.
QUOTE (ben2k9) I have a few problems with this so-called Hindenberg Omen.
First, no one had EVER even heard of this until 2 weeks ago, now an hour doesn't pass where I don't read about this all over the main stream financial press. I'm sure my dad, who knows zero about investing, is going to call me up to ask me about it.
Secondly, the signal is triggered when a certain number of stocks reach new highs, while a certain number reach new lows. This go around, most of the "stocks" reaching new highs, are actually closed-end fixed income funds. Hardly a stock, per se. Extracting these from the tally, and you don't have the conditions present to trigger the signal.
Third, the name HIndenberg Omen is just so over-the-top..I find it ridiculous. [this third point is more qualitative, I guess you could say]
The market is like a combination lock that changes the code every time. Figuring out what indicators did what in the past can sometimes be useful, but in my experience by the time the code is broken and wise guys try to use it, the market has already changed the combination.
|
|
With the above thoughts how could one write a pcf for MACD 5 days ago be GT MACD 22 days ago with low price 5 days ago LT low 22 days ago? The 5 and 22 are just examples, as I'm really trying to find those divergences from market low to market low and what ever those specific intervals would be.
|
I was cleaning up charts this morning and came upon a custom indicator:
(((STOC13.3 <= 20)) AND ((STOC13.3.1 < STOC13.3)) AND (C <= ( (MAXH15 - MINL30) * .618 + MINL30) AND C >= ((MAXH15 - MINL30) * .382 + MINL30) AND MAXH15 = MAXH30 AND MINL15 > MINL30)) * ((C - MINL30) / ( MINL30 - MAXH15))
There was another with < and > reversed. I can't remember who developed it and what was the expected outcome?
Any help from anyone on this one?
|
|
Well I'm up ony 34% off the bottom, although I started going into cash in Jul (too early). The rally MAY BE BETTER than 2003, but it hasn't even covered 50% of the decline, yet.
|
|
It looks like the earlier days were more negative for the 0 years. Thanks for the extension of the data. Still it doesn't appear that Sir Ten Year Cycle observations don't all hold over a longer time frame.
|
|
Hanging close to those levels, might back and fill for the remainder of the day. These misdirections with no follow through are killing me.
|
|
Nice video, but speak a lot louder next time. My volume was at 100% and I could barely hear you.
|
QUOTE (davidjohnhall) Hi dp,
As the "creator" of the dragon, I must point out that your statement "Dragon pattern is cup and handle pattern" is just a little innacurate. As much as I like people to be right, I must point this out.
First, the "Dragon" is first and foremost a chart layout, nothing more. Second, I use the Dragon layout to find triangles and pennants -- when these patterns are found using a certain layout, they remind me of Chinese parade dragons. Fun for me. Stressful for some aparently.
Triangles and pennants are continuation patterns. Cup and handle patterns are something all together different. While the pennants on some "Dragon" formations can be the right hand side of the cup and handle formation, many times they are not.
As for "hunting the dragons" I do so on a daily basis. You are correct, however, that FNM and FRE do not meet my original criteria -- however -- as the "dragon" is not a pattern, other traders are free to see it and find it where they will. I am not so narrow minded to believe that it can only live on thorugh my eyes.
For your future reference, here are a few classic "Dragons" as I look for them, which can CURRENTLY be found flying around the market.
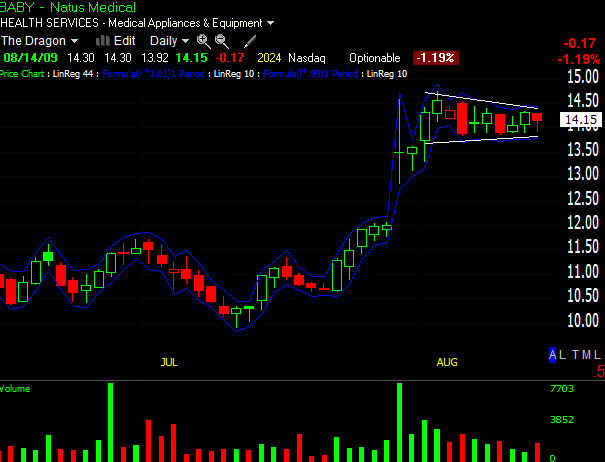
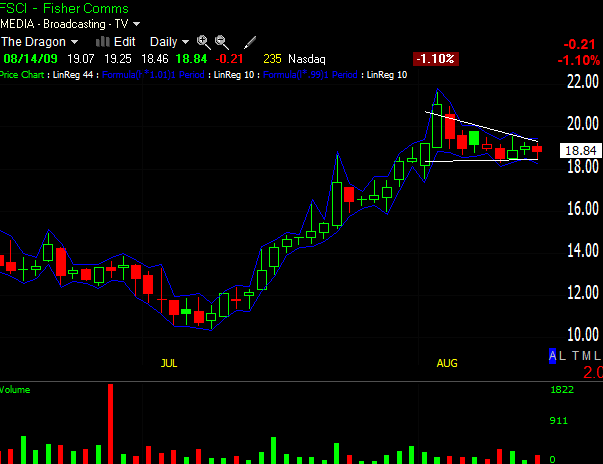
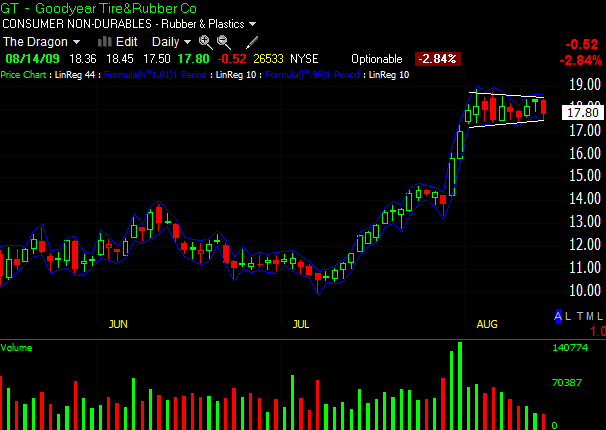
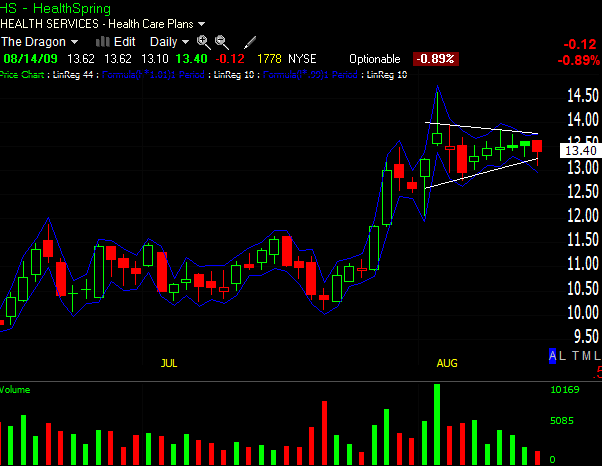
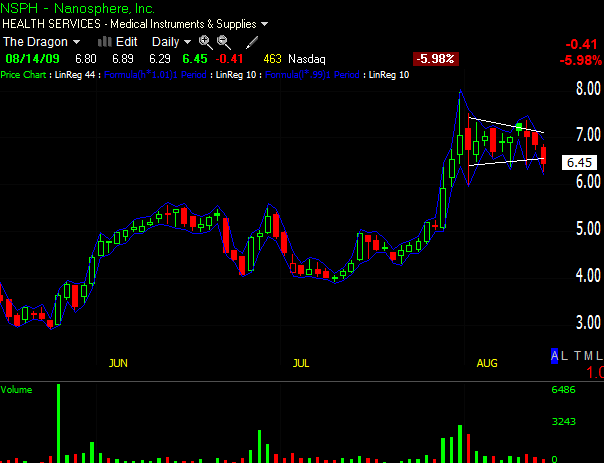
Nice little dragons, aka, triangles, penants, even handle oin cup and handle -- heck -- I don't care what you call them -- to me they are glorious, flame throwing, profit giving Dragons.
David John Hall
I like the first three and maybe the fourth. What characteristics of NSPH seems favorable to you? Looks like it closed towards the bottom of the days trading range and closed ouside the 10 day linear trend line?
|
|
The note of 14 Aug 09 got me to thinking and since I have a database of DJIA closing back to 1928, I thought I would put in a little time and number crunching.
DW:
Sir Ten-Year Cycle brings us a set of observations that are certainly interesting and that could be quite useful. Of course, we all have to discover that for ourselves. You should check the Dow Jones Industrial Average for at least five decades .....
I choose two four decade comparisons since I have 80 years of data. But all the data is visible for you to check. My data began in 1928, so I disregarded 1929 in the comparisons.
Sir Ten Year Cycle:
To follow up on Sir DataMiner's article on cycles, I observe something that has remained uncannily true in my lifetime. It is the behavior of the 10-year cycle.
The behavior can be approximated to a form of the 3 wave cycle model in both directions, (waves 1 & 3 being with the direction of the primary trend, wave 2 being the correction to that), I note them in brackets after each year's comment. With a few months variation, sometimes it goes like this:
YEAR ending in...
0 - Deeply depressing mood disappointments failing economy & businesses, unemployment, etc. (Wave 3 down.)
|
Trade Date
|
Close
|
Prior Close
|
Change
|
Percent Change
|
30's-60's Period Range
|
70's-20's Period Range
|
|
12/31/1930
|
164.58
|
248.48
|
-83.9
|
-33.77%
|
|
|
|
12/31/1940
|
131.13
|
149.99
|
-18.86
|
-12.57%
|
|
|
|
12/29/1950
|
235.42
|
200.52
|
34.9
|
17.40%
|
|
|
|
12/30/1960
|
615.89
|
679.36
|
-63.47
|
-9.34%
|
|
|
|
12/31/1970
|
838.92
|
800.36
|
38.56
|
4.82%
|
|
|
|
12/31/1980
|
963.99
|
838.74
|
125.25
|
14.93%
|
|
|
|
12/31/1990
|
2633.66
|
2753.2
|
-119.54
|
-4.34%
|
3 Declines
|
2 Declines
|
|
12/29/2000
|
10787.99
|
11497.12
|
-709.13
|
-6.17%
|
1 Advances
|
2 Advances
|
|
|
|
|
|
|
-34%-+17%
|
-6%-+15%
|
I don't see a down bias although the first period had more significant declines.
1 - More of the same but worse. (Wave 3 down.)
|
Trade Date
|
Close
|
Prior Close
|
Change
|
Percent Change
|
30's-60's Period Range
|
70's-20's Period Range
|
|
12/31/1931
|
77.90
|
164.58
|
-86.68
|
-52.67%
|
|
|
|
12/31/1941
|
110.96
|
131.13
|
-20.17
|
-15.38%
|
|
|
|
12/31/1951
|
269.23
|
235.42
|
33.81
|
14.36%
|
|
|
|
12/29/1961
|
731.14
|
615.89
|
115.25
|
18.71%
|
|
|
|
12/31/1971
|
890.20
|
838.92
|
51.28
|
6.11%
|
|
|
|
12/31/1981
|
875.00
|
963.99
|
-88.99
|
-9.23%
|
|
|
|
12/31/1991
|
3168.83
|
2633.66
|
535.17
|
20.32%
|
2 Declines
|
2 Declines
|
|
12/31/2001
|
10021.57
|
10787.99
|
-766.42
|
-7.10%
|
2 Advances
|
2 Advances
|
|
|
|
|
|
|
-53%-+19%
|
-9%-+20%
|
I don't see a down bias although the first period had more significant declines.
2 - Amidst a far worse mood, the funds actually bottom out as do prices. However people are badly burned out by the doom & gloom. Few spot it & even fewer trust it. This is the actual market bottom in many assets amid a crisis. (Wave 3 down, turning into Wave 1 up.)
|
Trade Date
|
Close
|
Prior Close
|
Change
|
Percent Change
|
30's-60's Period Range
|
70's-20's Period Range
|
|
12/30/1932
|
60.26
|
77.9
|
-17.64
|
-22.64%
|
|
|
|
12/31/1942
|
119.40
|
110.96
|
8.44
|
7.61%
|
|
|
|
12/31/1952
|
291.90
|
269.23
|
22.67
|
8.42%
|
|
|
|
12/31/1962
|
652.10
|
731.14
|
-79.04
|
-10.81%
|
|
|
|
12/29/1972
|
1020.02
|
890.2
|
129.82
|
14.58%
|
|
|
|
12/31/1982
|
1046.54
|
875
|
171.54
|
19.60%
|
|
|
|
12/31/1992
|
3301.11
|
3168.83
|
132.28
|
4.17%
|
2 Declines
|
1 Declines
|
|
12/31/2002
|
8341.63
|
10021.57
|
-1679.94
|
-16.76%
|
2 Advances
|
3 Advances
|
|
|
|
|
|
|
-23%-+8%
|
-17%-+20%
|
I do see an up bias with some down years.
3 - Quietly recovering. Still lots of distrust & very little "feel-good" around. (Wave 1 up.)
|
Trade Date
|
Close
|
Prior Close
|
Change
|
Percent Change
|
30's-60's Period Range
|
70's-20's Period Range
|
|
12/29/1933
|
98.67
|
60.26
|
38.41
|
63.74%
|
|
|
|
12/31/1943
|
135.89
|
119.4
|
16.49
|
13.81%
|
|
|
|
12/31/1953
|
280.90
|
291.9
|
-11
|
-3.77%
|
|
|
|
12/31/1963
|
762.95
|
652.1
|
110.85
|
17.00%
|
|
|
|
12/31/1973
|
850.86
|
1020.02
|
-169.16
|
-16.58%
|
|
|
|
12/30/1983
|
1258.64
|
1046.54
|
212.1
|
20.27%
|
|
|
|
12/31/1993
|
3754.09
|
3301.11
|
452.98
|
13.72%
|
1 Declines
|
1 Declines
|
|
12/31/2003
|
10453.92
|
8341.63
|
2112.29
|
25.32%
|
3 Advances
|
3 Advances
|
|
|
|
|
|
|
-4%-+64%
|
-17%-+25%
|
An advancing bias for sure.
4 - Have things really been going UP for the past 1 to 2 years? Quick, buy something! (Wave 1 up.)
|
Trade Date
|
Close
|
Prior Close
|
Change
|
Percent Change
|
30's-60's Period Range
|
70's-20's Period Range
|
|
12/31/1934
|
104.04
|
98.67
|
5.37
|
5.44%
|
|
|
|
12/29/1944
|
151.93
|
135.89
|
16.04
|
11.80%
|
|
|
|
12/31/1954
|
404.39
|
280.9
|
123.49
|
43.96%
|
|
|
|
12/31/1964
|
874.13
|
762.95
|
111.18
|
14.57%
|
|
|
|
12/31/1974
|
616.24
|
850.86
|
-234.62
|
-27.57%
|
|
|
|
12/31/1984
|
1211.57
|
1258.64
|
-47.07
|
-3.74%
|
|
|
|
12/30/1994
|
3834.44
|
3754.09
|
80.35
|
2.14%
|
0 Declines
|
2 Declines
|
|
12/31/2004
|
10783.01
|
10453.92
|
329.09
|
3.15%
|
4 Advances
|
2 Advances
|
|
|
|
|
|
|
5%-+44%
|
-28%-+3%
|
An up bias in the early period with a unchanged to slightly downward bias in the later period. If the 70 data were removed this would be an advancing group also.
5 - Amid a modest dip & sometimes mild panic that turns into consolidation. (Wave 2 correction [sideways / up] gives way to the strongest wave--wave 3 up.)
|
Trade Date
|
Close
|
Prior Close
|
Change
|
Percent Change
|
30's-60's Period Range
|
70's-20's Period Range
|
|
12/31/1935
|
144.13
|
104.04
|
40.09
|
38.53%
|
|
|
|
12/31/1945
|
192.91
|
151.93
|
40.98
|
26.97%
|
|
|
|
12/30/1955
|
488.40
|
404.39
|
84.01
|
20.77%
|
|
|
|
12/31/1965
|
969.26
|
874.13
|
95.13
|
10.88%
|
|
|
|
12/31/1975
|
852.41
|
616.24
|
236.17
|
38.32%
|
|
|
|
12/31/1985
|
1546.67
|
1211.57
|
335.1
|
27.66%
|
|
|
|
12/29/1995
|
5117.12
|
3834.44
|
1282.68
|
33.45%
|
0 Declines
|
1 Declines
|
|
12/30/2005
|
10717.50
|
10783.01
|
-65.51
|
-0.61%
|
4 Advances
|
3 Advances
|
|
|
|
|
|
|
11%-+39%
|
-1%-+38%
|
Nice upward bias with only one year slightly negative.
6 - Now things are really getting hot. Prices are rising rapidly. The media is excited, etc. However, the astute observer sees that, under the hood, cracks are beginning to appear. Tops are being built, etc. (Wave 3 up.)
|
Trade Date
|
Close
|
Prior Close
|
Change
|
Percent Change
|
30's-60's Period Range
|
70's-20's Period Range
|
|
12/31/1936
|
179.90
|
144.13
|
35.77
|
24.82%
|
|
|
|
12/31/1946
|
177.20
|
192.91
|
-15.71
|
-8.14%
|
|
|
|
12/31/1956
|
499.47
|
488.4
|
11.07
|
2.27%
|
|
|
|
12/30/1966
|
785.69
|
969.26
|
-183.57
|
-18.94%
|
|
|
|
12/31/1976
|
1004.65
|
852.41
|
152.24
|
17.86%
|
|
|
|
12/31/1986
|
1895.95
|
1546.67
|
349.28
|
22.58%
|
|
|
|
12/31/1996
|
6448.27
|
5117.12
|
1331.15
|
26.01%
|
2 Declines
|
0 Declines
|
|
12/29/2006
|
12463.15
|
10717.5
|
1745.65
|
16.29%
|
2 Advances
|
4 Advances
|
|
|
|
|
|
|
-19%-+25%
|
16%-+26%
|
More advancing years and the later period had all advancers. Since this work doesn't look at individual stocks, one has to look at patterns that developed during the year.
7 - The public thinks things are never going down again, but in mid-year markets top out &, towards the end, give a violent warning of their wrath to come. (Wave 3 up gives way to wave 1 down.)
|
Trade Date
|
Close
|
Prior Close
|
Change
|
Percent Change
|
30's-60's Period Range
|
70's-20's Period Range
|
|
12/31/1937
|
120.85
|
179.9
|
-59.05
|
-32.82%
|
|
|
|
12/31/1947
|
181.16
|
177.2
|
3.96
|
2.23%
|
|
|
|
12/31/1957
|
435.69
|
499.47
|
-63.78
|
-12.77%
|
|
|
|
12/29/1967
|
905.11
|
785.69
|
119.42
|
15.20%
|
|
|
|
12/30/1977
|
831.17
|
1004.65
|
-173.48
|
-17.27%
|
|
|
|
12/31/1987
|
1938.83
|
1895.95
|
42.88
|
2.26%
|
|
|
|
12/31/1997
|
7908.25
|
6448.27
|
1459.98
|
22.64%
|
2 Declines
|
1 Declines
|
|
12/31/2007
|
13264.82
|
12463.15
|
801.67
|
6.43%
|
2 Advances
|
3 Advances
|
|
|
|
|
|
|
-33%-+15%
|
-17%-+23%
|
Statistically neutral to upward, but with recent memory (87 and 2007) markets peaked mid year, 97 rose until mid year and then traded down and up in two cycles.
8 - Armageddon! (Wave 1 down.)
|
Trade Date
|
Close
|
Prior Close
|
Change
|
Percent Change
|
30's-60's Period Range
|
70's-20's Period Range
|
|
12/31/1928
|
300.00
|
|
|
|
|
|
|
12/30/1938
|
154.36
|
120.85
|
33.51
|
27.73%
|
|
|
|
12/31/1948
|
177.30
|
181.16
|
-3.86
|
-2.13%
|
|
|
|
12/31/1958
|
583.65
|
435.69
|
147.96
|
33.96%
|
|
|
|
12/31/1968
|
943.75
|
905.11
|
38.64
|
4.27%
|
|
|
|
12/29/1978
|
805.01
|
831.17
|
-26.16
|
-3.15%
|
|
|
|
12/30/1988
|
2168.57
|
1938.83
|
229.74
|
11.85%
|
|
|
|
12/31/1998
|
9181.43
|
7908.25
|
1273.18
|
16.10%
|
1 Declines
|
2 Declines
|
|
12/31/2008
|
8776.39
|
13264.82
|
-4488.43
|
-33.84%
|
3 Advances
|
2 Advances
|
|
|
|
|
|
|
-2%-+34%
|
-34%-+16%
|
This doesn't look like Armageddon to me, if you take out 2008 this year has an upward bias..
9 - Huge relief bounce that eventually rolls over, setting up for the disappointment of a long winter of years ending in 0, 1 & 2. Media is excited, disaster has been averted, depression / recession, etc. is now over. Buy! Buy! Buy! Supposedly this is the year that markets and the economy are finally coming back. Or is it? (Huge wave 2 correction, turning into wave 3 down. Bigger trend still firmly down.)
|
Trade Date
|
Close
|
Prior Close
|
Change
|
Percent Change
|
30's-60's Period Range
|
70's-20's Period Range
|
|
12/31/1929
|
248.48
|
300
|
-51.52
|
-17.17%
|
|
|
|
12/29/1939
|
149.99
|
154.36
|
-4.37
|
-2.83%
|
|
|
|
12/30/1949
|
200.52
|
177.3
|
23.22
|
13.10%
|
|
|
|
12/31/1959
|
679.36
|
583.65
|
95.71
|
16.40%
|
|
|
|
12/31/1969
|
800.36
|
943.75
|
-143.39
|
-15.19%
|
|
|
|
12/31/1979
|
838.74
|
805.01
|
33.73
|
4.19%
|
|
|
|
12/29/1989
|
2753.20
|
2168.57
|
584.63
|
26.96%
|
|
|
|
12/31/1999
|
11497.12
|
9181.43
|
2315.69
|
25.22%
|
2 Declines
|
0 Declines ?
|
|
8/14/2009
|
9321.40
|
8776.39
|
545.01
|
6.21%
|
2 Advances
|
4 Advances ?
|
|
|
|
|
|
|
-15%-+16%
|
4%-+27%
|
I didn't check whether there was a relief rally during the year, but excluding this year the Dow had an upward bias.
I'm NOT picking at the Sir Ten Year Cycle's observations, just giving the year end numbers allowing you to formulate your own conclusion to the theory.
|
QUOTE (azureflames) It was a GTC order and yes, that one took a profit (wish I could say the same about all my picks yesterday). It was filled at 9:31:20 so it was during market hours. I looked at the ticks on Worden and it never spiked to the $2.83 price. One thing I forgot to mention is that it was filled at $2.66 even though I have a BUY stop at $2.83 (good for me).
The whole thing just seemed weird and the broker did not have a very clear answer. Maybe it was a slip up, these things happen. This just shook me a little in that money management is huge and this kind of has me reeling (even though I got some profit on this one.... who knows about the next).
I heard tobydad mention "conditional buy order" on previous posts. Is there any difference between the aforementioned and a buy stop?
Lots of thanks!!!
Some but not all stop orders are triggered by the bid/ask unless you specifically make it a stop on trade. That has happened to me a couple of times, getting burned each time. So when I'm watchin the maket I have a market order in position and an alert to the trades(not bid/ask) and put it in IF the target is hit.
|
|