Registered User
Joined: 10/7/2004
Posts: 816
|
There appears to be a Dragon/Flag/Pennant developing in FNM and FRE.
Edwards and Magee define it as a consolidating pattern that most often appears in the later and most active stages of a primary advance. They indicate that the pattern can take as little as 5 periods and can take up to 15 periods to complete. They also indicate that these patterns are among the most dependable as to direction and "measuring indications"
Volume probably spiked as the "mast" of the pennant is formed and should diminish as selling drys up.
Their "measuring rule" -"go back to the beginning of that immediately preceeding move, to the point where it broke away from a previous consolidation or reversal formation... a point recognizable as a rule by a quick spurt in activity, and measure from there to the minor reversal level at which the flag or pennant (or dragon) started to form. Then measure the same distance from the point where prices break out from the flag or pennant, and in the same direction."
This is their minimum expectation.
Both Fannie and Freddie had 2 days of strong upside starting 8/5 and then a 1 day reversal. I'm assuming that the mast in these cases could be considered as the distance from the High of the down day on 8/7 to the top of the formation on 8/11.
I've been watching these formations for a number of years and it's not uncommon for a second flag/pennant/dragon to appear after the first reaches its upward expectation - often too far, too fast - so another consolidation. Finally, a third flag(et. al.) could appear - but personally I think that's pushing the luck too far.
Caveat Emptor!!
Regards
Bob Mc
|
|
Registered User
Joined: 12/2/2004
Posts: 1,775
|
Bob, excellent analysis and pattern recognition. IMO trumps every time an overly fancy analysis/chart that's heavily dependent on more indicators than you can shake a stick at:)
|
|
Registered User
Joined: 1/3/2007
Posts: 43
|
Base on other Thread, Dragon pattern is cup and handle pattern. It is hard to find or something, i dont see our members continue track them down any more.
FNM and FRE is not a dragon
|
|

Registered User
Joined: 6/6/2005
Posts: 1,157
|
Hi dp,
As the "creator" of the dragon, I must point out that your statement "Dragon pattern is cup and handle pattern" is just a little innacurate. As much as I like people to be right, I must point this out.
First, the "Dragon" is first and foremost a chart layout, nothing more. Second, I use the Dragon layout to find triangles and pennants -- when these patterns are found using a certain layout, they remind me of Chinese parade dragons. Fun for me. Stressful for some aparently.
Triangles and pennants are continuation patterns. Cup and handle patterns are something all together different. While the pennants on some "Dragon" formations can be the right hand side of the cup and handle formation, many times they are not.
As for "hunting the dragons" I do so on a daily basis. You are correct, however, that FNM and FRE do not meet my original criteria -- however -- as the "dragon" is not a pattern, other traders are free to see it and find it where they will. I am not so narrow minded to believe that it can only live on thorugh my eyes.
For your future reference, here are a few classic "Dragons" as I look for them, which can CURRENTLY be found flying around the market.
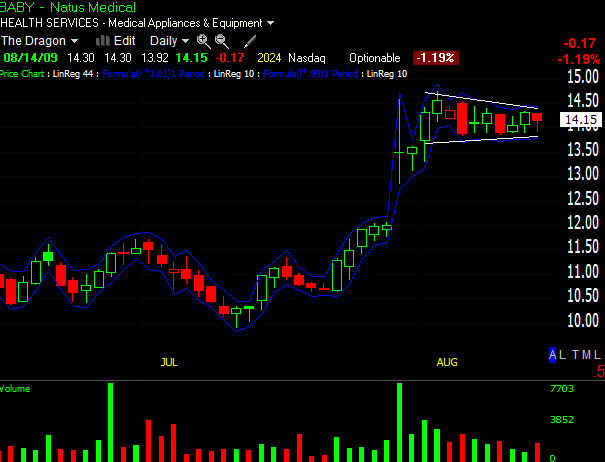
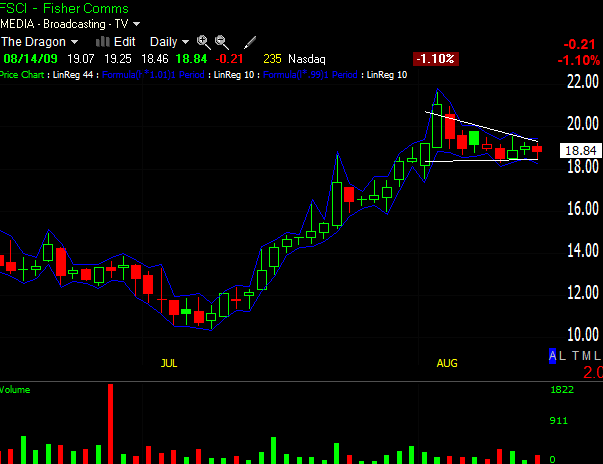
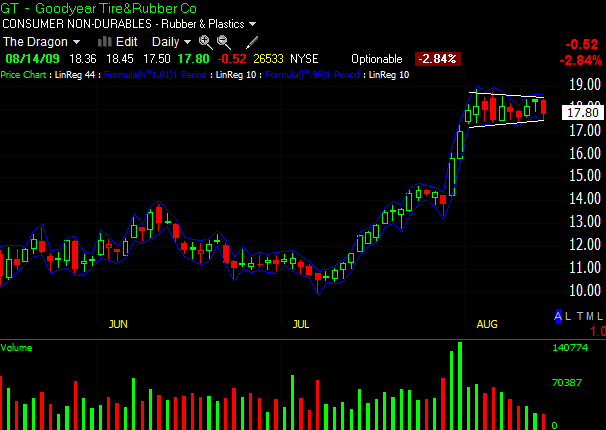
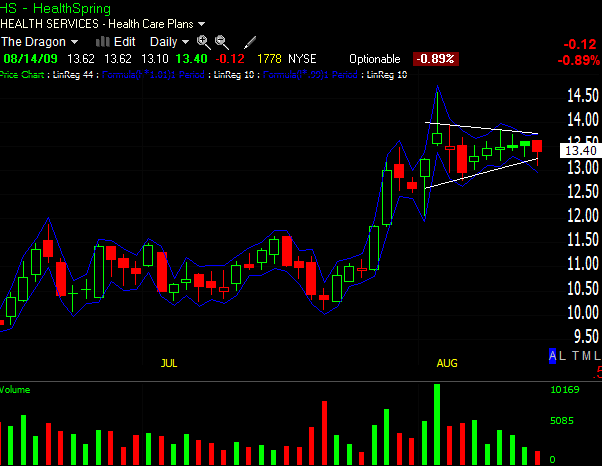
Nice little dragons, aka, triangles, penants, even handle oin cup and handle -- heck -- I don't care what you call them -- to me they are glorious, flame throwing, profit giving Dragons.
David John Hall
|
|
Registered User
Joined: 12/2/2004
Posts: 1,775
|
Davidjohnhall, thanks for the well articulated statement on your dragon method. Since pattern recognition has always been more important to me when finding stocks to play rather than finding stocks via multiple indicator signals, I really enjoy hearing from you and others such as Bob with detailed pattern analysis using strong emphasis on basically volume and price bars.
Even when I mostly agree with someon'e post here I always search for the tiniest tidbit to argue over, always wanting to play the devil's advocate. But I really can't find anything to disagree with in your statement above. In the charts you present (some here and others past) I notice a feature that I always like to point out in my posts, and that's the volume surge on the intial breakout that forms either the pole of the flag or pennant, or the right side of a cup. And then also I like the fact that most of you flags/pennants/handles not only have the proper shape, i.e. not wedging upward, but also have the nice drying up of volume.
Edwards and McGee that Bob references is a classic, and I'm wondering if anyone here has read the technical book that Mr. Worden suggested as a must for all traders in Worden Notes recently, Technical Analysis and Stock Market Profits, The Real Bible of Technical Analysis, by Richard Schacker. A Google Book Search for it offers a nice sample of excerpts and screen shots, seems very high quality.
|
|
Registered User
Joined: 9/22/2005
Posts: 849
|
BobMc
You may be correct in saying that FRE and FNM may be developing a dragon. It is too early to tell. The flag pole is there, but the flag/pennant hasn't had time to develop.
Give them a few more days. They are worth watching.
|
|
Registered User
Joined: 10/7/2004
Posts: 816
|
Personally, I'm watching and waiting
As I said - Caveat Emptor
Regards
Bob Mc
|
|
Registered User
Joined: 12/2/2004
Posts: 1,775
|
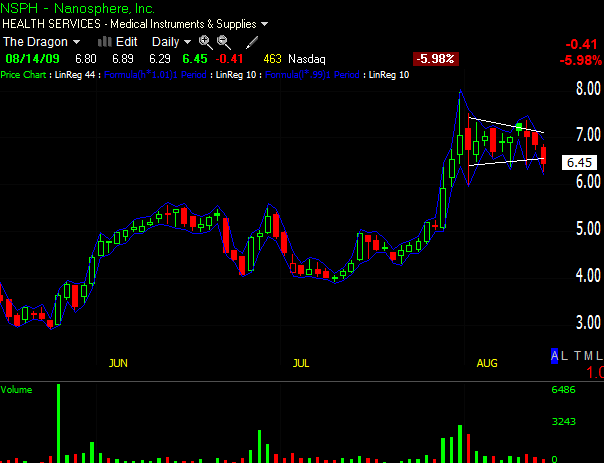
Speaking of dragon patterns, just finished my Sunday scan and came across this stock for first time; I think it might qualify for a dragon? Anyway I like it and will be watching closely this week. It has the four or five main components of a flag pattern I look for...high volume surge forming the pole, the breakout taking out a resistance of some sort (note price conquering with conviction the 200-day ema for first time ever), no upward wedging of flag, tight daily ranges in the flag, and a drying up of volume in the flag. A few indicators seem to confirm the bullish pattern. A negative is relatively nearby overhead resistance from year ago price levels.
|
|
Registered User
Joined: 12/19/2004
Posts: 415
|
QUOTE (davidjohnhall) Hi dp,
As the "creator" of the dragon, I must point out that your statement "Dragon pattern is cup and handle pattern" is just a little innacurate. As much as I like people to be right, I must point this out.
First, the "Dragon" is first and foremost a chart layout, nothing more. Second, I use the Dragon layout to find triangles and pennants -- when these patterns are found using a certain layout, they remind me of Chinese parade dragons. Fun for me. Stressful for some aparently.
Triangles and pennants are continuation patterns. Cup and handle patterns are something all together different. While the pennants on some "Dragon" formations can be the right hand side of the cup and handle formation, many times they are not.
As for "hunting the dragons" I do so on a daily basis. You are correct, however, that FNM and FRE do not meet my original criteria -- however -- as the "dragon" is not a pattern, other traders are free to see it and find it where they will. I am not so narrow minded to believe that it can only live on thorugh my eyes.
For your future reference, here are a few classic "Dragons" as I look for them, which can CURRENTLY be found flying around the market.
Nice little dragons, aka, triangles, penants, even handle oin cup and handle -- heck -- I don't care what you call them -- to me they are glorious, flame throwing, profit giving Dragons.
David John Hall
I like the first three and maybe the fourth. What characteristics of NSPH seems favorable to you? Looks like it closed towards the bottom of the days trading range and closed ouside the 10 day linear trend line?
|
|
Registered User
Joined: 6/6/2005
Posts: 1,157
|
Hi BK,
Thanks for the question.
I like the volume on the run up, the easing volume on the pullback. I don't mind that it close outside the LR, because it hasn't closed outside the low of consolidation area. That's around 6. The linnear regression lines are solely used for finding consolidation areas and are not used in the actual entry or stop/loss level. NSPH is still watchlist candidate here because if it breaks upward it could produce a nice move that's inline with other breaks from consolidation.
Now, when it comes to trade ideas I must mention that I am never in love with any pick that I have posted -- that's just the way I am. Always skeptical -- never trusting and I will drop them at a moments notice if something better comes along. I'm very fickle that way. LOL But for now I like the potential in these.
David John Hall
|
|

Registered User
Joined: 10/7/2004
Posts: 2,181
|
QUOTE (fpetry) Bob, excellent analysis and pattern recognition. IMO trumps every time an overly fancy analysis/chart that's heavily dependent on more indicators than you can shake a stick at:)
fpetry; I am not responding to argue the point, per se, for I am envious of the person that reads a chart so well that they need no indicators. Of course, all indicators are nothing more than representations of price and volume action; they can be nothing else. I look forward to the day that I can look at a chart and not need the tobydad profile (as it has come to be known).
That said, let me point out why I like indicators and why I rely on my setup so heavily. Had I been watching FNM (thanks BobMc for pointing this out to us), I would have been able to capture a sweet 84% climb that spanned about a week beginning on 8/5 and closing out 8/13. (Be glad to enumerate details should interest exist).
Now someone might have caught that without an overly fancy analysis/chart that's heavily dependent on more indicators than you can shake a stick at, but they'd be really, really good to do so. If you can, I'm truly pleased for you. I cannot.
But I can do it with my chart setup...and have many times.
Again, not so much to argue as to help less experienced traders realize that indicators are OK to use, but never forget that they simply depict price and volume action. Use them as the tools (not magic wands) that they are as long as you need them. Just remember what they're there for. And every time you use them, look at what price and volume are telling you through those indicators.
|
|
Registered User
Joined: 10/7/2004
Posts: 2,181
|
A couple of "by the ways", David, thanks for the nice charts, I've added them to the buy watch list.
re: FNM: I see this pulling back to around 0.85. I'll be applying the buy-over-consecutively-lower-highs-of-each-day strategy on this one. I think I'll get my safest yet most aggressive purchase that way. Of course, they'll be conditional orders.
re: FRE: I'm expecting it to pull back to at least 1.10 or so; unless it wants to first close up that gap and drop to 0.98. Then its climb may be even stronger. Same buy strategy.
I think this is a good time for scaling in.
Not investment advice, mind you, just opinion. Caveat Emptor, which is Latin for Your Mileage May Vary.
|
|
Registered User
Joined: 1/12/2009
Posts: 235
|
Tobydayd and DJH, where can I find more information on your particular trading styles? I am interested in the Dragon Scan as well as Todydad's method. Can these two methods be used together. Tobydad, what type of indicators do you use and how do you scan for your stocks. Also, DJH how to you find the dragon set ups. The dragon scans don't seem to be to hard to spot. I mean you can see a dragon setting up in all the provided charts on this thread.
Do to the size of my account, I am more interested in lower priced stocks. 15 and under. Many have advised me not to purchase such low priced stocks as they are very volatile. But it would seem you could make explosive gains in a short amount of time.
Also, how do you guys determine your risk/reward? Do you just wait for a break out from say a consolidating dragon and then purchase? What is your percentage gain before you decide to take profits? Do these set ups work in a bear market, i.e. as in going long against the trend. I'm sure these have worked will in the latest rally. Or do you guys scan these setups and just short them in a bear market? Do fundamentals play a roll in these trades as well, or just purely technical. Sorry for all the questions. Just interested in the styles you guys trade.
|
|
Registered User
Joined: 6/6/2005
Posts: 1,157
|
Hey traderm,
Thanks for the questions. You can find a lot of info on the dragon scan and a lot of examples, including a couple videos I made here:
http://forums.worden.com/Default.aspx?g=posts&t=26559
For risk reward I measure the distance to the bottom of the consolidation area. For my target I look for a measured move of the run up out of the consolidation. After much trading and testing I look for moves of about 10% with a stop of 5% or less. But if you're looking at lower priced stocks you can have much bigger moves but you can also have wider swings to the downside as well. Originally, I used the scan to find larger cap stocks in the russell 1000 because I prefered the lower volatility. Also, these moves are supposed to be swing trades and usually last a few days.
When it comes to bear markets, I don't go short stocks I go long inverse etfs and I trade the same way in those etfs. You can still scan for dragons in bear markets but you won't find many -- and that's one way you can tell the market environment isn't ecxactly choice.
As far as fundamentals go, I can't speak for others, but i ignore them completely and trade solely by the technical set up.
Let me know if you have any other questions.
David John Hall
|
|
Registered User
Joined: 12/2/2004
Posts: 1,775
|
QUOTE (tobydad) [fpetry; I am not responding to argue the point, per se.........
tobydad, excellent reply. I probably was not clear enough with the point I was making. I definitely use indicators, it's just that I've always thought that it was more important for a trader to first get a good grip on basic pattern recognition and then start supplementing with indicators but that's just my opinion. I always use three moving average indicators (20sma, 50/200 ema) as I believe they often act as resistance/support. And I like to use OBV, MS, and BOP to support or contradict what I first note as a bullish pattern. An old quote I've used here before bears repeating, from pro trader Alan Farley: "A good eye is better than a stack of indicators." One good point about having a good feel for chart pattern recognition is that it allows a trader to flip through a watchlist of dozens of stocks very quickly in a matter of a couple of seconds to eliminate weak or sloppy charts. Then go back and look at the stronger patterns and take into consideration what the indicators are signaling. But in the end all that really matters to a trader is whether or not their method is making them money, so for each trader more power to them for any method they come up with that works.
|
|
Registered User
Joined: 10/7/2004
Posts: 2,181
|
Everyone should read and memorize what fpetry has said in the above post. This is so true. My own trading, especially scanning, has improved dramatically after I learned to follow the advice of one of the knights in the nighly submission when he (she?) suggested that one always keep at least one "naked" chart; no indicators, just price and volume. And make it a long range chart, at least a year. It has been amazing what I have seen and the finds I have come across by doing simply this.
Yes, don't make the mistake I did in my early days by ignoring good ol' visual pattern recognition...maybe I wouldn't have lost so much money....:(
|
|
Registered User
Joined: 2/22/2006
Posts: 4
|
I don't disagree with what you say. I look for a ascending triangle at the end before breakout. In the ascending triangle , the price isn't making new highs, and the topmost (resistance) line is horizontal.
Look at OWW today nice dragon breakout
|
|
Registered User
Joined: 12/2/2004
Posts: 1,775
|
AINV, another dragon that's developed since its breakout. Very similar to OWW above ...high volume breakout, lowering volume within maturing pennant, really nice and tight daily ranges past few days. Today it teased a bit in last hour with a volume surge as it closed near day's high.
|
|

Registered User
Joined: 3/21/2006
Posts: 4,308
|
Just a flag of warning (pun intended), Remember in early June that the Dragon threads were very popular and then most of them failed due to the lower swing lows in the Markets. I am just suggesting to use caution.
By the way I do not play devils advocate for argument sake. Davidjohnhall who I respect very much has always said that if a post can make one pause, think and consider then it is a worthy post. We never want to add to much sugar to the mix. That is when the smart money loves to rain on our parrade.... 
|
|
Registered User
Joined: 6/6/2005
Posts: 1,157
|
I think another important thing to discuss here, Apsll, is that all methods fail.
The goal of the trader should not be to find a system that doesn't fail, the goal is to learn as much about a system, learn how much it DOES fail and then trade based on those findings if those findings gell with their own psychology.
To go further into this: on Bulkowski's The Pattern Site he states that the success rate for pennats at reaching their taget -- a measured move of the flagpole -- is 60%. So automatically you can see that this pattern fails 40% of the time. Even more important is determining how much it fails or succeeds for you. It may be more it may be less. I'd suggest having 50-100 live trades of the pattern under your belt.
We can also see from Bulkowski's site that the average gain for this pattern is: 25%. I also know that my stops are never more than 5-10%. From this I can see that I have a greater than 50% chance of gaining twice the amount of money I am risking. To me that is a good trade.
Do we know in advance if many of the pennants are going to fail at this particular moment in time because they failed a couple months ago. No. We cannot. We would only know they are failing if/when they are failing. And we can only trust our research and take our signals.
In the case of one other event giving probability to a similar event happening again this time around -- I would have to say we would need more instances to get a clearer picture. Certainly, they could all fail. Certainly they could all succede. It's much more likely that some will succede, and some will fail.
The best way, in my opinion, to refrain from adding "too much sugar into the mix" is to understand the success/fail ratios for any method/pattern/style of trading and focus on the fail part. Knowing full well that you can fail nearly 50% of the time and that trades are not guaranteed to go in either direction.
Good Luck all.
David John Hall
|
|
Registered User
Joined: 6/6/2005
Posts: 1,157
|
Incidently, I just went back and checked the performace of these 5 stocks and looks like we had 5 winners which is NOT characteristic of the odds.
If you understand that you can flip a coin a hundred times and get an average of 50% heads and 50% tails but that you can also get "streaks" of heads and tails, you'll know why you should never get too happy about winning streaks or too depressed about losing streaks.
What you should do is controll what you can controll -- the size of the positions you take, and the number of stocks that you trade -- and work on managing your emotions.
Hare are the numbers for these trades.
| Symbol |
Post Date |
Current |
$ Change |
% Change |
| baby |
14.15 |
14.65 |
0.5 |
3.53 |
| fsci |
18.84 |
19.84 |
1 |
5.31 |
| gt |
17.8 |
17.97 |
0.17 |
0.96 |
| hs |
13.4 |
14.27 |
0.87 |
6.49 |
| nsph |
6.45 |
6.91 |
0.46 |
7.13 |
| |
|
|
|
23.42 |
| |
|
|
|
4.68 |
Those bottom numbers and the cumulative and average % gain. Not earth shattering but not bad, either.
Anyway, I was just curious how those five fared adn wanted to share the research on this pattern as it happens to the pattern I enjoy trading the most.
David John Hall
|
|
Registered User
Joined: 12/2/2004
Posts: 1,775
|
Dragons still lurk apparently. OREX has a great looking setup imo. For those who like to key off of standard Bollinger Band squeezes (20/20/20), check it out with this stock, it looks like it's primed to pop one way or the other, hopefully up. Five weeks of consolidation with tight daily ranges (compared to loose and sloppy action within previous year) a welcomed rest after move up that started in May. Excellent breakout volume mid July, followed by ideal lower avg. daily volume in the longish flag . Steady insider buying recently, fwiw. Caution, it was recently Cramerized.
|
|
Registered User
Joined: 2/19/2008
Posts: 193
|
Trying to get the hang of this--How does this stock look to you now?
Sail
|
|
 Platinum Customer Platinum Customer
Joined: 4/17/2006
Posts: 271
|
Curious about whether the dragon should ideally have a pointy pennant head or if parallel 10LR downsloping lines will do just as well. If either will do, does the pennant have more spring or potency than a parallel-line head? Thanks.
|
|
Registered User
Joined: 12/2/2004
Posts: 1,775
|
QUOTE (sailnadream) Trying to get the hang of this--How does this stock look to you now?
Sail
OREX or AINV? Anyway, I think both have very similar looking setups that are still looking fine and worth watching. OREX making a little noise premarket, we'll see.
|
|
Registered User
Joined: 2/19/2008
Posts: 193
|
Went in on both and doing well today with OREX
|
|
Registered User
Joined: 6/6/2005
Posts: 1,157
|
Hi Shark,
I like 1 of 2 things -- the pointy head (nicely shaped pennant) or the flat head (nice even consolidation). The other pattern you mentioned would work as that's a bull flag but for whatever reason (i.e. not a scientific or backtested reason) I like the two I mentioned.
Perhapts you could give it a try and let us know how that works. You would just need to sort for a positive slope on the the 44 period linear regression and then a negative slope on the top 10 period linear regression and then a negative slope on the bottom 10 period linear regression.
Good luck and keep us posted!
David John Hall
|
|
Registered User
Joined: 12/2/2004
Posts: 1,775
|
QUOTE (sailnadream) Went in on both and doing well today with OREX
OREX doing well indeed. If it can close today or pretty soon above July high resistance, I think a decent chance that 11 to 12 area will be tested in coming days. Another I've been watching for months off and on is CAST. Chart not quite as dramatic as some others discussed here, but its pattern is germane to this thread I think. I guess the last five weeks would be more of a channel though. After setting up a well defined base past five weeks it gapped up nicely on above avg. volume this morning. No position at the moment.
|
|
|
Guest-1 |