Registered User
Joined: 4/17/2014
Posts: 27
|
Good morning everyone (and Bruce!),
I need to create a basic price movement histogram for watchlist culling - but there's a catch. What I'd like is to have each bar (positive and negative) represent the period's price action expressed as a percent, BUT modify the measurement according to the following criterium:
-
The measurement is from the previous period's close, plus (or minus, for periods that close down) $0.25;
For a couple of my trading edges, I use a Buy Stop that is $0.25 above (for longs) or below (for shorts) the previous day's close. As I run through stocks on my watchlists, I'd like to be able to see at a glance the amount of momentum in the stock so that I can quickly determine whether my targets are likely to be hit. A histogram of each days price action expressed as a percent would easily let me do this, as I could set horizontal lines at various percentage targets (say, 2%, 5%, 7%, etc) and see where the stock falls in terms of daily price movement. Having the histogram 'ignore' the $0.25 of the price action that I won't be participating in due to the Buy Stop gives me a very accurate culling tool (and one that other traders could modify to work with their own entry styles).
I often find that a great looking chart on closer inspection trades with daily momentum (or lack thereof, more accurately) of 0.30% to 0.80% - which is way too low for any edge that I use. Being able to quickly see that the collective price action (positive and negative) on the histogram never come close to the 2% horizontal line from the previous close (ignoring the Buy Stop) would make discarding these stocks a breeze, and be a huge help to me.
As always, I appreciate any help that you wizards can give me!
|
|


Worden Trainer
Joined: 10/7/2004
Posts: 65,138
|
The following is my best guess at what seems to be the intent of what you are describing.
100 * (ABS(C > C1) * (C / (C1 + .25) - 1) + (C < C1) * (C / (C1 - .25) - 1) + (C = C1))
It assumes that you want positive percent changes when price exceeded the .25 net change and negative percent changes when price failed to get a .25 net change. It returns -100 when C = C1. Eliminating the + (C = C1) term would make it return 0 in such cases instead.
-Bruce
Personal Criteria Formulas
TC2000 Support Articles
|
|
Registered User
Joined: 4/17/2014
Posts: 27
|
Probably my fault in how I described it Bruce; let me try another way.
For the positive bars I need to see the percent gain from the previous close, plus $0.25, to the last print. For the negative bars I need to see the percent loss from the previous close, minus $0.25, to the last print. So here's an example:
Stock ABC has a previous close of $10. The current session closes at $11. The precent difference between the two would be +10% (a green bar on the histogram that would touch a horizontal line set to 10). However because I use a Buy Stop that's +$0.25 above the previous close, the percent increase between that Buy Stop ($10.25) and the end of the current session ($11) is actually only 7.3%.
For a short, using a reverse of the above example, stock ABC has a previous close of $10. The current session closes at $9. The precent difference between the two would be -10% (a red bar on the histogram that would touch a horizontal line set to -10). However because I use a Buy Stop that's -$0.25 below the previous close for shorts, the percent decrease between that Buy Stop ($9.75) and the end of the current session ($9) is actually 7.7%.
So it's the positive or negative percent change between the buy stop (previous close +$0.25/-$0.25) and the current price (laast print) that I'm trying to see.
Is that clearer? Apologies for the earlier confusion; I could have phrased it better I see now.
Thank you Bruce.
|
|
Worden Trainer
Joined: 10/7/2004
Posts: 65,138
|
That should be essentially what it already does.
It does two things which might be considered odd in an attempt to make the results more useful.
When price is down, it returns a positive percent change when price is more than $0.25 below the previous close and a negative percent change when price is more than $0.25 below the previous close.
It returns -100% when the net change is 0 in order to differentiate from cases where price is up or down by exactly $0.25.
So you don't know if price is up or down, but you do know if price exceeded the $0.25 stop as long as the percentage returned is greater than 0.
Eliminating these changes would result in the following formula.
100 * (ABS(C > C1) * (C / (C1 + .25) - 1) - (C < C1) * (C / (C1 - .25) - 1))
The problem with this formula is that while it does return the desired percent changes, you do not now know if -2% means price was down and was 2% below the previous close minus $0.25 or if price was up but was 2% below previous close plus $0.25.
You would need to have two different formulas in this case if you really wanted to tell the difference. You would probably lot them in the same pane in different colors. The +$0.25 formula would be as follows.
100 * ABS(C > C1) * (C / (C1 + .25) - 1)
And the -$0.25 formula would be as follows.
100 * ABS(C < C1) * (C / (C1 - .25) - 1)
-Bruce
Personal Criteria Formulas
TC2000 Support Articles
|
|
Registered User
Joined: 4/17/2014
Posts: 27
|
This is kicking out incorrect results for what I'm looking for... I created an image showing the discrepancies, but I can't see how to upload it here. It seems to be unable to tell whether it should calculate up or down based on the previous candle (because we haven't given it those instructions yet), and I'm getting strange percentage calculations...
Maybe an iteration of an indicator you wrote for me previously might work:
100 * (ABS(C < O AND C1 < O1 AND L <= L1 - .25 AND O > L1 - .63) * (L / ((L1 + O - .26 - ABS(L1 - O - .24)) / 2) - 1) - (C > O AND C1 > O1 AND H >= H1 + .25 AND O < H1 + .63) * (H / ((H1 + O + .26 + ABS(H1 - O + .24)) / 2) - 1))
This one worked well for me because it triggers only in a bracketed order, and ignores circumstances that fall outside the conditions of the bracket or candle pattern (+$0.25 buy stop and +$0.63 limit from the previous high for longs, and -$0.25 buy stop and -$0.63 limit from the previous low for shorts, and bullish positive and negative candles that open above or below the previous close as the case may be).
If this was modified as follows:
-
To calculate from the previous close, rather than the highs or lows;
-
To ignore candle conditions beyond the following:
-
If the current price has O < C, then it should calculate from the previous close +$0.25; if the current price has O > C, then it should calculate from the previous close -$0.25. As with the indicator above, it ignores circumstances where price did not fall between the bracket order (because those orders would not have filled).
Do you think that this might better accomplish what I'm looking for Bruce? I guess what I'm trying to get here is a daily run gain histogram that triggers only within my parameters (candles whose price does not meet the criteria by which I submit my ordeers are ignored).
Sorry for the headache Bruce. I REALLY appreciate the effort.
|
|
Worden Trainer
Joined: 10/7/2004
Posts: 65,138
|
The best topic of which I am aware on posting images in the forums is Inserting A Chart into A Worden post.
You rather specifically indicated the percent change is from the previous close so I assumed that the determination of if the bar was up or down was from the previous close and not from the open.
The following only checks for the close to be above or below the open as I don't know the specific circumstances in which you would actually buy.
100 * (ABS(C < O) * (C / (C1 - .25) - 1) - (C > O) * (C / (C1 + .25) - 1))
-Bruce
Personal Criteria Formulas
TC2000 Support Articles
|
|
Registered User
Joined: 4/17/2014
Posts: 27
|
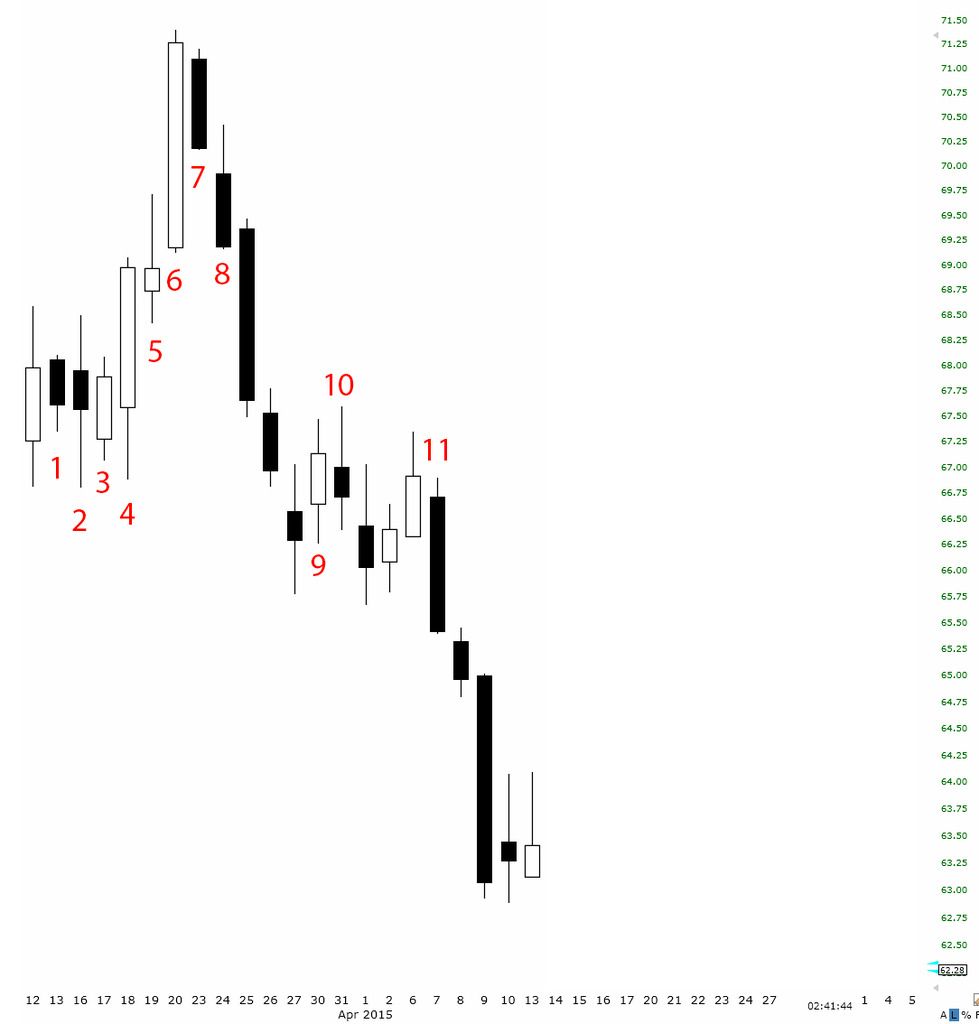
Okay let me try a picture instead. Please bear with me; I'll walk through each candle in this example to show you what I'm looking for (and really, I'm sorry I don't speak PCF, because this is probably not that difficult, and I'm giving you a headache needlessly...):
-
The previous candle is white, so this will calculate % change from the previous candle's close +$0.25 to this candle's high. No portion of the current candle falls within that range, so this bar would not be shown.
-
The previous candle is black, so this will calculate % change from the previous close -$0.25 to this candle's low. The previous close was 67.82 - 0.25 = 67.37. The low for this candle is 66.80, which is -0.84% below 67.37 - this bar would be red, at -0.84% (I won't do the math with all of them).
-
The previous candle is black, so this will calculate % change from the previous close -$0.25 to this candle's low. The % change is -0.44% - this bar would be red, at -0.44%.
-
The previous candle is white, so this will calculate % change from the previous close +$0.25 to this candle's high. The % change is +1.37% - this bar would be green, at +1.37%.
-
The previous candle is white, so this will calculate % change from the previous close +$0.25 to this candle's high. The % change is +0.70% - this bar would be green, at +0.70%.
-
The previous candle is white, so this will calculate % change from the previous close +$0.25 to this candle's high. The % change is +3.14% - this bar would be green, at +3.14%.
-
The previous candle is white, so this will calculate % change from the previous close +$0.25 to this candle's high. No portion of the current candle falls within that range, so this bar would not be shown.
-
The previous candle is black, so this will calculate % change from the previous close -$0.25 to this candle's low. The % change is -1.11% - this bar would be red, at -1.11%.
-
The previous candle is black, so this will calculate % change from the previous close -$0.25 to this candle's high. No portion of the current candle falls within that range, so this bar would not be shown.
-
The previous candle is white, so this will calculate % change from the previous close +$0.25 to this candle's high. The % change is +0.31% - this bar would be green, at +0.31%.
Hopefully this illustration plus my walk-through does a better job explaining what I'm looking for. You're probably shaking your head and thinking "Yeah...well that's totally not what you asked for..." and if that's so then I apologize. Thankfully my Photoshop skills are better than my PCF skills (which as you can see are non-existant), and might do the trick for us.
Thanks again for all the help Bruce. Let me know if this makes sense this time.
|
|
Registered User
Joined: 4/17/2014
Posts: 27
|
QUOTE (RyanP)
8. The previous candle is black, so this will calculate % change from the previous close -$0.25 to this candle's high. No portion of the current candle falls within that range, so this bar would not be shown.
This should be "previous close -$0.25 to this candle's low", not "high", obviously. Low to low, high to high.
Sorry.
|
|
Registered User
Joined: 4/17/2014
Posts: 27
|
#9, not #8. Lord help me...
|
|
Worden Trainer
Joined: 10/7/2004
Posts: 65,138
|
Please try a Custom PCF Indicator with the following settings.
- Plot Style: Histogram.
- Plot Color: Green
- Negative Value Color: Checked / Red
- Period: 1
- Formula: 100 * (ABS(C1 > O1 AND H > C1 + .25) * (H / (C1 + .25) - 1) - (C1 < O1 AND L < C1 - .25) * (L / (C1 - .25) - 1))
When I ran it against SUI, all of the results seemed to be +/-0.01 when compared to your calculations.
-Bruce
Personal Criteria Formulas
TC2000 Support Articles
|
|
Registered User
Joined: 4/17/2014
Posts: 27
|
Bruce Bruce Bruce.... You've done it again. I swear, whenever I finally explain what I am looking for in a way that's not toally confusing, you deliver every time!
THANK YOU.
No joke, I would pay twice as much for my Platinum subscription just to be able to ask you for help once every 4 months. Absolutely brilliant.
Have a great weekend Bruce!
And for any other traders following this thread, try this indicator out as a down-and-dirty, at-a-glance target gain visualizer. Set your horizontal lines at +/- whatever thresholds you like, and it will very quickly how often your pick hits those targets when it's in motion.
|
|
Worden Trainer
Joined: 10/7/2004
Posts: 65,138
|
You're welcome.
-Bruce
Personal Criteria Formulas
TC2000 Support Articles
|
|
|
Guest-1 |