| RyanP |
|
Member, Platinum User, TeleChart
|
| Registered User |
|
|
|
|
| Gender: |
|
| Thursday, April 17, 2014 |
| Wednesday, June 6, 2018 8:53:39 AM |
27
[0.01% of all post / 0.01 posts per day] |
|
|
SO sorry Bruce; this is what comes from not really being able to read this stuff... Feel free to dunce-hat me.
And again, MANY thanks!
|
|
Oh crap; just noticed you missed a few key points. I need:
-
Price is greater than the previous 40 periods;
-
Current candle and 1 previous candle are white;
-
No gap between current candle and 1 previous candle;
-
Price is currently in the top 10% of the current candle
All these to be true. So NO gap, prive > than the previous 40 (you've given me that), current and previous are C >O, and current price is within the top 10% of the current candle's body (I saw this one in the webinar from last week).
Really appeaciate the help Bruce!
|
|
Thank you as always Bruce; you are awesome!
|
|
Good morning Bruce/other gurus,
I need some help with an easy PCF for a scan I'm building. The criteria I'd like to include are:
-
Price is greater than the previous 40 periods;
-
Current candle and 1 previous candle are white;
-
No gap between current candle and 1 previous candle;
-
Price is currently in the top 10% of the current candle
You guys are all invaluable assets to the trading community, and I am grateful for any assistance you can give to me here!
Thanks!
|
|
MANY thanks Bruce. As always, your wizardry is deeply appreciated!
|
|
Good morning Bruce (and everyone else),
Sorry about the obnoxious title, but I figured if it was catchy I'd get more eyes on it... :)
I'm trying to figure out how to write a PCF for a scan for finding stocks that have wide swings in price, several sessions in a row. So for example, a stock that moves >3% each session (up or down, I don't care), for X sessions in a row.
What I'm looking for are stocks that offer reasonable movement every day (or say, every day for a week), rather than just a single day. The problem with most of the scans I've seen which look for percent gains is they pull up a bunch of stocks with good price action in ONE session - but that is more often that not an anomaly for that particular stock.
If I can run a scan with variables for both the movement I'm looking for (X% up OR down), and the number of consecutive sessions, then I would think I'd get a good selection of viable intraday candidates which could then be culled further. The scan could also be modified by traders who use shorter timeframes than daily to find candidates for edges that require intraday swings.
I hope that makes sense; as always thanks in advance for any guidance anyone can provide!
|
|
Bruce Bruce Bruce.... You've done it again. I swear, whenever I finally explain what I am looking for in a way that's not toally confusing, you deliver every time!
THANK YOU.
No joke, I would pay twice as much for my Platinum subscription just to be able to ask you for help once every 4 months. Absolutely brilliant.
Have a great weekend Bruce!
And for any other traders following this thread, try this indicator out as a down-and-dirty, at-a-glance target gain visualizer. Set your horizontal lines at +/- whatever thresholds you like, and it will very quickly how often your pick hits those targets when it's in motion.
|
|
#9, not #8. Lord help me...
|
|
QUOTE (RyanP)
8. The previous candle is black, so this will calculate % change from the previous close -$0.25 to this candle's high. No portion of the current candle falls within that range, so this bar would not be shown.
This should be "previous close -$0.25 to this candle's low", not "high", obviously. Low to low, high to high.
Sorry.
|
|
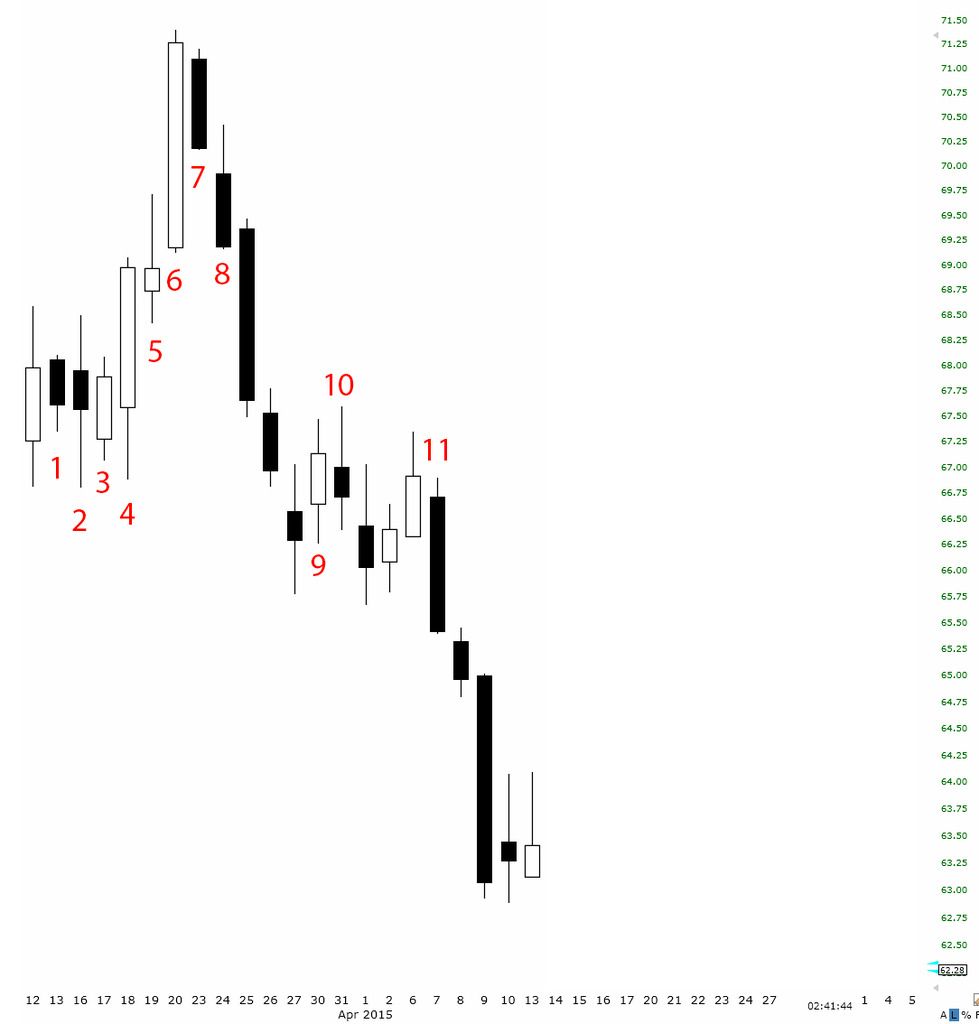
Okay let me try a picture instead. Please bear with me; I'll walk through each candle in this example to show you what I'm looking for (and really, I'm sorry I don't speak PCF, because this is probably not that difficult, and I'm giving you a headache needlessly...):
-
The previous candle is white, so this will calculate % change from the previous candle's close +$0.25 to this candle's high. No portion of the current candle falls within that range, so this bar would not be shown.
-
The previous candle is black, so this will calculate % change from the previous close -$0.25 to this candle's low. The previous close was 67.82 - 0.25 = 67.37. The low for this candle is 66.80, which is -0.84% below 67.37 - this bar would be red, at -0.84% (I won't do the math with all of them).
-
The previous candle is black, so this will calculate % change from the previous close -$0.25 to this candle's low. The % change is -0.44% - this bar would be red, at -0.44%.
-
The previous candle is white, so this will calculate % change from the previous close +$0.25 to this candle's high. The % change is +1.37% - this bar would be green, at +1.37%.
-
The previous candle is white, so this will calculate % change from the previous close +$0.25 to this candle's high. The % change is +0.70% - this bar would be green, at +0.70%.
-
The previous candle is white, so this will calculate % change from the previous close +$0.25 to this candle's high. The % change is +3.14% - this bar would be green, at +3.14%.
-
The previous candle is white, so this will calculate % change from the previous close +$0.25 to this candle's high. No portion of the current candle falls within that range, so this bar would not be shown.
-
The previous candle is black, so this will calculate % change from the previous close -$0.25 to this candle's low. The % change is -1.11% - this bar would be red, at -1.11%.
-
The previous candle is black, so this will calculate % change from the previous close -$0.25 to this candle's high. No portion of the current candle falls within that range, so this bar would not be shown.
-
The previous candle is white, so this will calculate % change from the previous close +$0.25 to this candle's high. The % change is +0.31% - this bar would be green, at +0.31%.
Hopefully this illustration plus my walk-through does a better job explaining what I'm looking for. You're probably shaking your head and thinking "Yeah...well that's totally not what you asked for..." and if that's so then I apologize. Thankfully my Photoshop skills are better than my PCF skills (which as you can see are non-existant), and might do the trick for us.
Thanks again for all the help Bruce. Let me know if this makes sense this time.
|
|