| Welcome Guest, please sign in to participate in a discussion. | Search | Active Topics | |
Registered User
Joined: 3/10/2012
Posts: 465
|
Hi Bruce
Can u please create two seperate scans for finding resistance and finding Support for the current price as seen in past using Ichimoku Baseline and Lead Span B,
What i want is to find lead span B and Base line most flat as possible in past from where the current price is trading, and it should work in all time frames as desired setting
For easy understanding if u can go to chart of VRSN on monthly time frame where u see the Lead SPAN B and BASE LINE both have resistance showing on $109.15 and $131
I need same for going bearish side
As usual your super brain will figure this out in no time
Regards
Dhiren Shah
|
|


Worden Trainer
Joined: 10/7/2004
Posts: 65,138
|
I really can't figure out a reasonable way to do this in TC2000.
-Bruce
Personal Criteria Formulas
TC2000 Support Articles
|
|
Registered User
Joined: 3/10/2012
Posts: 465
|
Okay Bruce not a problem ,
But is there a way you can write a PCF, where the Lead SPAN B and BASE line has moved not more then 1 % up or down in its own calculations within X amount of period in past lets say 200 bars or 400 bars ??
That might also help ?
And how do i attach a image of chart for better explaination in this Chat ?? where is the attachment button
|
|
Worden Trainer
Joined: 10/7/2004
Posts: 65,138
|
The best topic of which I'm aware on how to post images in the forums is Inserting A Chart into A Worden post.
A Condition Formula checking for Leading Span B being within 1% of its value 1 bar ago could be written as follows.
ABS((MAXH52.26 + MINL52.26) / (MAXH52.27 + MINL52.27) - 1) <= .01
A Condition Formula checking for Base Line being within 1% of its value 1 bar ago could be written as follows.
ABS((MAXH26 + MINL26) / (MAXH26.1 + MINL26.1) - 1) <= .01
You could check for the percentage of the time one of these was true by using it as the Boolean Formula in a Custom PCF % True Indicator. You would set the period to the number of bars of interest and the Average Type to Simple.
Checking for either or both to have stayed within a particular range over X bars would be far more complicated as the MIN() and MAX() functions cannot be applied to formulas for Leading Span B or the Base Line.
You could use the technique described in the Min Max PCFs topic to calculate the min and max over 32 bars or less, but the formula would probably become impractical with far fewer than 32 bars.
-Bruce
Personal Criteria Formulas
TC2000 Support Articles
|
|
Registered User
Joined: 3/10/2012
Posts: 465
|
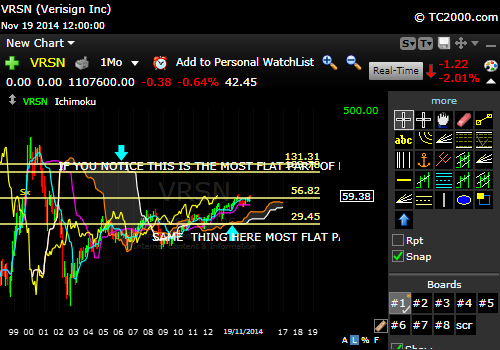
BRUCE
I tried your formula but it still doesn't give me my desired result so here i have attached the images of chart VRSN AND YAHOO on monthly timeframe because its easy to see the LEAD SPAN B AND BASE LINE FLAT FOR LONG period and are almost insync to eachother i have highlighted with the drawing for better understanding..
So this is what i want to work in all timeframes , the basic idea behind this is LEAD SPAN B AND BASELINE being flat for long time on a given chart represents that the price has a strong support or resistance above or below the current trading bar.
Will this make your Super Brain work the magic ????
Cheers
|
|
Worden Trainer
Joined: 10/7/2004
Posts: 65,138
|
That, as stated in my first response, is not something I have figured out a reasonable way to do.
We could check for Leading Span B being completely flat from one bar to the next at the point where price has most recently stopped plotting.
MAXH52.26 + MINL52.26 = MAXH52.27 + MINL52.27
And for the Base Line being completely flat from one bar to the next at the point where price has most recently stopped plotting.
MAXH26 + MINL26 = MAXH26.1 + MINL26.1
And we can use the formulas in a Custom PCF % True Indicator with the Period set to the minimum number of bars in a row of interest and the Average Type to Simple to check for it being flat a certain numbers of bars in a row. We can do this because the Custom PCF % True Indicator would return 100% if and only if it was true for all of the most recent bars in the Period.
We could even add a 1-period simple moving average with an offset to this to check for this happening Offset bars in the past instead of for the current bar.
But there is no way to identify something like at which level Leading Span A and/or the Base Line stayed at the longest in the most recent X bars.
-Bruce
Personal Criteria Formulas
TC2000 Support Articles
|
|
Registered User
Joined: 3/10/2012
Posts: 465
|
Alrite Bruce i think i can work with this atleast helps me to sort out unwanted results , and with few tweaks of my own it manages to visually get desired results on higher timeframes
Appreciate all your help
Cheers :)
|
|
Registered User
Joined: 10/7/2004
Posts: 794
|
Clarification please Span B is MaxH52+MinL52/2 26 periods ahead
Would that be created as MAXH52.26 + MINL52.26/2 or does the 26 periods refer to 26 periods in the past? If so how does one create 26 periods ahead according to definition?
Thank you in advance!
|
|
Worden Trainer
Joined: 10/7/2004
Posts: 65,138
|
Leading Span B is shifted to the right by 26 bars so it extends 26 bars into the future.
At the far right end point 26 bars in the future its value is (MAXH52 + MINL52) / 2.
At the point where price is most recently plotted it is (MAXH52.26 + MINL52.26) / 2.
-Bruce
Personal Criteria Formulas
TC2000 Support Articles
|
|
Registered User
Joined: 10/7/2004
Posts: 794
|
Thanks Bruce,
so if I am using it on a 10 minute chart I would use the second one because it is based on most recent point?
The first one is 26 points ahead because it is divided by 2 I don't really see the difference, please clarify.
I thought the second one meant the maxh52 26 bars ago not ahead
|
|
Worden Trainer
Joined: 10/7/2004
Posts: 65,138
|
The / 2 doesn't do anything besides divide the stuff inside the parentheses by 2. The first formula:
(MAXH52 + MINL52) / 2
Is the highest high plus the lowest low over the most recent 52 bars all divided by 2.
The reason that it is for 26 bars in the future is just because that is how Leading Span B is defined.
(MAXH52.26 + MINL52.26) / 2
Uses the same values from 26 bars in the past. The only reason it lines up with the the point where price is most recently plotted is that Leading Span B is shifted 26 bars to the right.
-Bruce
Personal Criteria Formulas
TC2000 Support Articles
|
|
Registered User
Joined: 10/7/2004
Posts: 794
|
OK Clear TY!
|
|
Registered User
Joined: 10/10/2004
Posts: 62
|
Bruce,
Could you please help with these 2 PCFs for Ichimoku Cloud where:
- The current price is within or above the Ichimoku Cloud when span A is above span B.
- The current price is within or below the Ichimoku Cloud when span A is below span B. (Opposite of above)
This request is for TC2000 V 12.4, and if possible for TC2000 V7.
Thank you.
|
|
Worden Trainer
Joined: 10/7/2004
Posts: 65,138
|
Please try the following for the initial requirements.
C > (MAXH52.26 + MINL52.26) / 2 AND (MAXH9.26 + MINL9.26 + MAXH26.26 + MINL26.26) / 4 > (MAXH52.26 + MINL52.26) / 2
And the following for the reverse.
C < (MAXH52.26 + MINL52.26) / 2 AND (MAXH9.26 + MINL9.26 + MAXH26.26 + MINL26.26) / 4 < (MAXH52.26 + MINL52.26) / 2
-Bruce
Personal Criteria Formulas
TC2000 Support Articles
|
|
Registered User
Joined: 10/10/2004
Posts: 62
|
Thank you again for your help.
|
|
Worden Trainer
Joined: 10/7/2004
Posts: 65,138
|
You're welcome.
-Bruce
Personal Criteria Formulas
TC2000 Support Articles
|
|
|
Guest-1 |