Registered User
Joined: 3/16/2006
Posts: 2,214
|
Part I Tcnet Analysis 5 minutes long:
i196.photobucket.com/albums/aa104/signaltap2/2008-10-18_0856.swf
Part II Scottrade Elite Analysis 5 minutes long:
i196.photobucket.com/albums/aa104/signaltap2/2008-10-18_0912.swf
please note, that when you click on the 2 links above, Adobe Flash will take alittle time to first download the file into a temp file, so don't close the download if it takes longer, it depends how fast is your DSL line! Thanks for your time and for viewing! Signaltap 
|
|
Registered User
Joined: 3/16/2006
Posts: 2,214
|
both links work! did test them, Sig
|
|

Registered User
Joined: 10/7/2004
Posts: 319
|
Nice videos Signaltap.
BTW - both videos loaded instantly on my iMac with DSL Extreme.
Thanks for your interpretations.
survivor
|
|
Registered User
Joined: 6/26/2008
Posts: 6
|
Appreciate your insight on the charts. If this continuation pattern formation does complete, it would seem that we could extend to 7000ish. Thoughts?
Videos loaded fine.
Thanks Again.
|
|
Registered User
Joined: 6/17/2008
Posts: 33
|
quite intetresting, but may i ask about the %true indicator that you used? what was it?
|
|
Registered User
Joined: 1/28/2005
Posts: 6,049
|
anauel63
See this:
Thanks
diceman
|
|
Registered User
Joined: 9/29/2007
Posts: 1
|
Your time and effort is much appreciated.Thanks for sharing.
|
|
Registered User
Joined: 3/16/2006
Posts: 2,214
|

|
|
Registered User
Joined: 3/16/2006
Posts: 2,214
|
from left to right,
VIX 60 min chart , 55ema redline held support! = going higher!
DJ-30 60 min chart, price holding redline now @ 9,146 also , 200ema @ 10,120 and 233ema @ 10,247 resistance areas
and Velocity & Forces for SPY's 5 hrs of action last Friday, please look @ the bottom pane where volume is and look @ the difference between 11am-1:30pm and 1:30pm to 4pm price went up on lighter volume, which is bearish. Now look from 1:30pm to the close when price dipped, look @ the red selling volume = hands down bearish looking SPY, more selling last 2.5 hrs!! = market heading lower! Sig
|
|
Registered User
Joined: 3/16/2006
Posts: 2,214
|
I just noticed that 8 of the last 10 trading days for the dow, the area near 9,300 is key of resistance! :
Oct 8 - low /closed 9,258
Oct 9 - open 9,261
Oct 13 - close 9,387
Oct 14 - close 9,310
Oct 15 - open/high 9,308
Oct 17 - high 9,281
Oct 20 - close / high 9,265
Oct 21 - open/high 9,284
also from Oct 6th to Oct 10th on a 60 min chart stochastics kept being oversold for 5 days under 20, from 10,000 to 8,000. but now is having problems crossing 9,300 and the last 2 days volume is so light and under par, this behavior in price and volume is so bearish that a new legdown began today!
Just look @ that negative candle formation since Oct 6th @ 10,000, plunged 2,000 points in 5 days to 7,800 lows, then the last 7 days, price is trying to bounce but it CAN'T cross above 9,300
Dj-30 wants the 2003 low @ 7,416 Signaltap
|
|
Registered User
Joined: 3/16/2006
Posts: 2,214
|
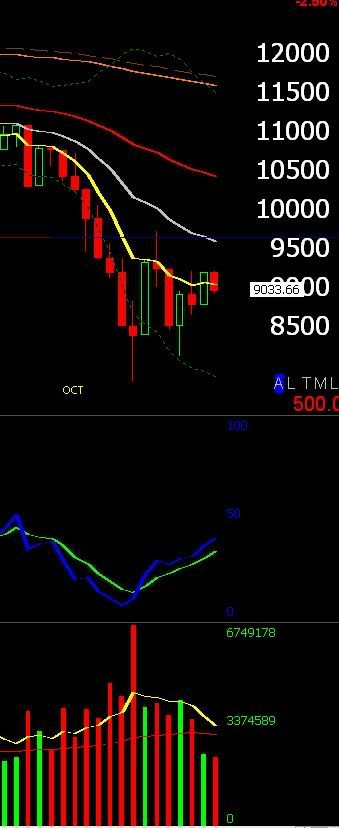 Daily chart dj30 from the begining of Oct Daily chart dj30 from the begining of Oct
|
|
Registered User
Joined: 3/16/2006
Posts: 2,214
|

|
|
Registered User
Joined: 9/25/2007
Posts: 1,506
|
sig ...
Let me ask you a question ...
Have you ever considered how the Fibonacci sequence plays into time ... as well as price ?
How market movements (in time) and retracements (in time) relate to the sequence ?
Check this vid ...
(link removed by moderator)
There are some timing methodologies/philosphies out there like The Market Matrix ... the Delta Phenomenon ... that sort of tie all this together ... though much of it is way over this dumb ol' country boy's head ...
Might be worth a look for you ...

|
|
Registered User
Joined: 9/25/2007
Posts: 1,506
|
Well ... you can find it for yourself by going to tradertom at the obvious URL ...
It will be hot-linked in today's blog entry ...
|
|
Registered User
Joined: 3/16/2006
Posts: 2,214
|
futures this morning so far: dj30 -250 and s/p -30 gotta believe! Sig
|
|
Registered User
Joined: 3/16/2006
Posts: 2,214
|
reloaded SPY puts @ 1.72, I now have 100, I might unload tomorrow or Frday! Sig
|
|
Registered User
Joined: 6/16/2008
Posts: 4
|
Sig, have you posted an explanation of how you get the most useful results from what DD has called the Guppy. I think he credited you with the inspiration for his version.
|
|
Registered User
Joined: 3/16/2006
Posts: 2,214
|
hi grey! I did not know that, can you guide me in showing if you can, that info? thanks a bunch! Sig
PS: s/p futures ARE LIMIT DOWN!
|
|
Registered User
Joined: 6/16/2008
Posts: 4
|
I will if I can find it again. DD uses many more moving averages than you do.
(It's pretty though. A blow up would make a great picture for behind the couch.)
Since my last post on this thread, with a little investigation, I found out (which I should have already known I guess) was that the Guppy chart was the brain child of Daryl Guppy and I think that she has a fairly full explanation of how she envisioned the Guppy or Multiple Moving Average (MMA) chart to function in the book that she wrote called "Beating The Odds". I am really into "Cliff Notes" though. I hope I can find a more concise discussion of the chart.
|
|
|
Guest-1 |