
Registered User
Joined: 3/21/2006
Posts: 4,308
|
I have had requests from both forums to post more on VSA despite the nay Sayers (only on this forum) we know who you are, so please do not respond to this thread, unless it is an intelligent rebuttal, one that can be discussed, not a one sided ranting.
I am becoming more comfortable with Tradeguider and I am using the tools to scan for strong stocks. There are not many in these market conditions so I was focusing on my bounce technique more than VSA.
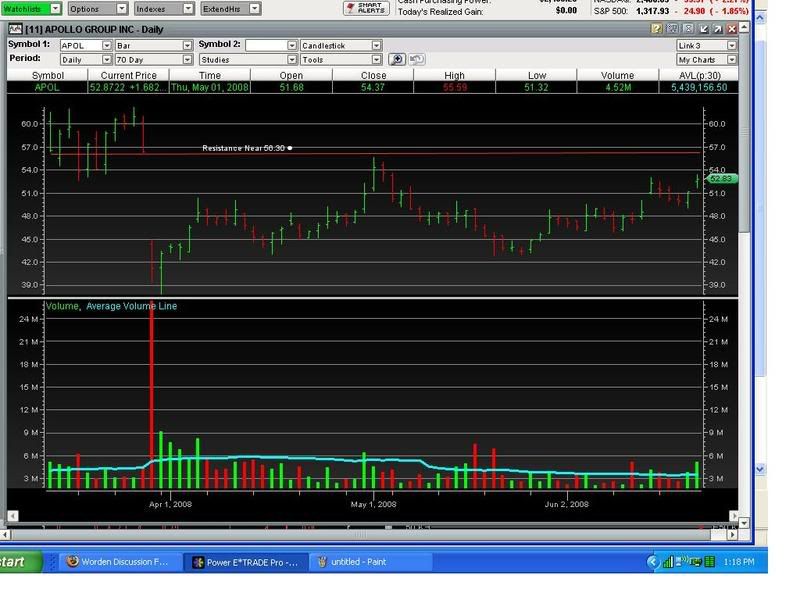
I ran across a good stock APOL it was at the top of the list for the $SPX and although the current candle is a negative evening star I will buy above the high at $53.50 The volume looks good and the last couple of days show accumulation with some nice spreads.
RIMM is a good example of a stock (I shared this with the other forum) that you trust the volume pattern over the candle interpretation. Look at RIMM for June 17th most on the other forum saw a hanging man or reveres hammer and they were correct But myself and one other discussed that things just did not look right for a reversal. We wee both proved correct as the price continued up. My conclusions about RIMM were based on using Tradeguider analysis.
I am getting the same type of analysis for APOL Take a look and let me know what you think. Booker, Memorableproducts, Bknight, Ozash and Davidjohnhall I would love your feedback on this one. More will follow on this thread..
Thanks
Apsll.
|
|
Registered User
Joined: 3/21/2006
Posts: 4,308
|

|
|
Registered User
Joined: 3/21/2006
Posts: 4,308
|
MP, This post is more for you so that you can understand how I am viewing VSA.
In my chart below APOL I show when (IMO) smart money first started to show their hand in late March early April (highlighted with the big red circle). Now keep in mind that the volume oscillator confirms this as being one of great accumulation and shares are being bought in the $40 -$43 range. Now you look in mid April and mid May (highlighted by the red squares) and again the volume oscillator is showing signs of buying pressure. Smart money is eating up supply and increasing demand.
Let’s look at the psychology of their actions. They are buying lots of shares within the $40-$43 range and now they can take their time shaking the weak holders out of the stock. You see that price has slowly drifted up to the $52 range, already a 20% gain I would give this until the resistance at around $60 or more.
This is how they explain in the tutorials how VSA works. Here is the chart.

|
|
Registered User
Joined: 1/28/2005
Posts: 6,049
|
APOL was a great stock for me during the 2000/2003
bear market. At the time I didn't care why it was going up
just that it was.
Thinking about it later. It may have been people will lose
jobs in a recession and may opt for education.
So there may be a relationship:
Bad market= Good for APOL
Thanks
diceman
|
|
Registered User
Joined: 3/21/2006
Posts: 4,308
|
I hope that history repeats itself Diceman. Thanks for sharing that, it gives me more confidence in the stock to know that you sponsor it.
We all have to keep in mind that even if price reverses here and goes back into the $45 range it is not a bad thing. This stock is in strong hands that is the criteria for it showing up at the top of the scan and that is all that we need to know. Since I know that the smart money paid $43 a share then if price falls into this level, I will buy a whole bunch of it. This is going to be a good test for VSA...
|
|
Registered User
Joined: 3/15/2008
Posts: 45
|
Apsll,
Thanks for your VSA views. I have watched several of the TradeGuider VSA videos and am getting close to purchasing the program. I'm interested in your opinion as to whether you believe it works well in tandem with TeleChart. I understand that TradeGuider screens for VSA candidates, but how are you using both programs to scan for your watchlists?
Thanks
|
|

Registered User
Joined: 3/25/2005
Posts: 864
|
Apsll, the more I see of this tradeguider's take on VSA, the more confused I get.
Do me a favor and check the top 3 to 5 symbols in your list for Friday and tell me how many of them
were Analyst Upgrades on or about Friday. I know that APOL was upgraded on Friday. I was just
wondering if there were any others like that at the top of your list.
Also, I'm not certain how your volume oscilator is working here.
If you will notice in the chart I posted, I have an 30-day average volume line plotted (blue line)
which looks very similar to the one on your chart (Is the one on your chart referred to as the Volume
Oscilator?)
Why are the last 2 days consider smart money accumulation while the volume bars are green?
Shouldn't the volume bars be red with the closing price marks above the bars' midpoint?
Here's A 70-Day Chart of APOL:
|
|
Registered User
Joined: 3/21/2006
Posts: 4,308
|
MP, I have not run the scan every day, so I cannot tell you if the 10 stocks that are on the list now were on the list the last time I ran it. Remember I said that I have not been impressed with the results lately and have been focusing on scanning for bounce candidates. I do not even know how it is that you know that APOL was upgraded.
A moving average on volume is not the oscillator. In my chart you will see it to the extreme right side of the screen in the middle. It is a gage that has red on top and green on the bottom with a line in the middle of the gage. If the green is above the middle line than there was more buying than selling that day. If the red is bellow the middle then there was more selling than buying. (To me it is still a good sign if the red is a little below the middle because it still indicates that at least there was some buying taking place). It is when the gage is 90% red that it is not good.
In the chart I show another stock in the top ten CHK I think that it might need a pullback, but if you go back in time to 10 trading days (the day that the oscillator is showing) then you will see that the cluster of bars were all showing demand and accumulation even though price was fading slowly and then wham 6 trading days ago volume kicked it up a notch and price started to rise. The trick to VSA is to know that the stock is in strong hands, know that demand out ways supply, and watch price and volume until the action changes, (it is changing for a reason).
I think that you are under the false impression that you can interpret something from one days worth of action, That is not the case you have to watch the background noise now (price and volume only) it all fits together into a puzzle. This is not for day trading at all (if you can shape it into one then good luck, but I can be of no help with that).
I believe you will get more from the tutorials and PDF files from their website than you can from me. It is sort of complicated. I have tried my best to explain it to you and Booker. I just do not think that I am doing a good job of it, I am sorry about that I have tried my best.
Any way here is the chart.
|
|
Registered User
Joined: 3/21/2006
Posts: 4,308
|

|
|
Registered User
Joined: 1/10/2007
Posts: 5
|
While I am basically a new person here on the forums I do spend my time roaming around this particular board looking for new concepts or ideas that are posted among the more experienced traders.
This actually has been a useful resource, and I can tell quite a few of the usuals must have been in this occupation for some time. Yet when their ideas are shared, no one claims that their method is absolute and is usually offered as a topic for research. I have found that your replies, BigBlock, are some of the least helpful information found on this board, in my opinion.
Instead of bashing with negative criticism, you should do your best to educate us so that we can become more successful, if that is your intent.
On VSA, the first time I've heard of it was on this Worden forum. This is an interesting concept that I have not looked too much into, but plan to do more research and see if it's applicable to my trading style. Not one indicator will clearly define the probability, but when combined with different methods that point to the same direction, that is gold and that's what we should be interested in. And I can see VSA as being a helpful indicator to determine probabilities.
Clearly you are not a fan of VSA, BigBlock. My question is why do you have such a negative perception on VSA? Have you proven its invalidity? If you can share with us on actually why you would not recommend VSA then that would be most helpful. Is it just impractical? To be honest, it doesn't sound like you know anything about it, but I would certainly consider your answer.
|
|
Registered User
Joined: 3/21/2006
Posts: 4,308
|
Spinalax, welcome to the forum. Do not waste time trying to reason with Bigblock. He only has three friends on this forum. Realitycheck, Funnymony and himself. Other than that most here ignore him.
After you have done some research on VSA come back and share with us. there are quite a few here that are in the learning proccess and we all like to discuss it together.
Thanks
Apsll.
|
|

Registered User
Joined: 6/6/2005
Posts: 1,157
|
Apsll, a picture or chart, in my opinion is worth a thousand words. Here's what i found...
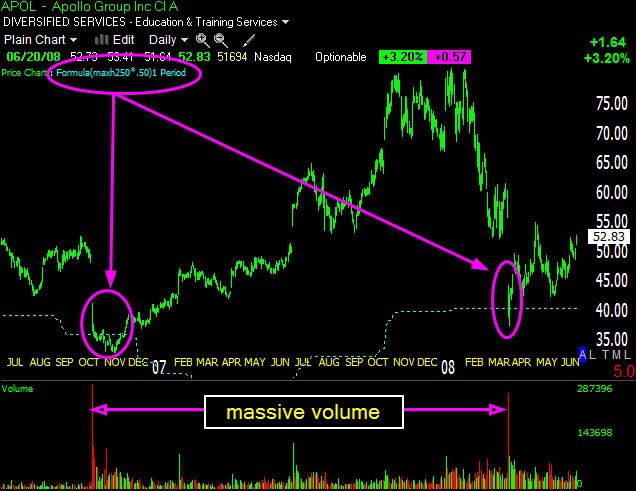
1. Gap on massive volume below the 50% retacement line.
2. Accumulation/reversal above 50% retacement.
3. Money made.
This one is following the pattern nicely. Disclaimer: I am currently holdong nop positions in this stock.
David John Hall
|
|
Registered User
Joined: 3/21/2006
Posts: 4,308
|
Thanks David for the analysis. Every new input (from Diceman and yourself) just makes me all the more confident. Sorry that I am entangled in yet another battle. We all know that Bigblock is not attacking VSA. He is attacking me for pushing his buttons. If he could only lift the veil of reality and see that every time he fights with me he only looks foolish and inevitably gets banned.
When if at all would you suggest a buy here?
|
|
Registered User
Joined: 10/7/2004
Posts: 2,126
|
QUOTE (spinalix)
While I am basically a new person here on the forums I do spend my time roaming around this particular board looking for new concepts or ideas that are posted among the more experienced traders.
This actually has been a useful resource, and I can tell quite a few of the usuals must have been in this occupation for some time. Yet when their ideas are shared, no one claims that their method is absolute and is usually offered as a topic for research. I have found that your replies, BigBlock, are some of the least helpful information found on this board, in my opinion.
Instead of bashing with negative criticism, you should do your best to educate us so that we can become more successful, if that is your intent.
On VSA, the first time I've heard of it was on this Worden forum. This is an interesting concept that I have not looked too much into, but plan to do more research and see if it's applicable to my trading style. Not one indicator will clearly define the probability, but when combined with different methods that point to the same direction, that is gold and that's what we should be interested in. And I can see VSA as being a helpful indicator to determine probabilities.
Clearly you are not a fan of VSA, BigBlock. My question is why do you have such a negative perception on VSA? Have you proven its invalidity? If you can share with us on actually why you would not recommend VSA then that would be most helpful. Is it just impractical? To be honest, it doesn't sound like you know anything about it, but I would certainly consider your answer.
You go ahead and do your research, and then come back and ask questions as the ones I have raised since the nonsense anouncement of VSA.
You will never figure out what "smart money -as they call it is doing", and you will never decipher the resulting volume bar. All you can see is the volume amount, and whether it as been on a negative or positive closing. THE REST IS ALL ASSUMPTIONS. You will never know who sold or bough, and the reasons why they did so.
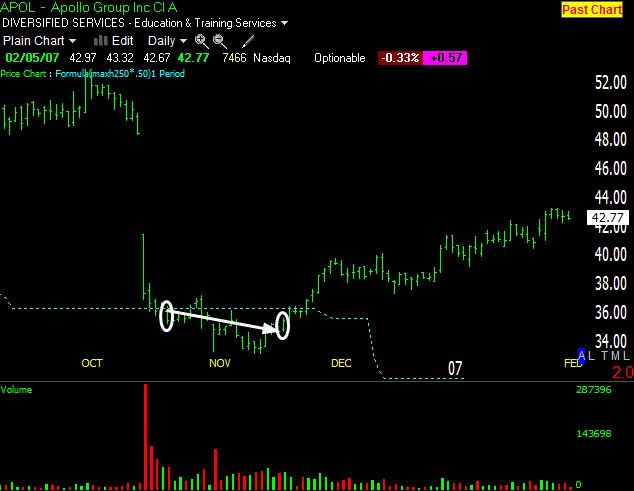
Look at the sample offered by DavidJohnHall. Look closely at the chart - and this is looking at history (that is a lot easier than trading the present) - the selling climax that appear in early October was follow by more selling for near a month for a consequent futher decline of what looks like about $9 dollars (from $42 to about $33).
Would you be willing to take a position as such? What would you had been thinking when your position was $2 down, or $4 down, or $6 down ...?
Just as David show a supposely sucess of VSA, why don't we ask him to post another in which success wasn't a key note. Per example NHWK sounds a bell??. I mean we can keep waiting for another few month and I suppose the stock will go somewhere, BUT so is that a sucessfull system?
What about DSTI? May be we can wait another year or two to proof the system ?
Do your research and do as you wish. We all have to learn some way.
Take care.
|
|
Registered User
Joined: 3/25/2005
Posts: 864
|
Geeez, Apsll....
Would everybody stop thinking I'm looking for another Day Trading System, Already!
I was showing interest in VSA for its Short Swing trading potential, that's all.
On another note, I don't think you fully explained, in the past, how the Volume Oscillator worked (until now).
Thanks for the explanation. So you are saying that the volume oscilator only measures the
current day's volume? Is there a way to preset it to show a cummulative volume effect over say
the last 30 trading days? Or, are you limited to just seeing what happens one day at a time?
I realize that this tradeguider has much complexity, I'm just asking you do you think it is straying
from the original concepts of VSA. I just wanted your honest opinion. I'm not disputing what it's
capable of. I'm just asking you if you yourself recognize any of the VSA concepts in this software
that you originally learned on this subject since you have been learning about how the software
works.
Sorry, I didn't mean to give BigBlock any fuel for attack. I just wanted to know why I don't recognize
the original VSA concepts here in this software.
Also, are you able to customize the volume bar colors at the bottom of the screen to reflect either Red or Green only? So, if the oscillator shows green extending above the midpoint then, the volume bar
on the bottom of the screen should be green also, right? Or should it be the opposite color (Red)?
Because, in the original concepts of VSA, smartmoney accumulation was understood to be
accompanied by a Red volume bar. But, the oscillator seems to be indicating that green is the color
of accumulation.
By the way, is the oscillator monitoring a total accumulation by all buyers for the day or is it pinpointing
only the events where the smartmoney is probably buying into the stock for the day?
Thanks,
mp
|
|
Registered User
Joined: 6/6/2005
Posts: 1,157
|
Hi Apsll,
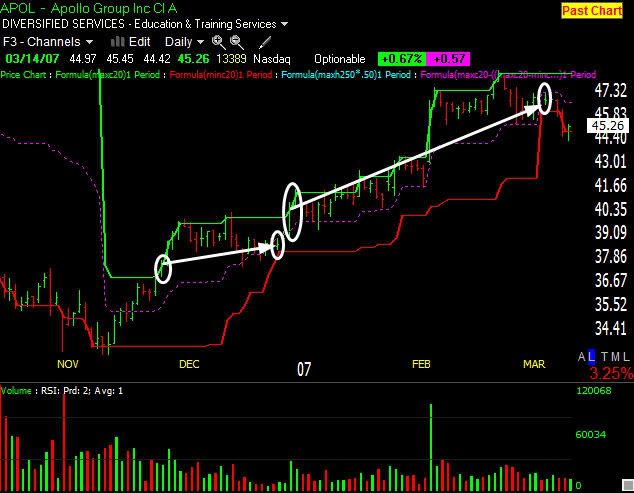
The buy on these trades is a little quirky. After a GAP of this size, I buy the open on the 5th day. This is an optimal day I have learned through backtesting to provide a good entry. i then hold for 20 days (a one month cycle) selling on the 21st day. As shown here:
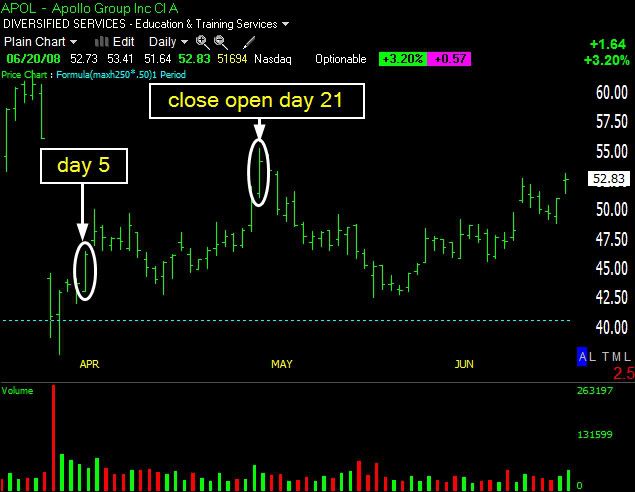
The 5 day waiting period is for volume and range to settle. The 20 days is once again an optimal period I have learned through backtesting. it works for me more than it doesn't and makes money.
I would not suggest anyone trade this without testing it. These trades occur during times that would unerve the most objective traders.
After the 20 day trade, I'll look for reentry is we make a new 20 day high like this:
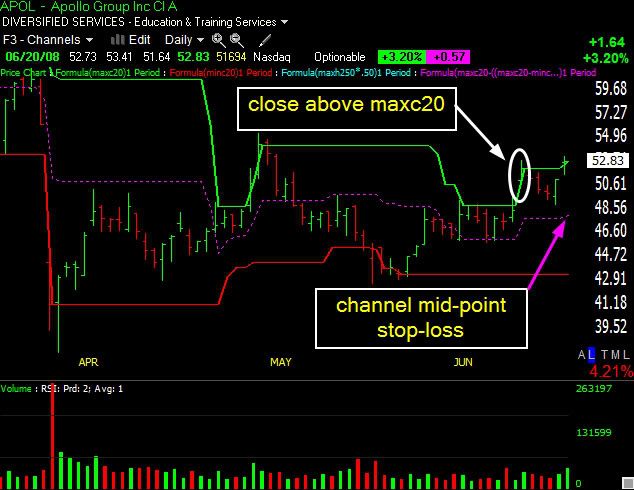
The stop-loss is the channel midpoint.
As i said, the 5 day post gap entry doesn't always work. Here's a prior trade in APOL that did not work.
And subsequent 20 day channel entries that did work:
To reiterate, i never trade anything without testing to find out for myself if it is a method i can work with. i would suggest everyone else do the same. And even then, be sure to always use proper money management principles.
David John Hall
|
|
Registered User
Joined: 6/6/2005
Posts: 1,157
|
Hi everyone,
Bigblock brings up a very valid point and one I mention often...no system works 100% of the time. I have never traded one that works more than 80% of the time. I'm not saying that they don't exist, but at my experience level I have never found one. Here is the chart BigBlock mentioned.

As you can see, after the GAP price continues down. If you were to enter on the 5th day, you would have been stopped out a few days later. i use a 10% stop on these trades for the wider swings that occur at these levels.
Now, if you were waiting for a break of the 20 day channel roof as entry you would have never been in the trade. And entered only recently. And would be profitable so far.
Here is the channel chart.

But even though this trade got you in at the right time and has you profitable, it still does not mean that these trades work all the time. Use proper money management, follow the signals, and act when you are supposed to act.
David John Hall
|
|
Registered User
Joined: 6/6/2005
Posts: 1,157
|
I'm not sure about DTSI because i don't see a gap or massive volume on a sell off below the 50% retracement. i see a sell-off climax top but I don't trade those. I do see more interesting activity around the 50% level which just makes me more curious about that level and interested in finding out more.

For the record, i am not a "VSA" trader or associated with anything else for that matter. I'm just a trader -- looking for profit and styles of trading that match my personality and a repeatable edge I can use for profit. Sometimes those edges dissapear, sometimes they just keep working and working, but either way...there's always more to learn and uncover.
David John Hall
|
|
Registered User
Joined: 3/21/2006
Posts: 4,308
|
David you are a wonderful asset to this forum and one of the reasons that it is easier to deal with the negative attributes of this forum, your bright light and that from others drowns out the dark and the negative.
DSTI was not a gap or VSA it was a stock that was popular on this forum about a year ago. there were a few of us at the time making some good profits following price up a nice channel until the channel was breached to the downside and the party was over. I rekindled the flame when the chart re-appeared on one of my scans. Tobydad and I were keeping an eye on it as Darth blockhead was using the dark side to derail us. Despite his clumsy attempts to do so, I was able once more to pull a profit from the stock.
Thank you for the charts above. I will enter APOL soon and will let everyone know when I do.
MP, Yes there is a way to read 30 days on the volume oscillator. Just use the monthly chart. My original threads on VSA although I made money with the concepts were only a basic version of what I now know of VSA. Six months from now my current knowledge level might be viewed in the same way. There is no doubt that VSA is complicated. Others have read the material and are having the same results as I am. On the positive side I do see my understanding of VSA evolving (slow but sure) I and we just have to be patient.
I am not the least bit worried about you giving fuel to ignite Bigblocks temper tantrums, he is nothing more than a pimple on the but end of this forum. Do I ever appear to be worried about him?
MP, keep in mind that on most charts the red on the volume bars is just showing us that the price closed lower than the previous bars close and the green shows us that the price closed higher. The color of the bar shows nothing more than this. The volume oscillator does however show the difference between the buying vs the selling pressure.
Now the hard part concerning VSA (it seems to be the sticking point that I cannot seem to get across to anyone. My fault). Yes the theory is that smart money will accumulate most of their shares during the sell-off. (The long red bars with very high volume). But weeks or months later when they decide to run the sock up and the rally is in progress you will of course see days where the volume oscillator is heavy in the green because now there are more players involved that is what a rally is. The early accumulation phase for smart money (the sell-off) is a different ballgame then the rally. First they have to acquire the shares as quietly as possible. That is phase one of the analysis (the stock changing over to strong hands) Then they play with the stock for a while through the process of shaking out the remaining weak holders through a series of up and down troughs were they are actually picking up more shares. That is the middle phase of their game. And then of course their final phase which is the rally.
I hope that helped. Finally the oscillator measures all volume activity not just smart money. I think that it would be difficult to pull that off. BOP in Telechart is actually supposed to help with that.
|
|
Registered User
Joined: 3/21/2006
Posts: 4,308
|
MP where you might want to do your swing trading is durring the middle phase when the smart money is shaking lose the weak holders durring the series of up and down troughs that I discussed above. Since you know that is what there game is then just swing trade the troughs. But also be ready for the rally.
|
|
Registered User
Joined: 3/25/2005
Posts: 864
|
QUOTE (Apsll) MP where you might want to do your swing trading is durring the middle phase when the smart money is shaking lose the weak holders durring the series of up and down troughs that I discussed above. Since you know that is what there game is then just swing trade the troughs. But also be ready for the rally.
This is a very good point Apsll, Thanks.
And thank you so much for taking the time to address my questions concerning the complexities
of the tradeguider software. It's appreciated.
Also, concerning CHK vs APOL, I was reviewing pivot point data, more specifically Monthly R2, and
I find that APOL Monthly R2 is 54.01 where as CHK's Monthly R2 is 97.32. This leads me to conclude
that the growth potential for CHK is much greater than that for APOL.
Just Food For Thought,
mp
|
|
Registered User
Joined: 3/21/2006
Posts: 4,308
|
Davidjohnhall, I got lucky today while squabling with Realitycheck this morning I missed the early morning run on APOL I checked in late around 10am and found that the stock had bounced back off the high from 5/01 and was selling off. I would have bought this had it not been for my early morning tiff. (thanks Realitycheck).
I am torn on wether to buy on the next swing low (if the volume and spread look good) or to wait for the resistance from the high of 5/01 to be broken.
What is your take on this? All are welcome to reply.

|
|
Registered User
Joined: 3/21/2006
Posts: 4,308
|
David, Booker and MP. just to let you guys know. I am all cash at this time, I was focusing on my bounce strategy (successfully) and put VSA on the back burner. I realize that by carving out small profits and not working on my VSA education, then I will not be prepared for the end of this Bear market when the smart money is building the bottom for the next Bull rally. Not making profits and getting an education are best done durring these times (Bear Market).
It will pay me back in spades when the time is right. So expect more posts and threads on VSA as my knowledge level grows. I will buy stocks, but only VSA candidates wich are few and far between in this Market. When my capital is not in the market it is in my money market account so I am making small gains.

|
|
Registered User
Joined: 3/25/2005
Posts: 864
|
Apsll, can you post a tradeguider chart on CHK showing us how it uses PIvot Point Analysis?
Thanks,
mp
|
|
Registered User
Joined: 3/21/2006
Posts: 4,308
|
MP, on the old version I was able to access that easily. Once I upgraded to the new version the interface is completely differnt. The DVD's that I received are all about theory and the old interface. I am reading the books, finishing up with the DVD's (I am watching them like 3 or 4 times) I get somthing new out of them every time I watch.
When I am done I will have to inquire how to use the new interface. Some of it I am figuring out on my own. It actually appears to have less options than the original, but they say it has more so I am still learning.
It is going to be hard to relate some of this stuff because you have a certain idea in your mind about this stuff. What I need you to do is just clear your mind and start blank. You really need to look at the information that I mentioned to you so that my job of teaching you will be made much easier.
See you at 4pm.
|
|
Registered User
Joined: 3/25/2005
Posts: 864
|
Oh, come on professor.
I really don't have a need to get that involved with this course.
Why can't I just try to take really good notes in your class?
Why do I have to do the homework assignments too?
I'm a great notetaker. Please don't make me do the homework.
Pleazzzzzzzzzz...............
Sorry Apsll,
Something came up and I couldn't make it to the chess board today.
I will try again tomorrow.
|
|
Registered User
Joined: 9/21/2008
Posts: 3
|
There seems to be a lot of guesswork when it comes to VSA. I really wonder how many have actually bothered to read the Tom Williams book, which is now free by the way. High volume isn't as significant as what happens after that high volume. In the majority of the cases the market undergoes some test during a period of low volatility before it advances. Sometimes high volume areas will just cause the market to move sideways as the gains are consolidated and then the trend continues. Theres more to it then just high volume always being an indication of buying. Been studying VSA for over a year with the Tradeguider guys and I do have the software also.
|
|
|
Guest-1 |