| Welcome Guest, please sign in to participate in a discussion. | Search | Active Topics | |
Registered User
Joined: 3/16/2006
Posts: 2,214
|

|
|
Registered User
Joined: 3/16/2006
Posts: 2,214
|
Hourly chart exploded to the upside with volume!
Daily chart, last volume bar above its avg! and price ALWAYS holding 21 EMA (white line top pane) TSV and MS just turned up and above its avg!
Weekly chart, Strong uptrend since last Summer @ 17
Thanks for your time, Signaltap (TCNET club : signaltap2)
|
|

Registered User
Joined: 2/5/2006
Posts: 1,148
|
the lord giveth............
|
|
Registered User
Joined: 3/24/2006
Posts: 72
|
Wow, they really got raped by meeting earnings expectations and giving a sobering outlook.
|
|

Registered User
Joined: 6/6/2005
Posts: 1,157
|
Might be a good low risk trade -- certainly with a few VSA attributes in tact. Appears that, news stories aside (which wern't earth shattering) the stock ran into two forms of technical resistance. A prior all time high and the underside of an old uptrend line. It's heading toward and near support from a recent breakout which should serve as support.

David John Hall
|
|
Registered User
Joined: 2/5/2006
Posts: 1,148
|
an example why trader don't like to hold during earnings. technicals looked pretty good.

|
|
Registered User
Joined: 6/6/2005
Posts: 1,157
|
Looks like MACD and TSV caled it with a slight but steady divergence with price at the recent run. Interesting. I see support around the 200MA -- will be interesting to see how this plays out.
|
|
Registered User
Joined: 2/5/2006
Posts: 1,148
|
maybe so, after things settle out. when using vsa formula do you simply look for a firming in price intraday, or a positive candlestick before taking a position?
QUOTE (davidjohnhall) Might be a good low risk trade -- certainly with a few VSA attributes in tact. Appears that, news stories aside (which wern't earth shattering) the stock ran into two forms of technical resistance. A prior all time high and the underside of an old uptrend line. It's heading toward and near support from a recent breakout which should serve as support.
David John Hall
|
|
Registered User
Joined: 6/6/2005
Posts: 1,157
|
Hi funnymony,
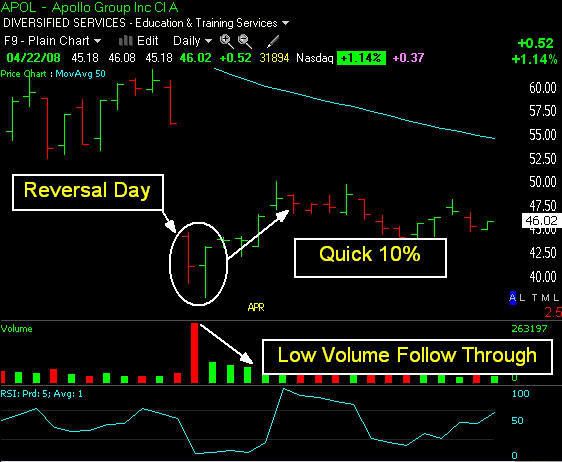
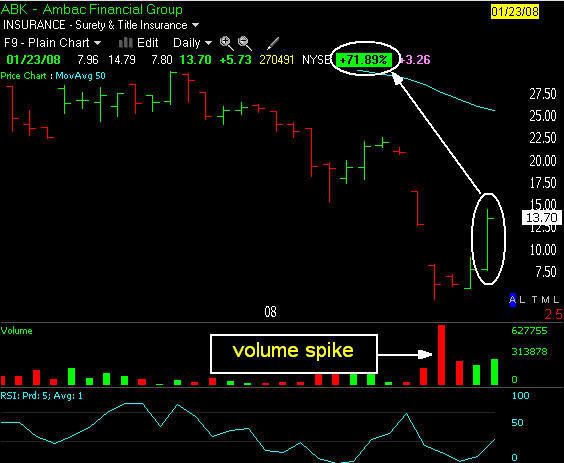
Normally I wait for 1 of 2 things before entering a gap like this. A reversal day or a time span of 5 days to let the selling cool off. I have backtested both and both are profitable. Here's an example of both:
Just for kicks I thought I would backtest all instances in the Russell 1000 when a stock gaped down and closed greater than 23% below the previous days close.
In the last 5 years there have been 127 instances. If you would have gone long the following day, no questions asked on the open and sold on the next day's open you would have:
127 trades
56.69% wins
43.31% losses
Avg profit 1.1%
Annualized 281%
Now, granted that's with a great trade in BSC that netter 75% in one day.
Next, i decided to seperate those trades that occured above the 200MA and those below the 200MA.
In the last 5 years you would have:
Above the 200MA
9 trades
77.78% wins (7 trades)
22.22% losers (2 trades)
avg prof 1.1%
297 annualized
Below the 200MA
56.2% wins
43.8% losses
1.2% avg gain
308.1% annualized.
Finaly, I decided to take the hold time out to 5 days:
49.5% wins
50.5% losses
2.4% avg gain
122.7 annualized
Then I realized that NFLX was not in the Russell 1000 - lol - and ran the test against all stocks above $1 per share with an avg volume of 200000. There were
1297 Trades
53.7 Bad
0.0 Avg gain
3.2% annualized.
That's quite a difference from the Russell stocks. As a matter of fact, I have never ran a test that didn't perform better on the Russell 1000. Anyway, there are the numbers.
David John Hall
|
|
Registered User
Joined: 2/5/2006
Posts: 1,148
|
interesting concept. i suppose if you checked a lot these trades out intraday, say on a 10min timeframe, you'd see reversal patterns, and improving technicals, prior to the bounce.
thanx
|
|

Registered User
Joined: 12/31/2005
Posts: 266
|
Basically, its called "scalping exhaustion gaps."
|
|
Registered User
Joined: 6/6/2005
Posts: 1,157
|
Looks like we had a nice bounce off the NFLX gap for a quick 10%. As we're now trading into the 50MA, it might be a good idea to tighten stops or close the position altogether.

David John Hall
|
|

Registered User
Joined: 10/7/2004
Posts: 2,181
|
Here's an added handy tool for spotting the gaps down that one might want to trade for quick reversals. It also works for stocks that have dropped to what one might consider a support level (trendline, LBB20, etc).

You'll notice the LR20 on 2-2-3 stochastics pointing up over 50. This is quite reliable in pointing out a good time to go long at open after a down day.
Sometimes I'll take a group of stocks that have dropped hard then sort by this LR20, go to the top of the list (press Home --- for those unaware of that feature) and look from there. Of course, one must engage brain before clicking "Transmit" but you can find some nice quickies this way. Sometimes 1-3% in the opening hours, sometimes, 10% or more over a couple of days. You just have to see where it goes from there.
Keep a tight stop at the open in case it heads down further. It also doesn't hurt to go to some source to see how the intraday 15min and hourly charts looked in the afternoon.
Here are a couple of scans that can make for some interesting hunts I also use these scans for the classic Tobydad profile (yes, I've given in and just call it that now) You can add "and C>O" on the second one for a little bullish variation.
H4 > H3 AND O4 > C4 AND H3 > H2 AND O3 > C3 AND L2 > L3 * .99 AND L1 > L2 * .99 AND C >= (H + L) / 2 AND O <= (H + L) / 2
O2 > C2 AND O1 > C1 AND H1 <= ((H2 + L2) / 2) AND H < H1
|
|
Registered User
Joined: 10/7/2004
Posts: 2,181
|
Oops; this one has the bullish ending on it.
H4 > H3 AND O4 > C4 AND H3 > H2 AND O3 > C3 AND L2 > L3 * .99 AND L1 > L2 * .99 AND C >= (H + L) / 2 AND O <= (H + L) / 2
You can always just change the end to C <= (H + L) / 2 AND O >= (H + L) / 2
(Just changing the > and < signs around).
|
|
|
Guest-1 |