| Welcome Guest, please sign in to participate in a discussion. | Search | Active Topics | |

Registered User
Joined: 3/25/2005
Posts: 864
|
JP Morgan Net Falls 50%
Housing starts drop twice as much as forecast
Dollar drops to record low against euro
US Consumer Price Rises 0.3%
Wells Fargo Profit Drops but shares up as earnings beat estimates
oil is at record high
But the s&p futures are up 12 pits -- Don't think I have ever seen anything like this before.
|
|

Registered User
Joined: 4/18/2005
Posts: 4,090
|
could be a whip saw or some other news is coming out. I think we are working on an intermediate term bottom hereish.
How much worse can it get? allot of stuff seems to be at bargain prices. IMO lower interest rates will be good for business that need to borrow for improvement and expansion.
I'm leaning twards the Whipsaw in that futures are way to far up...But who knows..
seems like lately future Dn price dn, future up price probably down futures way up price probably down by EOD. Futures way down price maybee up by EOD.
Just my amature thinking there.
|
|

Registered User
Joined: 2/5/2006
Posts: 1,148
|
thats what the talking heads on cnbc have been saying for the last several weeks. the same people who said there would be no bear market and the financial institutions problems were minor.
the market is forward looking, so often by the time the news is out it already factored into stocks. so the market moves the opposite way from the obvious.
maybe this is why some of us preferred technical analysis over fundamentals.
nonetheless, its still a rally within a downtrend. these rallys also act a lot like bear market rallys, as well. and i think at some point the news will have to improve before another bull run occurs.
|
|
Registered User
Joined: 3/24/2006
Posts: 72
|
I'm assuming a local bottom for now -- I'd say this bounce, especially if Don Worden's hunch would have it, would last a week or so. Might as well ride it up before joining the Bear down.
IMHO there's a lot at stake for everyone in the global market to make sure the markets down break their Jan/Mar lows... but given that there are very fundamental things that are wrong with the banks, and many bagholders who don't have the need to fess up yet, I'd be hesitant to go strongly long on any US stocks in the mean time.
|
|
Registered User
Joined: 3/24/2006
Posts: 72
|
Doh, didn't refresh this thread... I repeated what funnymony said and agree with him on his assessment.
|
|
Registered User
Joined: 3/24/2006
Posts: 72
|
I can't quite play the market oracle like the better chartists in the forum (nudge nudge charters out there), but if I had to venture a guess I'd expect the Dow to rally to the 12600-12700ish range -- upper channels for most market indicies seem pretty straightforward to ballpark (just draw a line! ;) ) -- though fundamentally I'm wary of placing any sort of bet on the Bear going away for at least another year or two.
|
|
Registered User
Joined: 3/25/2005
Posts: 864
|
Well, all I can say is that since we are currently in the earnings reporting period,
everything will revolve around whether or not the bellweather companies will
beat estimates. If most of them do, the markets is probably going to have more up days
than down days for at least the next 2 1/2 months.
|
|

Registered User
Joined: 6/6/2005
Posts: 1,157
|
enkidu,
As long as you keep your charts simple you can spot where we are in the current scheme of things. I try not to ask myself questions like "Are we going up or down?" but sometimes it's hard not to.
Here's what i see on a weekly and a daily chart of the SPY:
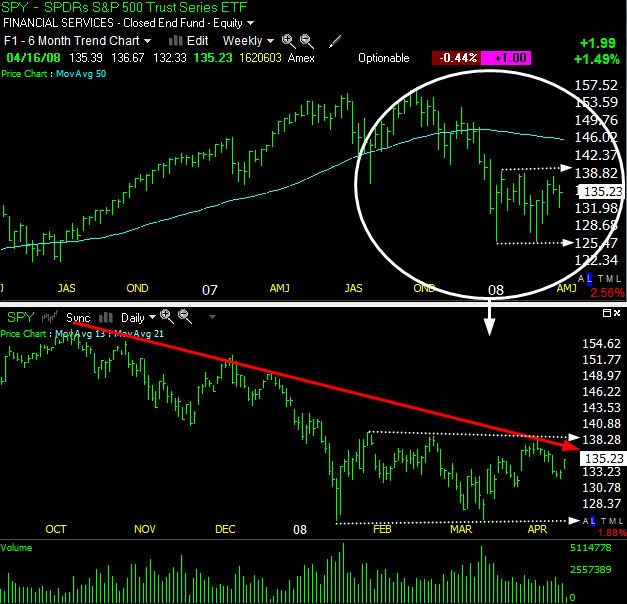
Currently, we're still in that channel that everyone one is talking about and 1 of 2 things will happen: we'll break out through resistance which is in the 138-ish level and then have to contend with the 50 week moving average resistance which is around the 146 level.
If we don't break down we could head down to the Jan/March lows. What's wild to me is the obvious increase in volatility on the weekly chart. Notice how much wider the range is on those bars after October? That's a large build up of energy which will have to resolve somewhere.
David John Hall
|
|
Registered User
Joined: 2/5/2006
Posts: 1,148
|
QUOTE (memorableproducts) Well, all I can say is that since we are currently in the earnings reporting period,
everything will revolve around whether or not the bellweather companies will
beat estimates. If most of them do, the markets is probably going to have more up days
than down days for at least the next 2 1/2 months.
intc really only met estimates, after charges, and i think it was only a few weeks ago they lowered estimates. yet they sparked the rally today, so go figure.
|
|
Registered User
Joined: 2/5/2006
Posts: 1,148
|
QUOTE (davidjohnhall)
enkidu,
As long as you keep your charts simple you can spot where we are in the current scheme of things. I try not to ask myself questions like "Are we going up or down?" but sometimes it's hard not to.
Here's what i see on a weekly and a daily chart of the SPY:
Currently, we're still in that channel that everyone one is talking about and 1 of 2 things will happen: we'll break out through resistance which is in the 138-ish level and then have to contend with the 50 week moving average resistance which is around the 146 level.
If we don't break down we could head down to the Jan/March lows. What's wild to me is the obvious increase in volatility on the weekly chart. Notice how much wider the range is on those bars after October? That's a large build up of energy which will have to resolve somewhere.
David John Hall
looks like possible head and shoulders bottom. but theres a lotta overhead the the 200dma above it. what makes me a little skeptical is the lack of volume over the past month or so. we'll see if volume picks up.
|
|
Registered User
Joined: 6/6/2005
Posts: 1,157
|
hey funnymoney,
Yes, I see what you're talking about. I've been reading up to confirm what I thought was true about h&s bottoms, the volume on the right shoulder is typically lower. Price projection on the breakout is typically the distance from the head to the neckline which would bring us to around the $148 level.

David John Hall
|
|
|
Guest-1 |