Registered User
Joined: 3/16/2006
Posts: 2,214
|
|
|
Registered User
Joined: 3/16/2006
Posts: 2,214
|
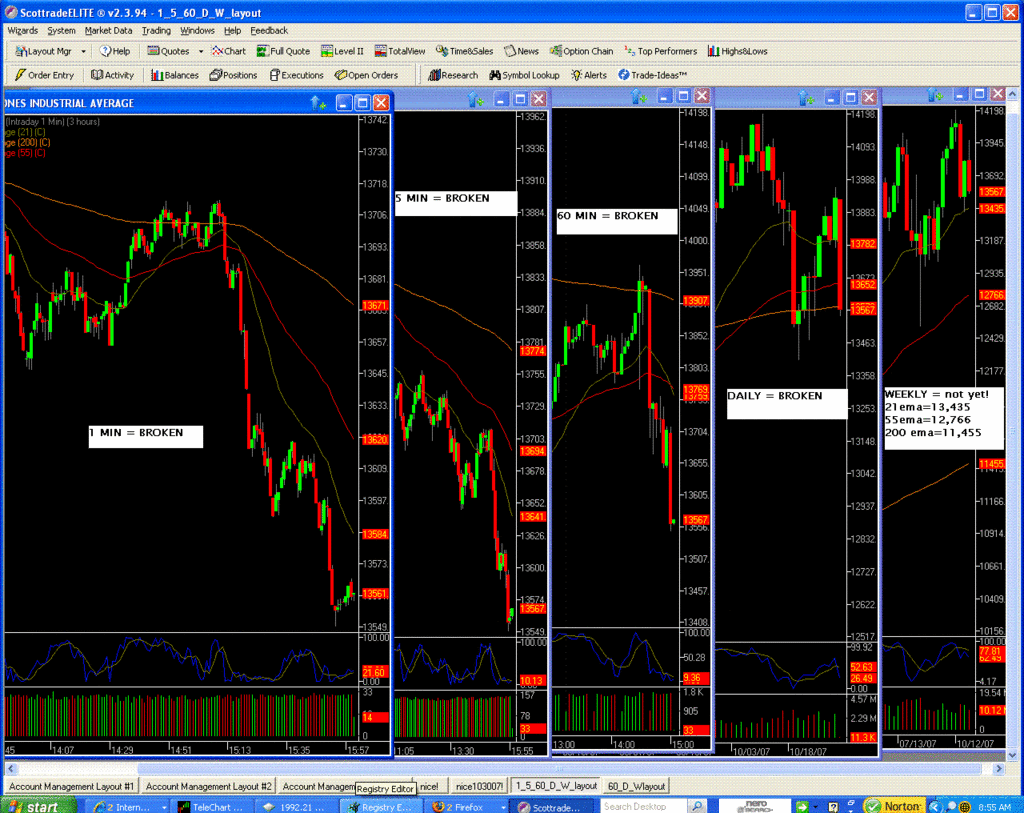
a correction seen.... on a daily chart, the 200ema is incorrect.... because my chart was plotted for 3months only (the 55 ema and the 21 ema are correct)
I switched the daily to plot for 6 months instead of 3.
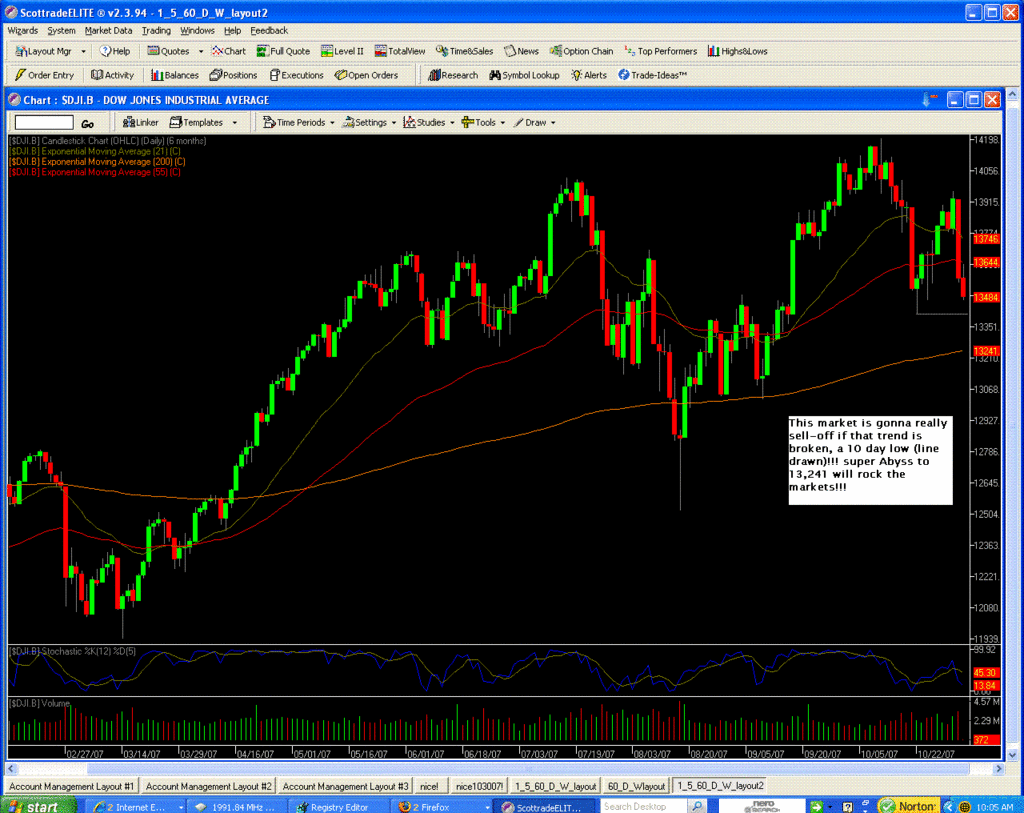
the correct 200 ema daily/6month chart is 13,243 ( and is very similar to the one in TC2007.
I plot my exponential moving averages using 1.61 (a Fibonnacci number multiplier)
|
|
Registered User
Joined: 3/16/2006
Posts: 2,214
|
sell into this rally, because yesterday's DJ30 price, closed under the 55 EMA daily (13,652)
|
|
Registered User
Joined: 3/16/2006
Posts: 2,214
|
we might see some support @ the 21 EMA / WEEKLY = 13,435 but who knows if the bulls are going to save this level, with all that carnage that we've seen and at that fast rate!
|
|
Registered User
Joined: 3/16/2006
Posts: 2,214
|
|
|
Registered User
Joined: 9/25/2007
Posts: 1,506
|
QUOTE (signaltap2) we might see some support @ the 21 EMA / WEEKLY = 13,435 but who knows if the bulls are going to save this level, with all that carnage that we've seen and at that fast rate! 
Well ...
I just wish they'd stop screwing around and get this show on the road ....
I like my candles ... like I like my women ... tall ... dark ... and shaved on the bottom ....

|
|
Registered User
Joined: 3/16/2006
Posts: 2,214
|
bulls are trying to fight this market in holding the 21 EMA /Weekly of 14,435. because that low today was 13,452. Just sit pretty "with your remote in hand"and watch the espectacle!
|
|
Registered User
Joined: 3/16/2006
Posts: 2,214
|
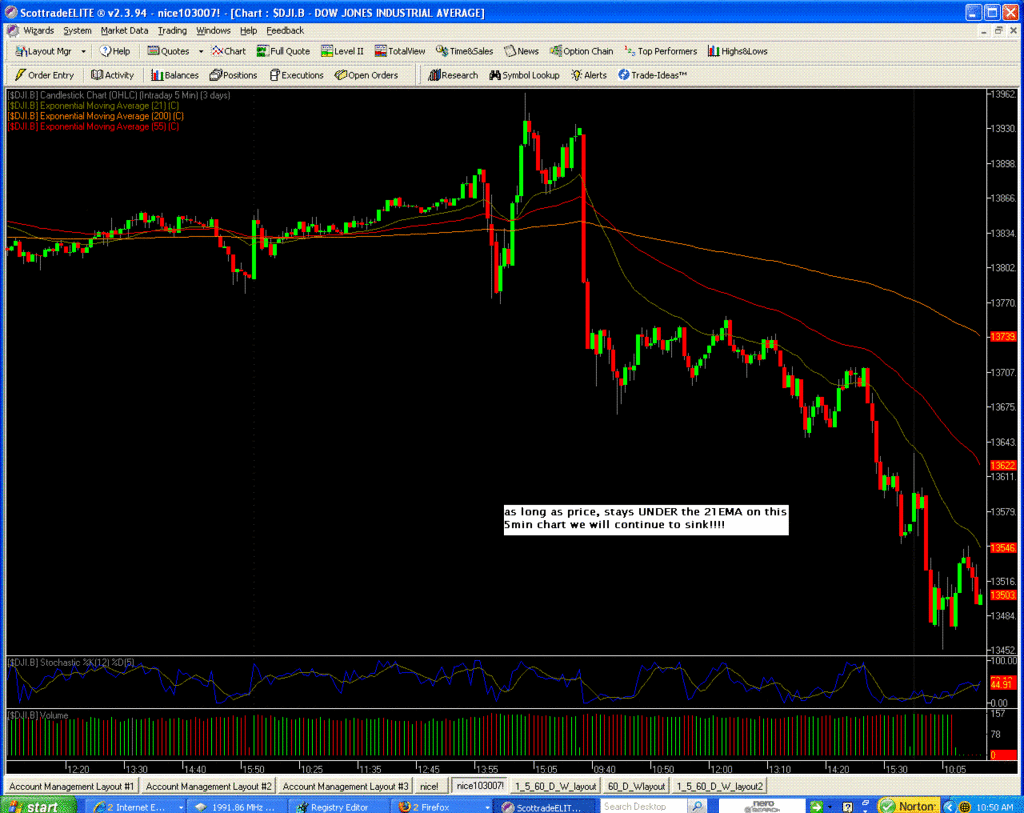
its a bear trap!! short again when price hit the 21 EMA / 5min level @ 13,562!! it will sink again!
|
|
Registered User
Joined: 3/16/2006
Posts: 2,214
|
|
|
Registered User
Joined: 3/16/2006
Posts: 2,214
|
I would be concern if the 55 EMA/ 5min hits
|
|
Registered User
Joined: 3/16/2006
Posts: 2,214
|
it really went to it (13622=55ema/5min)!!! I saw 13,604 and now is heading down again!
|
|
Registered User
Joined: 9/25/2007
Posts: 1,506
|
Were back to $95 oil ....
Gold is trading at $806 ... an all time high ... I believe ...
... and the Euro has solidly broken the $1.45 mark ....
Come on Bernanke .... throw some more money at it .... the speculators have used nearly every dime of your "contributions" to drive up the prices of commodities ....

|
|
Registered User
Joined: 3/16/2006
Posts: 2,214
|
|
|
Registered User
Joined: 3/16/2006
Posts: 2,214
|
it will be detrimental to the market if price closes UNDER 13,435 which is the 21 EMA (((((WEEKLY)))
|
|
Registered User
Joined: 9/25/2007
Posts: 1,506
|
I'm beginning to think that the bears came in for 30 minutes this morning ... just long enough for their boss to see that they were there .... and then they headed off to the Hamptons ....
They sure sure didn't head over to the NYMEX ... that's a "Bulls Only" facility right now ...

|
|
Registered User
Joined: 3/16/2006
Posts: 2,214
|
DJ-30 will open under the 21 EMA ((( WEEKLY))) 13,435 . so, its a 100% chance that the dow will see the 55 EMA (((WEEKLY))) of near 12,700!! now. The question to ask is why people keep buying ? waiting patiently until you get price rising above the 55 EMA hourly is the answer. ;)
|
|
Registered User
Joined: 3/16/2006
Posts: 2,214
|
|
|
Registered User
Joined: 3/16/2006
Posts: 2,214
|
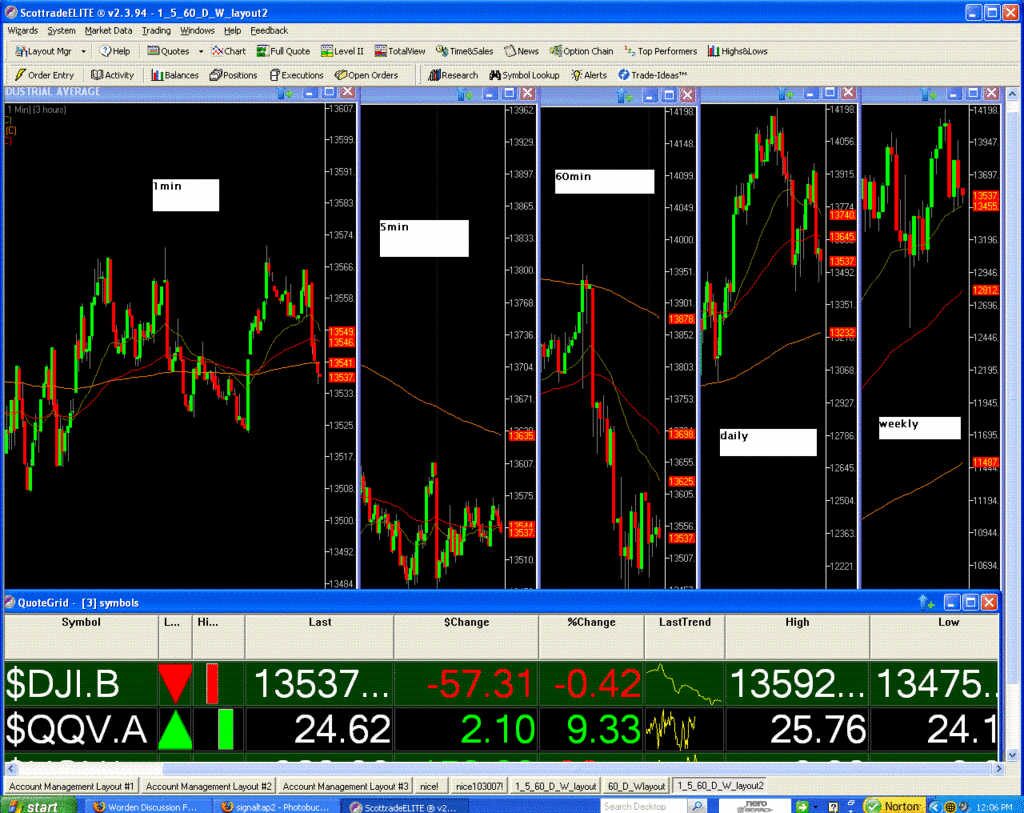
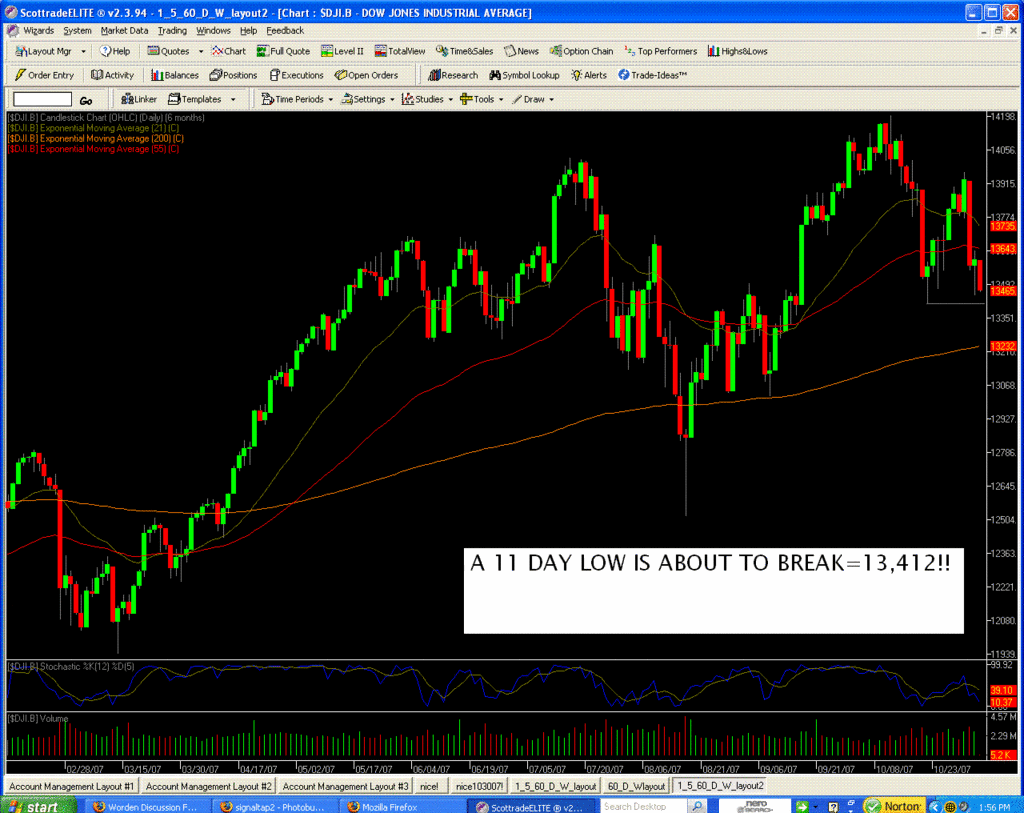
13,475 is todays low
currently, price is under the 55 EMA daily of 13,645
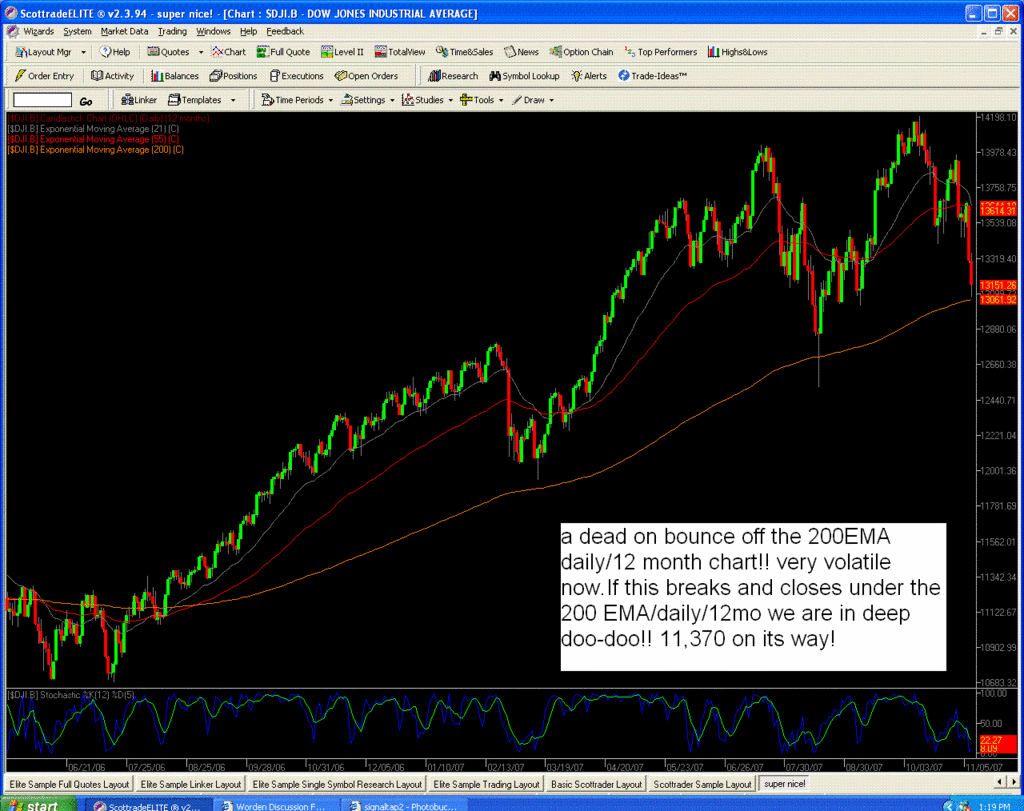
13,232 is the 200 EMA daily and thats the first step heading lower.
on Weekly charts:
13,455 is the 21 EMA (look how close todays low is from this level.)
12,812 is the 55 EMA and thats is the second step heading lower.
11,487 is the 200EMA and this is the real long-term low levels (if reached, this market would be in a full-bear mode (like the 1966-1982 era) ;)
|
|
Registered User
Joined: 3/16/2006
Posts: 2,214
|
|
|
Registered User
Joined: 9/25/2007
Posts: 1,506
|
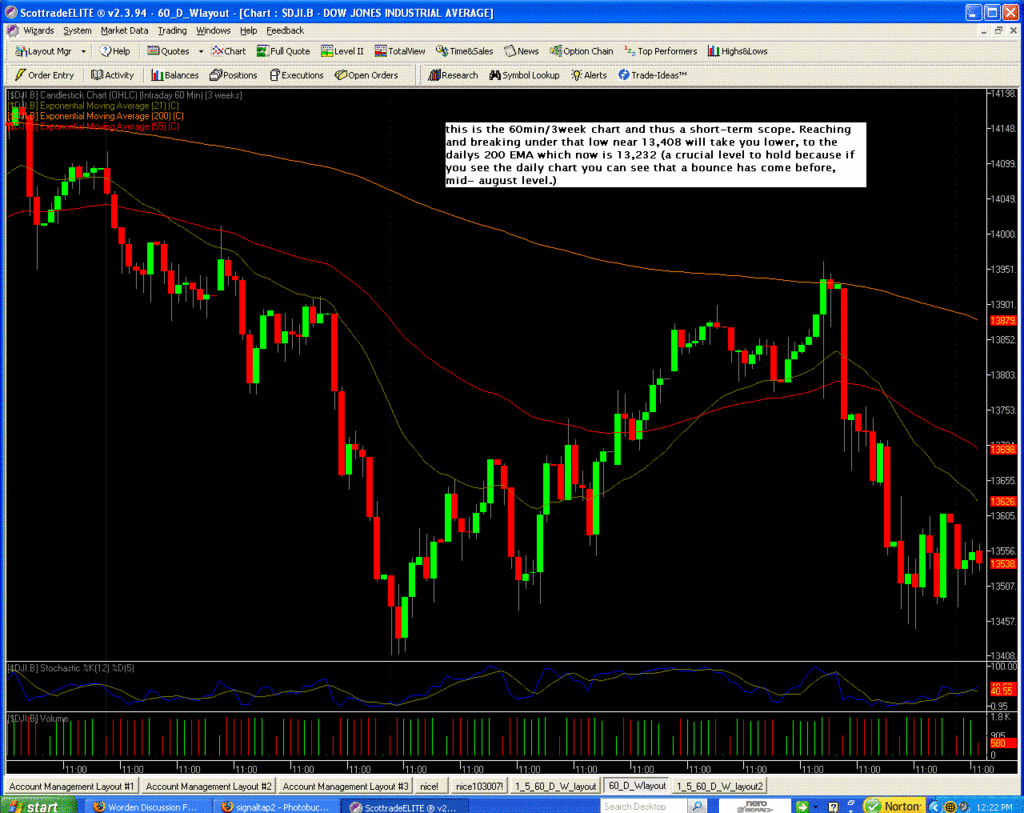
This morning it seems as though we just feel back to bottom trendline of the "uptrending consolidation in a downtrend" ...
But now ... we have broken that lower trendline ...

|
|
Registered User
Joined: 3/16/2006
Posts: 2,214
|
|
|
Registered User
Joined: 3/16/2006
Posts: 2,214
|
THE SNOWBALL EFFECT WILL AFTER THIS
|
|
Registered User
Joined: 3/16/2006
Posts: 2,214
|
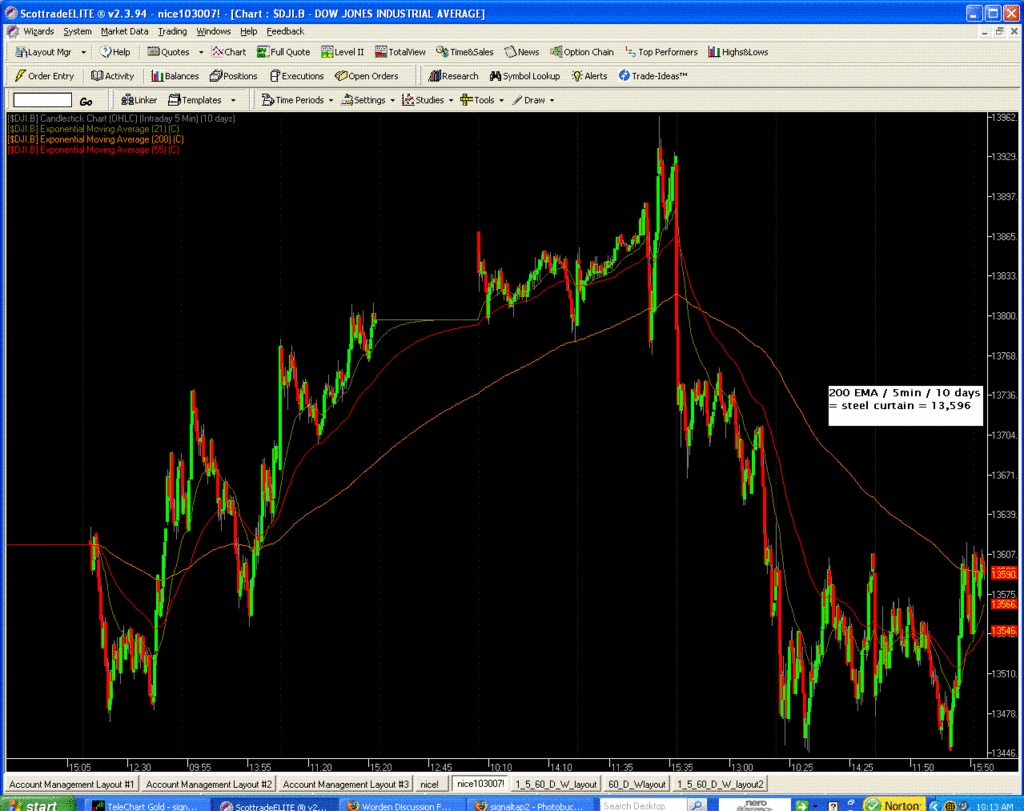
SHORT NOW, IT HAS REACHED THE 200EMA 5MIN CHART OF NEAR 13,600
|
|
Registered User
Joined: 3/16/2006
Posts: 2,214
|
|
|
Registered User
Joined: 3/24/2006
Posts: 72
|
Hrm, looks like 13.6k has been offering pretty strong resistance, but do you think it'll become support for a launch back upwards? Or that it'll just be a matter of time before the Dow goes south again?
|
|
Registered User
Joined: 3/16/2006
Posts: 2,214
|
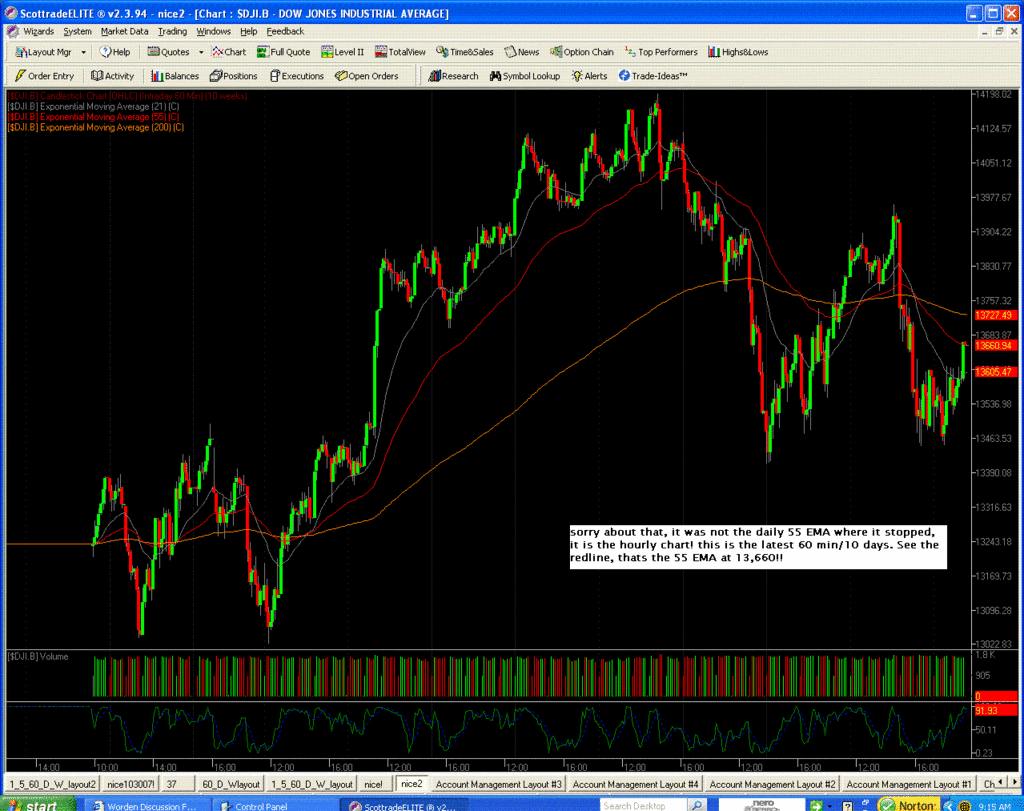
yesterdays late move was like a mouse trap, it stopped at the dailys 55 ema near 13,650.
and this morning is the begining of the "snowball effect" gold is out of whack, oil is at 98 and GM threw a monkey wrench with such a dissapointment. so, what happened with cisco's earnings, was it yesterdays? 12,800 very soon 
|
|
Registered User
Joined: 3/16/2006
Posts: 2,214
|
|
|
Registered User
Joined: 3/16/2006
Posts: 2,214
|
60 min/ 10 week chart!
|
|
Registered User
Joined: 9/25/2007
Posts: 1,506
|
QUOTE (signaltap2)
so, what happened with cisco's earnings,
Cisco doesn't announce until 4:30 ET today ...

|
|
Registered User
Joined: 9/25/2007
Posts: 1,506
|
Well ??
Now's not the time to be shy ... 
|
|
Registered User
Joined: 3/16/2006
Posts: 2,214
|
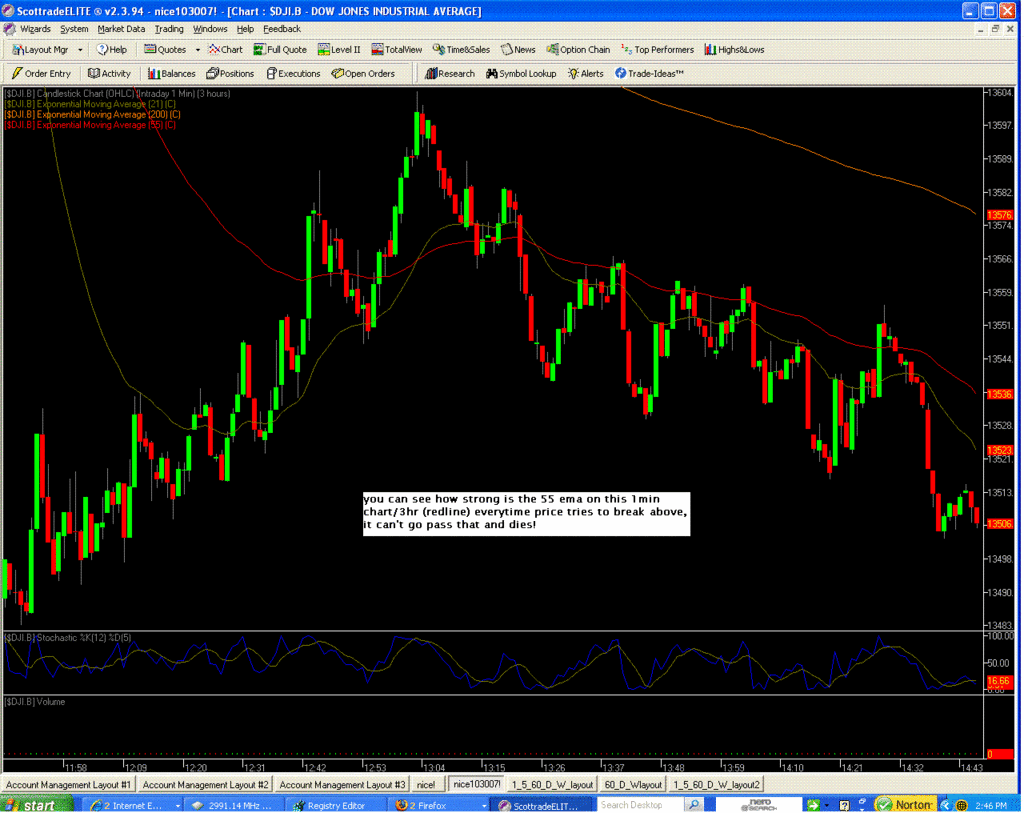
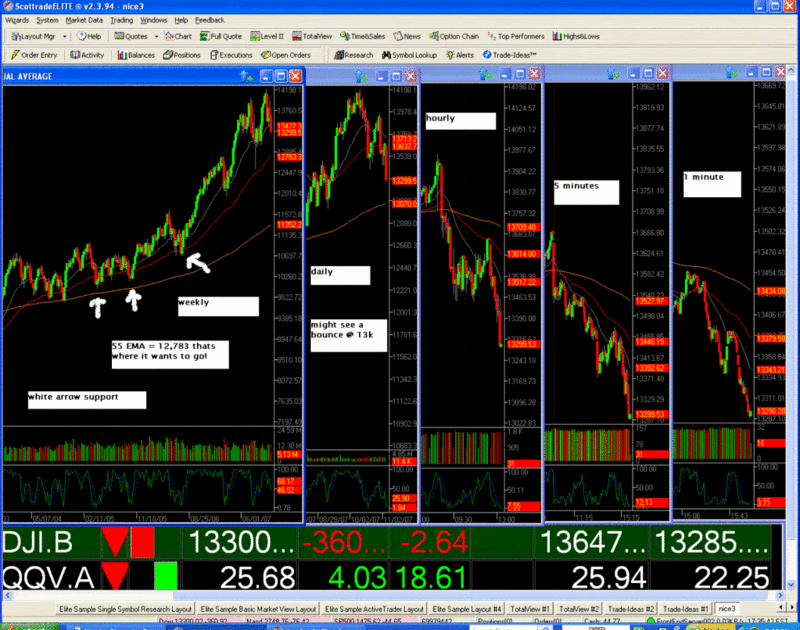
short again when 13,440 hits ( 1min / 55 EMA)
|
|
Registered User
Joined: 9/25/2007
Posts: 1,506
|
I must say ... tha this has been a more "orderly" readjustment than any I ever seen ...
Backing and filling at every stage ....
But .... unfortunately ... I can't help but feel that this means the same thing ... as it would in an uptrend ...
And ... until we see fear ... it just ain't gonna be over ...

|
|
Registered User
Joined: 3/16/2006
Posts: 2,214
|
|
|
Registered User
Joined: 1/5/2005
Posts: 11
|
Why so much empahsis on the 30 stocks of the DOW? The Wilshire 5000 index used to be made up of 5,000 stocks and now it exceeds 6,700 stocks. THAT seems to be a much better indicator by which to measure market performance.
http://www.answers.com/tmwx?cat=technology
|
|
Registered User
Joined: 11/7/2007
Posts: 49
|
Certainly I agree with the idea that the dow on not a good indicator, but besides that. What is up with all the colorful charts and lights.
Do you really need all of that to see where the market may be headed? - besides that it is non-sense to predict..
By the time you get done painting all the beautiful colors in your screen and predicting direction I have probably been back and forth a few times on any particular trade.
Do you guys actually trade or just paint beautiful colors on the screens?
Never seen such a beautiful screens - do they actually make any money for you? Just wondering to start taking some painting lessons.
|
|
Registered User
Joined: 3/16/2006
Posts: 2,214
|
first of all, thanks for reading and forming your opinion. Everyone have the way to look charts, to visualize, backtest (to what really worked in the past with diff. settings). When I see an Indicator, I want it to talk to me back, to make a statement (pinch my arm ) so I can react, make change in my portfolio and let everyone know so everyone to take heed of whats comin'.
for example, I'm 100% cash with my portfolio and 403b since Oct 10th @ 2pm (its posted in this forum). to ber explicit, I sold my Fidelity Telecom at 61.05 and now , I'm patiently waiting for when to jump back in cheaper (its 54.30 now). I'm not shorting right now (I could Ultra Short ETF's but I'm not 100% comfortable, still researching). thanks, Signaltap2
|
|
Registered User
Joined: 9/25/2007
Posts: 1,506
|
Rut-roh ....
The natives are getting "testy" ....
Doesn't sound like the kind of "happiness" that comes from successful trading days ... now does it ?

|
|
Registered User
Joined: 3/24/2006
Posts: 72
|
Keep up the good work signaltap2 -- let the detractors have their day, but ultimately this forum's a place to keep ourselves accountable to our style of investing/TA, and learn from others as well (which I have quite a bit from your market commentary, which I try to given your good track record of these things).
And to the detractors, at the end of the day fundamental analysis, TA, pretty colors, wavy lines, and other stock voodoo really is just about leveraging info/correlation to make profitable investment decisions over various time frames. As long as a predictive statement's presented along with a feasible investment tool (stocks, options, etc), I'd personally be receptive to 'em all.
Let's make money together, cheers! :)
|
|
Registered User
Joined: 3/16/2006
Posts: 2,214
|

|
|
Registered User
Joined: 3/16/2006
Posts: 2,214
|
|
|
|
Guest-1 |