| Welcome Guest, please sign in to participate in a discussion. | Search | Active Topics | |
Registered User
Joined: 12/21/2004
Posts: 902
|
On July 15, in a discussion of CMED, I posted:
QUOTE (hohandy) I would stay in the CMED trade for 3 reasons
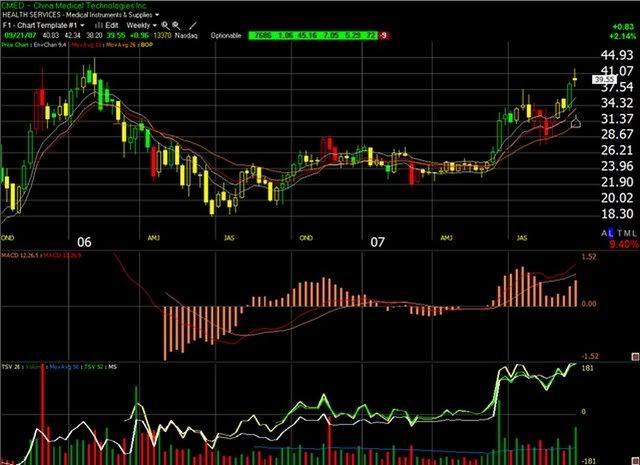
3) Most importantly, consider the weekly MACD-H -it's at 100. At a minimum, I would expect the price to pull back to this point on the weekly chart if there's a pullback - so that's virtually a floor - let's see where the ceiling is. This is one of those classic situations where the long-term chart shows the trend, the short-term chart shows entry points.
As the attached chart shows, CMED weathered "the troubles" in August and came back strong, matching and exceeding the July highs and fulfilling the weekly MACD-H=100 prediction. Price and average volume are all on the rise, OBV, TSV, and MS are all favorable, weekly MACD-H is rising - daily MACD-H hit 100 on Wed of this week. And price looks to be on its way to completing a cup pattern.
You still interested in this equity, JCFla?
|
|
Registered User
Joined: 9/21/2005
Posts: 566
|
Hey HH,
I was away on a work 'vacation' so didnt see this post until now. Did you take this trade? To be honest with you, I would have been shaken out of the stock when it gave up some ground in July. I think it was July. I have to find a way to try to guage a MACDH that is experiencing a pullback versus a stock that has run its course. Its hard to judge.
I am going to pay much closer attention to MACDH going forward because I need an approach that is suitable for longer-term trades and less active trading in general. Work has become too demanding time-wise to trade actively.
I will say this though in my own regard, I have wittled my surfer approach down to one long and one short and so far (knock on wood) the results are not bad. I think about 2-5% per month, although to be honest I dont have more than 3-4 months of data to base this on. I will keep monitoring it even if I don't trade it.
|
|
Registered User
Joined: 12/21/2004
Posts: 902
|
Don't forget, this had a weak daily MACD-H in July, but a strong weekly one. Both pretty much came true. There's nothing wrong with considering the weekly (or even the monthly) MACD-H in your longer term decisions. I'm thinking of limiting my future picks to those where both, and only where both, the daily and weekly MACD-Hs are high.
|
|

Registered User
Joined: 4/18/2005
Posts: 4,090
|
I"m embarrased to say that I don't understand what you mean by "macdH is at 100"? you are using 12,26,9 ? Is that 100 percent of the window it's ploted in or an actual reading? Becasue on my charts it's not been near 100 as far as I can tell.
If is is as a portion of the window it's plotted in then on 9/19 it was it's highest. However the weekly was higher in July ... so is that what you are talking about?
I have had a harder time in the past following the macdh=100 thinking. Mostly becasue I focused on other lines of thought.
How is it working out for you as a strategy?
so far my joint signal has produced 61 winning trades to 31 loosing trades. of the sum of those trades 33 of them were exited prematurely.. in some cases only by a single candle but generally by an amount significant enough to be interested in. So this tells me that despite what I thought about market condition I can afford to generally hold a little longer and I should fare better. Some of my exits were with in $10.00 of being a loss so I guess some of those will be actual losses but if the average gains per trade go up then it should be ok right?
|
|
Registered User
Joined: 12/21/2004
Posts: 902
|
Scott - each Telechart window will expand or contract to accomodate the highest/lowest axis value in that window's time frame.
When you run a sort by any indicator and choose "visual sort", it will return a sort value equal to how up (percentage-wise) the latest value on the chart is, with the top beign 100, the midpoint being 50 and the lowest being 0.
Remember Elder's dictum that I use in MACD-H - when price and MACD-H both hit a multi-month high, it indicates momentum such that in the case of a pullback, that high "should" be retested.
I use zoom=for my daily analysis (roughly 3 months of data), and I use the same zoom for weekly, although I don't remember how many months back that gives. So, if I sort by MACD-H, say, on the daily, and it returns a value of 100 for that day, that means that it is at the absolute top of the axis for zoom=6 - i.e., there was no higher MACD-H in the previous three months, or otherwise the axis would expand to reflect *that* value, and today's MACD-H visual sort value would be less than 100. So, saying that MACD-H=100, is just shorthand for confirmation that, at the time, it was at a three month daily high, (much longer period of time if doing a weekly analysis) - and if coinciding with a multi-month price high, that price high will be revisited. Note, when looking at past analysis, if the MACD-H has gone higher (or lower, further away from zero - the axis values are symmetrical around 0) since then, what formerly was a MACD-H=100 value won't be visual at the top of the axis anymore, as the axis has expanded to accomodate the newer more extreme value. So what is a MACD-H=100 can change depending on changing the date that it is being looked at, or by changing the zoom level, if changing the zoom will include values that change the axis. But the point is, *at the time* the fact that it was MACD-H=100 at the time meant that it was a new multi-month high that day.
Technically, on the above chart, the 3d price bar in JAS wasn't a MACD-H=100 - because the value had dropped further below 0 back in April and the axis is expanded to show that. So I apoligize for the confusion, as I'm talking shorthand. If you take the meaning of what I mean by MACD-H=100 - the weekly MACD-H for July 15 (as well as the price) *was* at a multi-month high - even if it technically didn't get to the very top of the axis because of the previous extreme low value earlier that the axis is still accomodating. Sorry if that made it confusion.
That is the one weakness so far that I've found in using the MACD-H=100 sort for stocks meeting the Elder dictum. Most stocks with MACD-H actually =100 will automatically meet the criteria (sometimes it isn't a multi-month price high and needs to be thrown out), but other times, such as this, it will still be a multi-month high, but because the symmetrical axis reflects an earlier extreme low, it won't register as "100" and so will be missed, even though it otherwise fits the criteria - and who knows, maybe a stock that makes a new multi-month MACD-H high so soon after such an extreme low may in fact be stronger than other stocks and I'm cheating myself by not finding them.
But good on you for calling me on it.
|
|
|
Guest-1 |