
Registered User
Joined: 6/30/2017
Posts: 1,227
|
Bruce, just going to put it out there, though it's a looooooong shot...
Any chance of implementing automagically plotting trendlines as described in the July issue of S&C Mag?
Source: Stocks & Commodities V. 35:07 (28-30): Trendline Algorithm by Dirk Vandycke

|
|


Worden Trainer
Joined: 10/7/2004
Posts: 65,138
|
You can get fairly close using something like the following Formula in a Custom PCF Indicator set to Line Plot Style for support.
IIF(MINL5 > L5 AND L5 < MINL5.6, L5, 1 / 0)
And something like the following Formula in a Custom PCF Indicator set to Line Plot Style for resistance.
IIF(MAXH5 < H5 AND H5 > MAXH5.6, H5, 1 / 0)
But the lines will be offset from where you actually want them (and you can't just use an offset moving average to shift the lines to the correct spot), plot past as well as current value support and resistance lines, and won't continue to plot past the last detected low (in the case of support) or high (in the case of resistance). You also can't easily check for price crossing through this version.
I have not been able to figure out a reasonable way to do this using the current version of the Personal Criteria Formula Language.
-Bruce
Personal Criteria Formulas
TC2000 Support Articles
|
|
Registered User
Joined: 6/30/2017
Posts: 1,227
|
Thanks, Bruce ... actually wasn't expecting ... anything :)
Personally I'm more interested in horizontal support & resistance lines, so I'll give this a shot. Being offset isn't that big a deal ... I just need practice spotting support and reistance levels on naked charts. Been relying on indicators waaaay too much and neglecting my price action reading skills.
Could be a nice set of training wheels. :)

|
|
Registered User
Joined: 9/17/2010
Posts: 484
|
Still looks useful, Bruce, Thanks.
To catch a recent (in my case, 20 day) high or low I use Custom PCF Indicators
MaxH20.1 and MinL20.1 with Last Value Horizontal
|
|
Registered User
Joined: 3/16/2016
Posts: 57
|
Hi Bruce, I have been reading some forms. this one and http://forums.worden.com/default.aspx?g=posts&t=60990
Is there a scan, where, Price can cross thru Pivots? Like the Last pivot High or Low on a daily chart?
thanks
|
|
Registered User
Joined: 3/16/2016
Posts: 57
|
I have read another post about the Barry Indicator. http://forums.worden.com/default.aspx?g=posts&t=65746
I think this is what I am looking for. Can you explain again how this works again? for both a scan and a indicator?
thanks
|
|
Worden Trainer
Joined: 10/7/2004
Posts: 65,138
|
I really don't know how I could explain the techique any better than I already did in the Request PCF Formula topic.
-Bruce
Personal Criteria Formulas
TC2000 Support Articles
|
|
Registered User
Joined: 3/16/2016
Posts: 57
|
I was watching one of the webinars and they gave the code-
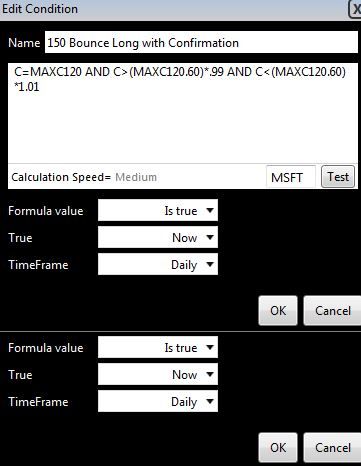
C=MAXC120 AND C>(MAXC120.60)*.99 AND C<(MAXC120.60)*1.01
To idenify prices just kissing the high's (in this example *Last high with in the last 120bars)
Do you see anything wrong with this formula? when I put it in- it says, "boolean formulas can only use is true, would you like use to change it for you?
thanks
|
|
Registered User
Joined: 3/16/2016
Posts: 57
|
I put the formula in notepad first-just to double check. before copying it into the PCF space. thanks
|
|
Registered User
Joined: 3/16/2016
Posts: 57
|
But
C=MAXC120 AND C>(MAXC120.60)*.99 AND C<(MAXC120.60)*1.01
still does not seem to work?
thanks
|
|
Worden Trainer
Joined: 10/7/2004
Posts: 65,138
|
The formula is for the price being at or above all of the closing values of the previous 120 bars and price being less than 1% away from the highest close in the 120 bars ending 60 bars ago.
Make sure you are entering it as a Condition Formula or a Custom PCF % True Indicator. It reads like you might be trying to enter into the field where the formula is expected to return a numeric value instead of true or false.
-Bruce
Personal Criteria Formulas
TC2000 Support Articles
|
|
Registered User
Joined: 3/16/2016
Posts: 57
|
This is how it looks, it says-Formula value -Is true?
thinks
|
|
Worden Trainer
Joined: 10/7/2004
Posts: 65,138
|
That looks fine to me (except the bottom portion should only be there once, not twice). I don't see any errors.
-Bruce
Personal Criteria Formulas
TC2000 Support Articles
|
|
Registered User
Joined: 6/30/2017
Posts: 1,227
|
Looks like this thread was highjacked while I was away. :)
|
|
Registered User
Joined: 3/16/2016
Posts: 57
|
Thanks Bruce, C=MAXC120 AND C>(MAXC120.60)*.99 AND C<(MAXC120.60)*1.01 does pick up some stocks now. And will pick up more if the ranges are wider.
C=MAXC120 AND C>(MAXC120.60)*.95 AND C<(MAXC120.60)*1.05 for example. Is this formula stating again, That price is near, the the highest high WITHIN 120 Days? So weather the highest high has occured 20days ago or 100 days ago, price is near the highest high WITHIN 120 Days?
thanks
|
|
Worden Trainer
Joined: 10/7/2004
Posts: 65,138
|
What it is saying is that price actually is the 120 closing price high. It is as high or higher than all of the prices in the most recent 120 bars.
It is also checks for price to be within 1% of the highest closing price in the 120 bars ending 60 bars ago.
It could be shortened somewhat to the following.
C = MAXC120 AND ABS(C / MAXC120.60 - 1) <= .01
Adjusting this to 5% results in the following.
C = MAXC120 AND ABS(C / MAXC120.60 - 1) <= .05
-Bruce
Personal Criteria Formulas
TC2000 Support Articles
|
|
Registered User
Joined: 3/16/2016
Posts: 57
|
Thanks Bruce, and can this formula be modified to say, -it will List stocks where, the price has crosed this Line, (Say, C = MAXC120 AND ABS(C / MAXC120.60 - 1) <= .03) 3% of the high. Within 2 days ago. So, it will show stocks, crossing today, and that have crossed yeserday-1day ago and from 2 days ago?
thanks
|
|
Worden Trainer
Joined: 10/7/2004
Posts: 65,138
|
I have no idea what this means because the following formula doesn't define a line.
C = MAXC120 AND ABS(C / MAXC120.60 - 1) <= .03
Do you mean it was true during at least one of the three most recent bars?
CountTrue(C = MAXC120 AND ABS(C / MAXC120.60 - 1) <= .03, 3) > 0
Do you mean the closing price was more than 3% of the way from the highest close of the 120 bars ending 60 bars ago 4 bars ago but was within that range during one of the 3 most recent bars?
CountTrue(ABS(C / MAXC120.60 - 1) <= .03, 3) > 0 AND ABS(C3 / MAXC120.63 - 1) > .03
Do you mean something else entirely?
-Bruce
Personal Criteria Formulas
TC2000 Support Articles
|
|
Registered User
Joined: 3/16/2016
Posts: 57
|
Yes, I see in one of your first post here that, "I have not been able to figure out a reasonable way to do this using the current version of the Personal Criteria Formula Language." for a support and resisance line.
But, this
"Do you mean it was true during at least one of the three most recent bars?
CountTrue(C = MAXC120 AND ABS(C / MAXC120.60 - 1) <= .03, 3) > 0"
Sounds like it can do it. So, in a sense it sounds like it is hitting that level, and now looking to see if a stock has been there within the last 3 bars. Weather the current price is above or below it now, compared to when it was there 3 days ago. I can just manullay look at the charts (from the scan results) and see how price has move from that level in the last 3 days.
|
|
Registered User
Joined: 3/16/2016
Posts: 57
|
Now that I am looking at the original formula again, which I got from one of the webinars, C = MAXC120 AND ABS(C / MAXC120.60 - 1) <= .03
You say, "Price is as high or higher than all of the prices in the most recent 120 bars.
It is also checks for price to be within 3% of the highest closing price in the 120 bars ending 60 bars ago"
Why ending 60 bars ago? I thought it is look at the higest high from 120bars ago.
The formula could be chaned to
MAXC60 AND ABS(C / MAXC60 - 1) <= .03? If you wanted the higest high from 60bars ago.
So what is the relationship of having both the 60 and 120 days in the same formula?
Sorry, This may be basic, but I am still trying to learn these formulas and grasp this concept.
thanks
|
|
Worden Trainer
Joined: 10/7/2004
Posts: 65,138
|
The formula has both MAXC120 and MAXC120.60 in it.
MAXC120 is the highest closing price in the most recent 120 bars including the current bar.
MAXC120.60 is the highest closing price in the 120 bars ending 60 bars ago.
MAXC60 would be the highest closing price in the most recent 60 bars including the current bar.
MAXC60.1 would be the highest closing price in the most recent 60 bars ending 1 bar ago.
Converting the following:
C = MAXC120 and ABS(C / MAXC120.60 - 1) <= .03
So it covers half the number of bars all around would be:
C = MAXC60 AND ABS(C / MAXC60.30 - 1) <= .03
-Bruce
Personal Criteria Formulas
TC2000 Support Articles
|
|
Registered User
Joined: 3/16/2016
Posts: 57
|
okay, Your looking at the highest closing price in the most recent 120 bars .
But then, MAXC120.60 is the highest closing price in the 120 bars ending 60 bars ago.
"Ending 60 bars ago" So now your only looking back 60 bars, so what is the need of Looking at the the highest closing price from120 bars then just from 60 bars ago.
Or is that a "With in" statement.
highest closing price in the most recent 120 bars, Then anything that got close to that price with in the last 60days?
MAXC60.1-Only Prices where, they were close to the high -just one bar ago-which you'd get alot of less results? then from .60 you'd get more results because it will all stocks within the last 60days that have got close to the high?
thanks
|
|
Worden Trainer
Joined: 10/7/2004
Posts: 65,138
|
MAXC120 and MAXC120.60 both check for the highest high over a span of 120 bars. In the first instance that span ends at the current bar. In the second instance that span ends 60 bars ago.
I didn't write it, but the idea of the following formula is to check for both the current price to be at its high and for that high to be within 3% of where it was 60 bars ago.
C = MAXC120 and ABS(C / MAXC120.60 - 1) <= .03
My guess at the intent would be to check for the current or closing price to be it a recent high while hitting earlier resistance.
-Bruce
Personal Criteria Formulas
TC2000 Support Articles
|
|
Registered User
Joined: 3/16/2016
Posts: 57
|
Thanks for the Clarification Bruce, I was trying to think of a diffrent way to write it.
Like, C = MAXC120 and ABS(C / MAXC120.60 - 1) <= .03 is the same as saying
C = MAXC120 and ABS(C / MAXC60.60 - 1) <= .03 But it is not, it gives diffrent results.
So is this ABS(C / MAXC120.60 - 1) saying, (MAXC120.60) The max High over the last 120bars occured-60 bars ago (60 bars ago has been the max high over the last 120bars)?
To get multiple spans, I may have to just write a few diffrent scans with difrfent spans.
for example,
C = MAXC120 and ABS(C / MAXC120.120 - 1) <= .03
C = MAXC120 and ABS(C / MAXC120.90 - 1) <= .03
C = MAXC120 and ABS(C / MAXC120.60 - 1) <= .03
C = MAXC120 and ABS(C / MAXC120.30 - 1) <= .03 that may show a difrent range of stocks more like, it is putting in a double top, 120 bars ago, 90 bars ago, 60 bars ago, and 30 bars ago.
Thanks
|
|
Worden Trainer
Joined: 10/7/2004
Posts: 65,138
|
I think you understand, but I can't be positive.
MAXC120 is the highest closing price of the bars running from 0 through 119 bars ago.
MAXC120.30 is the highest closing price of the bars running from 30 through 149 bars ago.
MAXC120.60 is the highest closing price of the bars running from 60 through 179 bars ago.
MAXC120.90 is the highest closing price of the bars running from 90 through 209 bars ago.
MAXC120.120 is the highest closing price of the bars running from 120 through 239 bars ago.
Note that MAXC120 is the highest closing price over the most recent 120, not the maximum high over the most recent 120 bars. That would be MAXH120 instead (it uses H for high instead of C for current or close).
-Bruce
Personal Criteria Formulas
TC2000 Support Articles
|
|
Registered User
Joined: 3/16/2016
Posts: 57
|
Okay, I see, that really helps now., thanks.
Yeah, MaxC, Could be better then MaxH because of price spikes (wicks), and could filter out some noise.
-I am not sure, if I should start another topic, but, I was also looking at that Fibonacci video-in wordens forms, and mabye it is cover in diffrent topics, but, its says it finds stocks retracing from the high within a "set time period"
Is the PCF capable of getting a 50% (or what ever%) retracement from the most recent Major piviot high and Major piviot Low. ?
|
|
Registered User
Joined: 3/16/2016
Posts: 57
|
I guess this may also be like a, A-B-C pattern, B to C is "50%" of A to B.
|
|
Worden Trainer
Joined: 10/7/2004
Posts: 65,138
|
You might want to take a look at the Swing PCF topic.
-Bruce
Personal Criteria Formulas
TC2000 Support Articles
|
|
Registered User
Joined: 3/16/2016
Posts: 57
|
Thanks Bruce, I will take a look. Have a good one.
|
|
Worden Trainer
Joined: 10/7/2004
Posts: 65,138
|
You're welcome.
-Bruce
Personal Criteria Formulas
TC2000 Support Articles
|
|
|
Guest-1 |