Registered User
Joined: 10/7/2004
Posts: 19
|
Hi,
Let's say I'm using (C <= 30 AND C >= 15) AND (XAVGC8 <= XAVGC34) and I am getting too many
stocks that are going down that can be shorted, like over 1000 (Not all are good candidates). Yet the
list is way to big. What criteria(s) ( a few possibilites if possible) that can be used to shorten the list and
still maintain the above expression. Someting more than just adjusting volume.
Thanks
RonS
|
|


Worden Trainer
Joined: 10/7/2004
Posts: 65,138
|
The trainers can't give setting, interpretation or investment advice. I will move this topic to the Stock and Market Talk forum where other traders are more likely to see it and comment.
-Bruce
Personal Criteria Formulas
TC2000 Support Articles
|
|

Registered User
Joined: 3/25/2005
Posts: 864
|
QUOTE (RonS) Hi,
Let's say I'm using (C <= 30 AND C >= 15) AND (XAVGC8 <= XAVGC34) and I am getting too many
stocks that are going down that can be shorted, like over 1000 (Not all are good candidates). Yet the
list is way to big. What criteria(s) ( a few possibilites if possible) that can be used to shorten the list and
still maintain the above expression. Someting more than just adjusting volume.
Thanks
RonS
You could throw in avg volume criteria like "where avg 30-day volume is greater than 1000000 shares for instance":
(C <= 30 AND C >= 15) AND (XAVGC8 <= XAVGC34) AND (AVGVOL30 > 1000)
NOT SURE ABOUT THE NOMENCLATURE ON THE BOLDFACE UP ABOVE
|
|
Registered User
Joined: 12/8/2004
Posts: 213
|
QUOTE (RonS) Hi,
Let's say I'm using (C <= 30 AND C >= 15) AND (XAVGC8 <= XAVGC34) and I am getting too many
stocks that are going down that can be shorted, like over 1000 (Not all are good candidates). Yet the
list is way to big. What criteria(s) ( a few possibilites if possible) that can be used to shorten the list and
still maintain the above expression. Someting more than just adjusting volume.
Thanks
RonS
It seems to me that if you are setting a criteria where the shorter term average close is less than the longer term average close you are going to be seclected stocks in a downtrend.
|
|

Registered User
Joined: 10/7/2004
Posts: 2,181
|
Or add criteria for stochastics below 20, below 20 for X number of days or Stochastics above 20 X days ago and down hard through 20 now.
Also think about moving averages and TSV. Stocks that haven't been able to get above the 50ma for example.
Also try some of the PCF's and scans that look for stocks trending, pick stocks that have been at the top of their range or channel then begin to move down.
Then, of course, their are great patterns, the 1-2-3 on the daily or weekly lows is a great way to watch for shorts.
|
|
Registered User
Joined: 1/28/2005
Posts: 6,049
|
In memorableproducts response the:
"AVGVOL30>1000"
would be:
AVGV30>10000
(for 1000000 shares(two zeroes are left off))
----------------------------------------------------------------
You say: "not all are good". The best thing
would be to define what's good (for you)
and put that characteristic in the scan.
Thanks
diceman
|
|
Registered User
Joined: 10/7/2004
Posts: 19
|
QUOTE (diceman)
In memorableproducts response the:
"AVGVOL30>1000"
would be:
AVGV30>10000
(for 1000000 shares(two zeroes are left off))
----------------------------------------------------------------
You say: "not all are good". The best thing
would be to define what's good (for you)
and put that characteristic in the scan.
Thanks
diceman
|
|
Registered User
Joined: 10/7/2004
Posts: 19
|
Hi,
What would the 1-2-3 pattern be for shorts?
Sounds interesting.
Rons
|
|
Registered User
Joined: 10/7/2004
Posts: 2,181
|
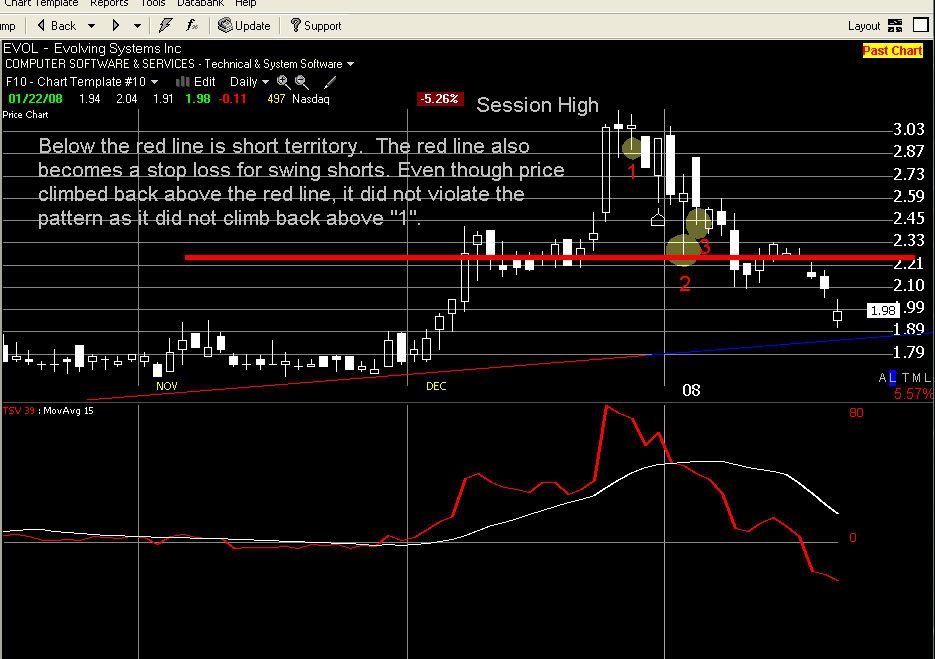
For shorting, find a session high (for example, price above and disconnected from ubb20 on strong volume) and label it 1, then look for a day, week, hour, whatever time increment you choose which has a lower low than the same time units before and after it, this becomes 2. This becomes your signal point. Once price rises above that but not higher than 1, then breaks below 2, you have your short signal.
Of course, one must take into account other pertinent factors and indicators. Shorting is not for the faint of heart, especially in these markets so, watch yourself.
Not the best explanation but I hope it helps. (Diceman will come along and in 10 words say better what I couldn't in 3 paragraphs.....how does he do that!
|
|
Registered User
Joined: 1/28/2005
Posts: 6,049
|
"Diceman will come along and in 10 words say better what I couldn't in 3 paragraphs.....how does he do that!"
------------------------------------------------------------------------
Lets see if I can meet tobydad's expectations:
(the word count starts now)
Yesterdays high is higher than today's and the
day before.
(10 exactly. Tobydad's crystal ball is in good working
order)
----------------------------------------------------------------
A PCF for this would be:
H<H1ANDH2<H1
Thanks
diceman
|
|
Registered User
Joined: 10/7/2004
Posts: 2,181
|
Just for clarity, Diceman's explanation would apply to going long; use lows and say,
Yesterdays low is lower than today's and the day before.
and you have the formula for shorting.
There, I did it in 10 words as well (what's a little plagiarism between friends?)
Seriously though, keep in mind that it doesn't necessarily have to be day 1, day 2, day 3. Point 2 might hit 2 days after Day 1 and the 3 might come 4 more days after Day 2. The more you use it the more you'll learn to recognize the pattern.
One other thing, the 1-2-3 remains valid so long as the 1 remains the session high (for shorting). So you could get a false signal that drops below 2 and then get stopped out on your short. As long as price doesn't climb back over Point 1, the pattern remains valid. Typically, if you've done your homework and read your indicators properly, the pattern will drop again below 2 and the 2nd or 3rd time may be the charm.
(Didn't I start this off with, "Just for clarity..."? Oh well...Diceman! Help!)
|
|
Registered User
Joined: 1/28/2005
Posts: 6,049
|
"Just for clarity, Diceman's explanation would apply to going long;"
-------------------------------------------------------------------
Now you lost me.
I thought you were talking about shorting
at the highs.
Based on these statements:
"scans that look for stocks trending, pick stocks that have been
at the top of their range or channel then begin to move down."
"For shorting, find a session high (for example, price above and
disconnected from ubb20 on strong volume) "
-----------------------------------------------------------------------
I thought you were talking about shorting at an
overbought level. With yesterdays high in the
123 being the cover point.
Since you are talking about lows. I guess you are shorting
on weakness thru the bottom of the range???
(a break thru support instead of at resistance)
Thanks
diceman
|
|
Registered User
Joined: 10/7/2004
Posts: 2,181
|
My apologies for being unclear; this may help.
|
|

Registered User
Joined: 4/18/2005
Posts: 4,090
|
I played with a version of the 1-2-3-4 buy and sell that was in "Advanced Trading systems" by Connors. I have this PCF left over from the experience. Actually allot of fun and helped me view opportunities and timing for oportunities in a different way than I had.
(H > H1 AND H1 > H2 AND H2 > H3) OR (H > H1 AND H1 <= H2 AND L1 >= L2 AND H2 > H3) OR (H <= H1 AND L >= L1 AND H1 > H2 AND H2 > H3) OR (H > H1 AND H1 > H2 AND H2 <= H3 AND L2 >= L3)
Plot as a %True to get a visual on what it picks up I also have my filtered adjustments on it
(H > H1 AND H1 > H2 AND H2 > H3) OR (H > H1 AND H1 <= H2 AND L1 >= L2 AND H2 > H3) OR (H <= H1 AND L >= L1 AND H1 > H2 AND H2 > H3) OR (H > H1 AND H1 > H2 AND H2 <= H3 AND L2 >= L3) AND C > C10 AND TSV18 < TSV18.3
the 1-2-3-4 BUY (filtered, the original is sans TSV requirements)
(L < L1 AND L1 < L2 AND L2 < L3) OR (L > L1 AND L1 >= L2 AND H1 <= H2 AND L2 < L3) OR (L >= L1 AND H <= H1 AND L1 < L2 AND L2 < L3) OR (L >= L1 AND H <= H1 AND L1 < L2 AND L2 < L3) OR (L < L1 AND L1 < L2 AND L2 >= L3 AND H2 >= H3) AND (L < L15) AND (TSV24 > TSV24.3)
This may or may not be the same 1-3 strategy Tobydad is refereing to .. but it sounds similar. The signal as I recal is any combination of 3 higher highs, or two higher highs and an inside day. I also want to say that he suggested that some other requirements be put on it as a trend filter. I use three moving averages a 20, 35 and 50... so shorts are only valid signals in the properly signaled trend. Connors was big on allot of his patterns requiring ADX to be in a certain position or the DI+/- lines to be aranged in up trend or down trend fashion to help thin out trades. I might also suggest only trading this acros a small list of groomed stocks for basic criteria... overall down trend, liquidity etc etc. Then look for the signals and trade them as they come.
I should also say that they are very short term time frame and intended for use ith really tight stops.. and conditional buy orders will help avoid some bad trades. I think 3-5 day hold is on the long side of the average hold time.
|
|
Registered User
Joined: 4/18/2005
Posts: 4,090
|
you might also filter them by making a scan for the signal and some basic liquidity and trend filters then sorting by a fast period of Williams %R or stochastics for that signal with low or high values of the indicator. Obviously low values for buys and high values for sells
|
|
Registered User
Joined: 4/18/2005
Posts: 4,090
|
Actually just started playig with this again.. pulled out some of the filters.
(H > H1 AND H1 > H2 AND H2 > H3) OR (H > H1 AND H1 <= H2 AND L1 >= L2 AND H2 > H3) OR (H <= H1 AND L >= L1 AND H1 > H2 AND H2 > H3) OR (H > H1 AND H1 > H2 AND H2 <= H3 AND L2 >= L3) AND C>C8 .
and I sorted my nightly short watchlist by it. IMO, SRCL, CBST, TLEO and DRYS are the only ones that come up .
IMO needs a day or so to cook
SRCL same.
CBST could be entered off todays low.
TLEO is a bit nervy and I have an open order for that one already from before.
DRYS could be enterable.. but i'd do it as a day trade. perhaps not. we had two weak up days perhaps a stronger down day is coming.
Most of these could be followed with your short order just under the low of the day (previous.)
h all those were the ones that had a true reading for the indicator sorted by above and had a reading of Williams %R of 50% or higher. The watchlist it's self were either picks that are generated from a different strategy but all in a down trend of some time frame. This strikes me as a great system for a very short term intuitive trader.... it didn't back test great as a mechanical system... straight anyway. BUT I had trouble programing stops as tight and the way I use them... It did backtest as proffitable though... the filters helped as i recal.
In the end I figured if you were going to prefilter for weakness or strength criteria and then follow the signal up with your order .. may as well take a slightly broader view and look for the general setup and bear the patten in mind while just generaly looking for a good candle entry.
Some where on thsi forum I did PCFs for several of his other patterns. Incedentaly yo ucan create a scan of watchlists. I have a scan that scans my nightly watchlist just for these patterns ... so If I wan't to go there first I can. Or you can plot it and sort any watchlist
|
|
Registered User
Joined: 10/7/2004
Posts: 19
|
THANKS ALOT
For your input. When I have something that appears to work I'll share it.
In the mean time I'll just be experimenting.
RonS
Anymore additions would be greatly appreciated.
P.S. Originally I was trying to short off the OVERBOT condition, when the stock was coming off
the Hi (or reversed for some reason). Short term trading is what I had in mind. (1-2-3-4-5 Day Trades)
|
|
|
Guest-1 |