Registered User
Joined: 9/22/2005
Posts: 849
|
apsll, Scott, hohandy
Do you have any opinions about these as shorts?
USU
CENT
FMP
BBND
ISLN
IPII
WPTE
I know you prefer higher prices stocks, but these look pretty good to me.
They have been in a pretty steep down trend for at least a month and a half which has been confirmed by TSV.
|
|

Registered User
Joined: 3/21/2006
Posts: 4,308
|
Bcraig, My knowledge in this area is very limited. They all look like they are in an over-sold condition and ripe for a bounce, especially USU.
Scott is much more knowledgeable with shorting stocks than I.
Good luck.
|
|
Registered User
Joined: 9/22/2005
Posts: 849
|
OK. Thanks, apsll.
|
|

Registered User
Joined: 3/25/2005
Posts: 864
|
bcraig --
I'm curious to know which brokers will allow you to short stocks that are priced below $5.00 like WPTE?
Thanks,
mp
|
|
Registered User
Joined: 9/22/2005
Posts: 849
|
mp
I'm not sure. I'm still psaper trading and haven't researched brokers to that extent ss yet.
At this juncture I'm still formulating my trading plan.
|
|

Registered User
Joined: 6/6/2005
Posts: 1,157
|
bcraig, I know you didn't ask, but I thought I would offer what little knowledge I do have about shorts.
1) I think it's just as bad an idea to look for shorts near 250 day lows after massive rundowns as it is looking for longs at 250 day highs after long run ups (these are different that quick burst run ups to 250 day highs as these are very tradable after consolidations).
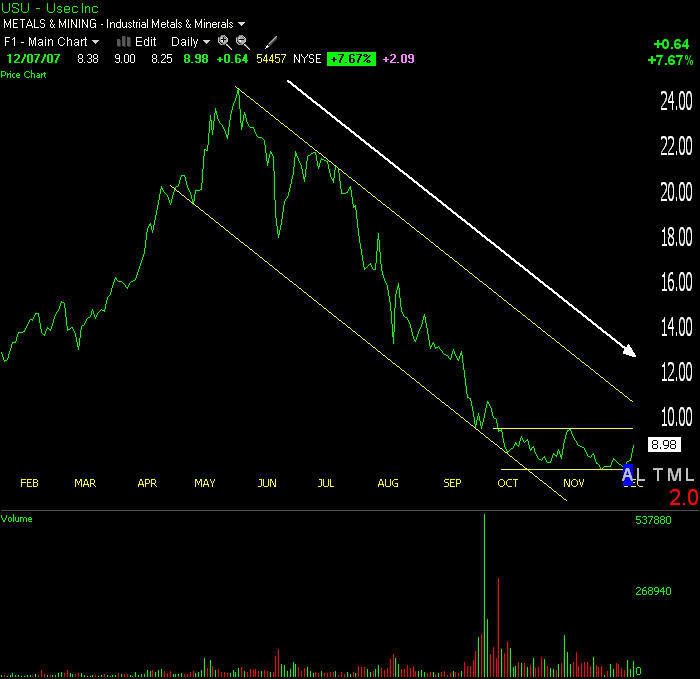
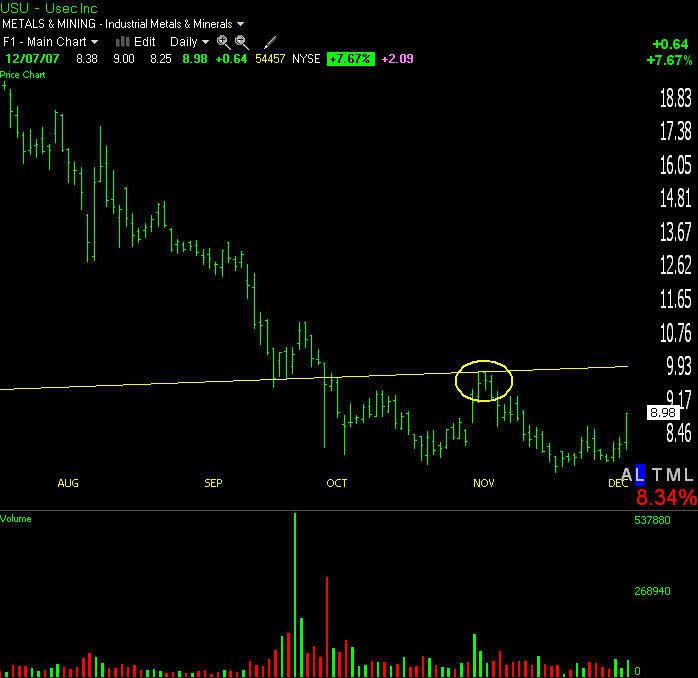
If you look at the chart of USU we see it has already plunged over 60% from it's highs.
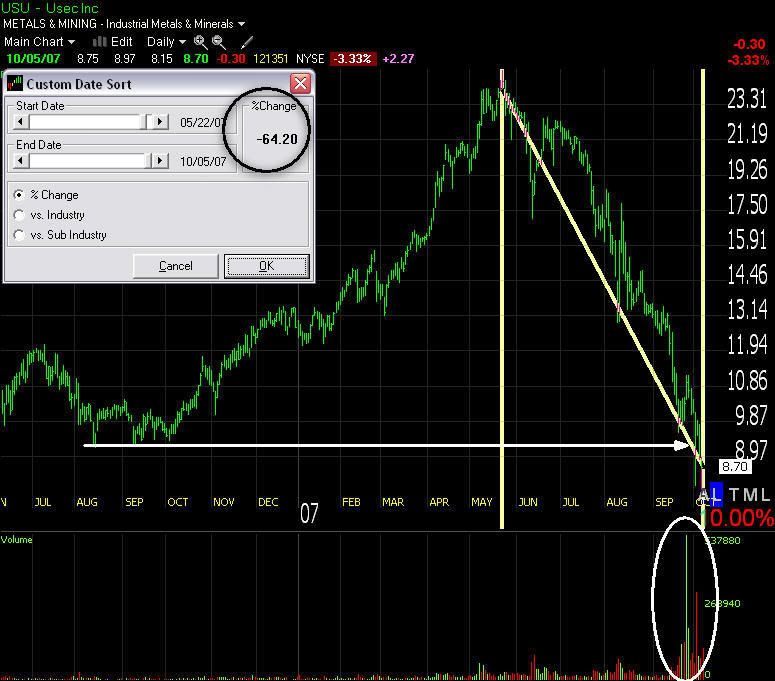
On longer time frames a level of possible support is also visible as USU is trading at the bottom of a channel.
As it appears to have broken the channel we may be in store for further lows, but I would wait for a retest first. Which brings me to...
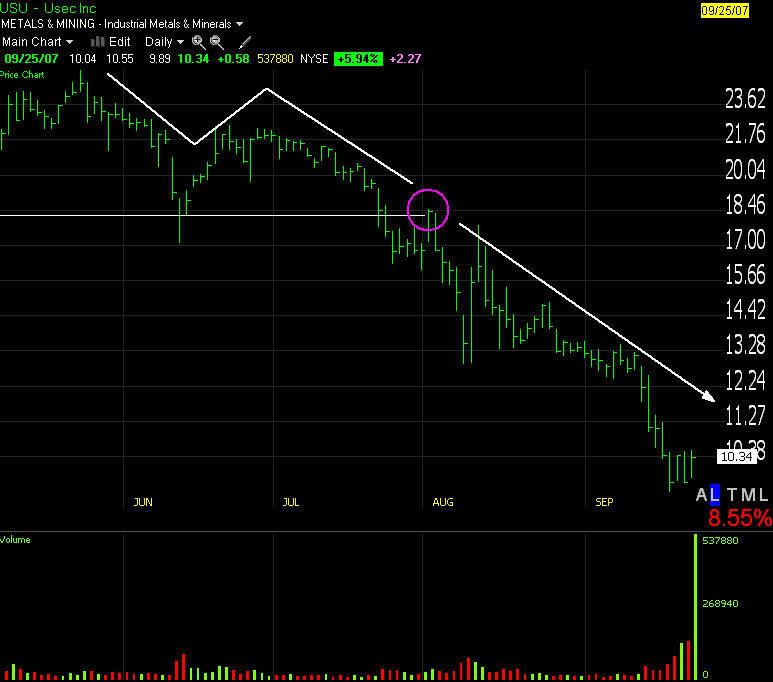
2) On up trending charts you should buy the dips. On downtrending charts you should sell the rallys.
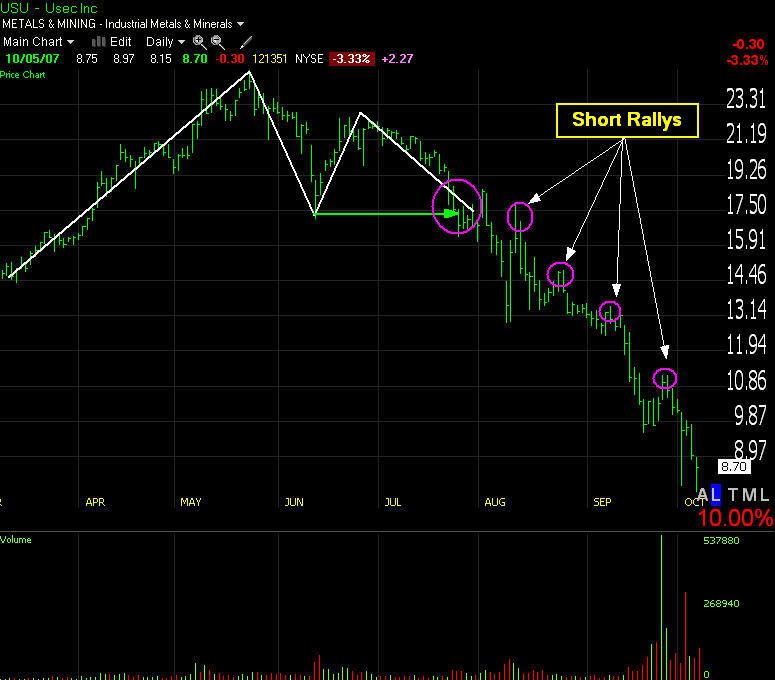
As you can see, this chart has already had numerous great entries to the short side and it may be a little late now.
This brings me to what I think is trully the hardest part of trading...reading what some call "The Hard Right Edge". Everything looks good over time...but the our job is to see what's happening NOW, and to place trades based on that information.
If you were go back to the chart closer to the time at when the decline was beginning you could have seen a few things.
First, that after a new swing low took price down past the prior uptrending swing pivot low, it failed to cross key fibonachi resistence levels...
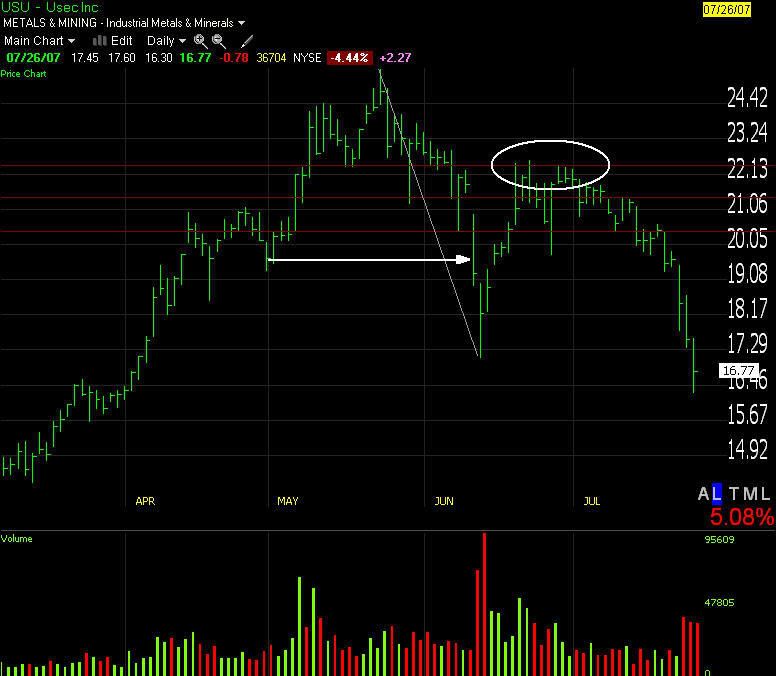
Also, we can see a head and shoulders top formation and a drop through the neckline on heavy volume. At that point the pending downtrend signals should have been going off.
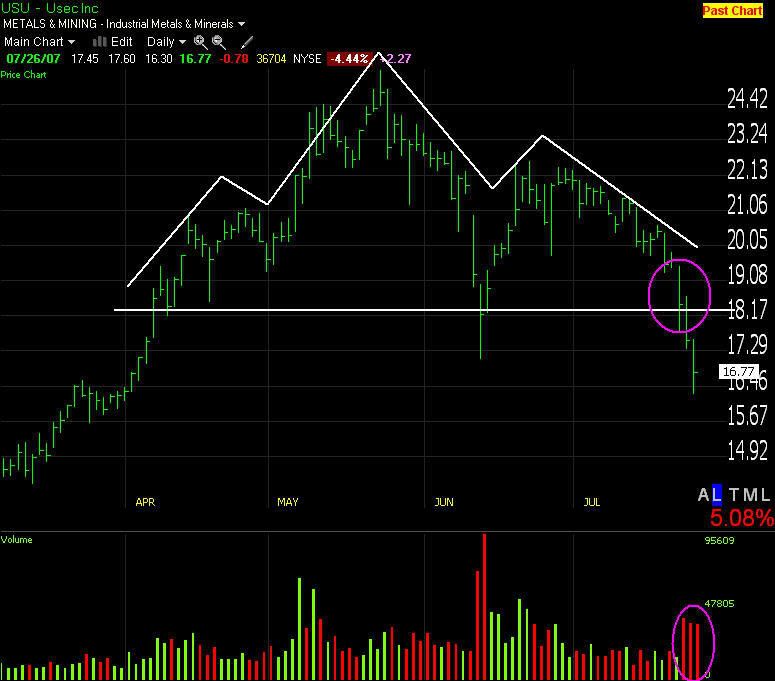
Now wait for a retest of the neckline and in you go...
Looking at the others on your list I see many of the same things.
Thanks for listening!
David John Hall
|
|

Registered User
Joined: 4/18/2005
Posts: 4,090
|
I'm not shure i'd look to go short just yet. I know what you are thinking but it could be higher risk right now.
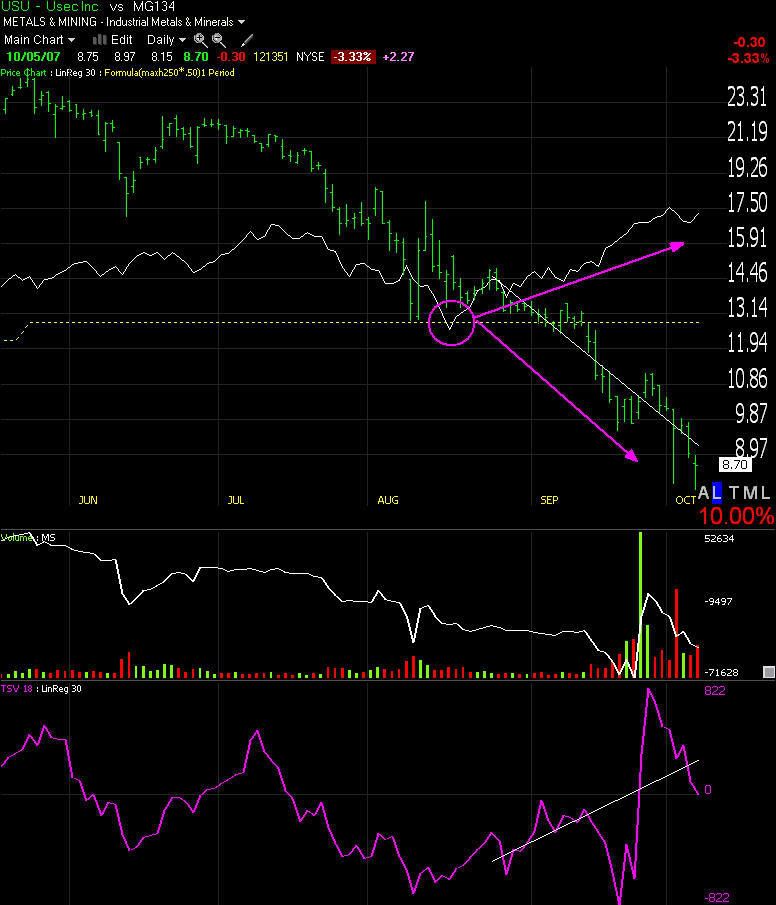
USU: I wouldn't touch with your 10' pole. the ideal time to short this was mid july and mid august. this is now over bought int he extreme IMO. you are getting surging BOP a surge of green volume during the decline and now a dragon, or hamer or what ever you want to call it. Pluss you have a mach d divergence going on. Is is a prime candidate to buy long for a counter trend bounce. I try to get my shorts nearer to the 20 bar moving average and I consider that a down trend is 20 < 50 and any return to the area between to be at an ideal short "sweet spot". the further away from the 20 the more likely I am to consider taking proffits or passing the trade. When shorting remember that there is alwayse more bullish pressure than ther is bearish preasure so yo need to be more careful. you'll have bargain hunters, bottom feeders and the buy to cover guys working against you the further down it goes. Pluss the market in general right now seems to be wanting to rise.
CENT: again IMO you are a day late and a dollar short here. this is flashing short term buy signals for a counter trend bounce trade. There is also the gap overhead that may want to try to fill.
FMP: same again...the big red day could be argued by some as a selling climax (over what time frame I don't know). you hve no positive divergences working agains you here except MacD/H which could be ok... BUT I'd wait to get in a little close to the range of the 20 exponential ma. It's just higher risk to me right now.
BBND could be ok.
ISLN: all those gaps would be a worry to me. If you consider it as moving with energy then these may be "runaway" gaps. and often a trend like this can end in an exhaustion gap and reversal. But if you are set on this one again i'd wait till it rallied a bit and then showed signs of running out of steam.
IPII: same thing this is on the move and looks like it wants to bounce here. The good thing is that many of these are showing weakness during a market ralley... so when selling finaly comences they may get a heavier dose.
WPTE triggered my greed reflex as an aspiring bottom feeder. Again this I see as making a move up of SOME SORT soon.
All the above said I'm not shorting as much now as I used to BUT soem examples of what I look for would be :
NYX:In april it gapped down and gave us a negative 20/50 (exponential crossover) In may it rallied up to the rang of of the 50 and then began to show weakness. the doji of 5/22 or 6/5 could be focus points and a trade could be opened as price falike to move up beyond those points.. BUT as yo can see the first time price actually consolidated. So if you have balls you could enter as price falls out of the "sweet spot" or play it a bit safer and during the consolidation enter a sell order that is good till cancelled slightly below the low of 5/24 as a sell stop or stop limit. This way you are in if price is gong in your direction... but you leave some $ on the table and if you get whipsawed then you'll feel it more acutely. However these dojis can be micro trend reversal signals as I've read in many book but IMO more often they are continuation patterns for resting days. the context you find them in would be important... in this context i'd look for them to be reversals of the micro trend. End of june you had a 2.22 down day and to me especially considering the previous decent then it's as good an excuse as any to take the proffits ... The next days engulfing white would be a nice place to put a stop slightly above if you weren.t already out the day before...several days later yuo get a doji string and the distance fromt eh 20 and the spread between the 20 35 and 50 are enough that id'd be inclined to move my stop up tight .. especially considering the previous large up day. If you wanted to play it a little looser then you could hold during the following move up and look to add to the position around the diji at the top... but you don't know it's a top then other than it's near the upper chanel or trend line... the BOP would call for a leap of fait that I probably woudn't want to make. Most of my short sales are les than 1 week.
this would be a down trend following aproach for me. I'd tend to try to employ this during a period when the indexes were clearly in a down trend, or the sector.
Possibly another aproach that MAY be more effective now is to capatilize on the proffit taking that shurely will ensure eventually after this move up. A counter trend short
NYX i'm considering donig this on now. Price shot up through all three moving averages but now vol is fading and TSV 18 has crossed down through it's upper bolinger band 13,13. Id guess that price wants to check in with the moving averge cluster. I'm waiting for this to go long for several months as there has been some positive divergence activity leading up to this move. Infact I had the order in my calculator and gighlighted on my note pad for 9/21 and then over slept. I try not to chase price if I don't get the entry I want so now I wait. But I think there is a possible short oportunity here. Actually this is still in a down trend and has rallied to the upper limit of it's range... It's MY Opinion that this will be the begining of the bottom. aprticarularily if you consider thier competition NDAQ recently reversed with momentum
CMED: a counter trend trade. In June price gapped up and continued to rise as TSV got weaker and MACD/H begand to show weakness adn short term divergences by mid July. this may not be teh best example but there were other divergences to the down side that continue to this point (but I'm not gonna say short it, but it does fit my basic model). After 7/17 i'd be watching this for entry.. may have even tried but suden complete reversals don't usually hapen over night (the circumstances of the day aside), unless there is major negative news 7/24 is another sign of weakness and the trade could be opened off that candles low with a target somewhere between the 20 and 50. Aim for the 50or better but be prepared to take it at a sign of trouble. Idealy you would want a Moneystream divergence as well ... I think moneystream divergences tend to be more significant than TSV ones.
There is a video on using sorts to spot divergences under training videos. you are looking for IMO stocks that have made stupid huge gains and continued to do so with fading indicators. the further price is from the 20 the better and look to take proffits around the 20. Moneystream, Stochastics, volume and macd negative divergences need to be there and clear..... no squinting to see it.
a better example might be HAS between may and July. I missed this move but it would have been great.
|
|
Registered User
Joined: 6/6/2005
Posts: 1,157
|
The more I look at USU the more I am seeing a buy candidate, and one I might actually pick up. It's trading below my beloved 50% line -- there's a TSV divergence going on, and it's in a sector that's been doing well since the mid-Aug bottom.
Now, USU hasn't done well since the low, but was one of the leaders before the June decline. I have checked the other leaders and they are also down heavily with the exception of AKS.
in my opinion, this could mean one of two things. The current rally is a fake out...or these stocks have been slow to turn around and will very shortly.
So I decided to take a closer look. On the hourly chart there's a nice bullish macd divergence...
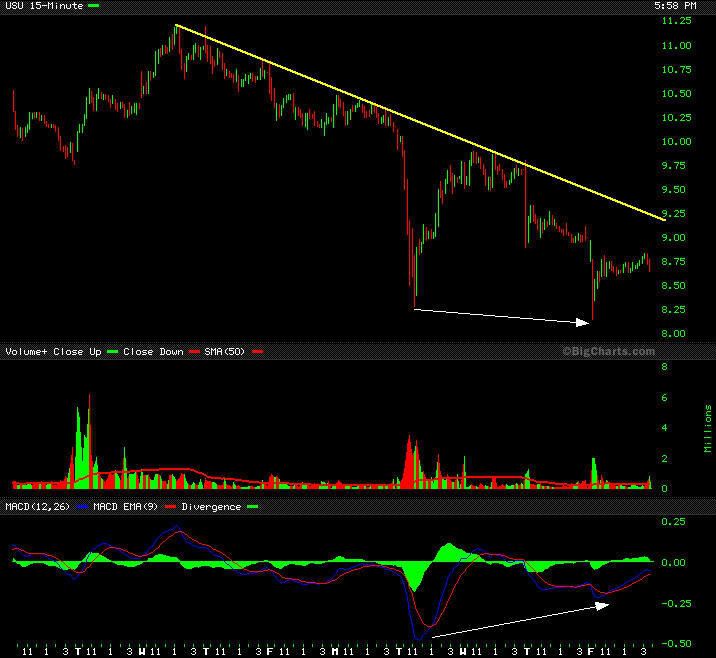
And it looks like someone is buying all of the dips.
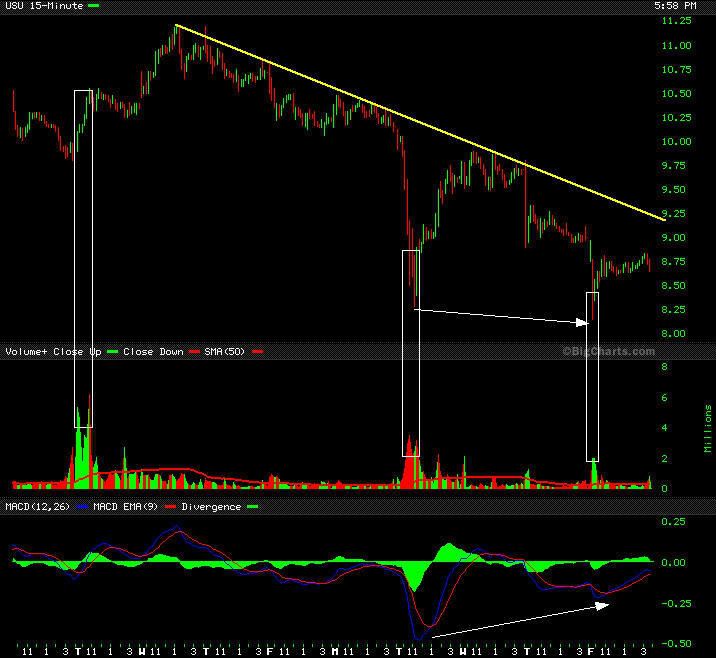
This could be short covering or new shorts.
My plan here is to enter on a break of the hourly downtrend line.
Also note, USU is on the top 5 biggest increase in short interest list. This could mean massive things if the resolution is to the upside as shorts scramble to cover their positions.
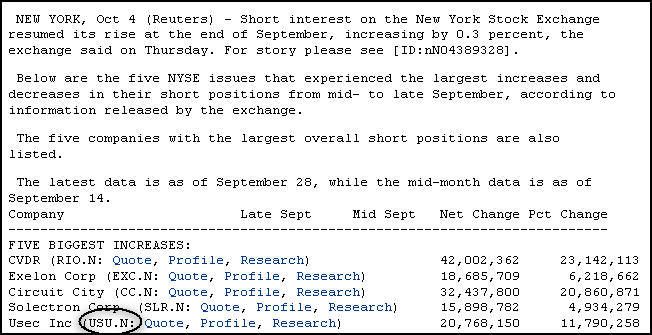
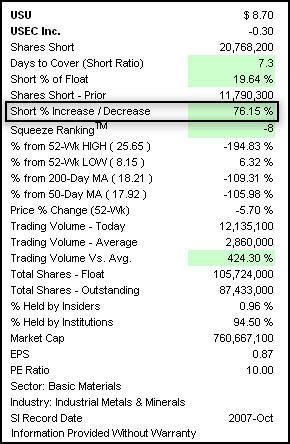
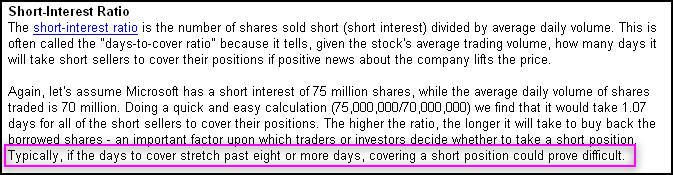
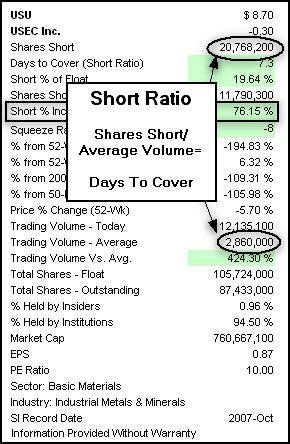
As USU is at a ratio of 7.27 things could look very interesting!
Let's see what happens. Either way I'll learn a lot.
David John Hall
|
|
Registered User
Joined: 9/22/2005
Posts: 849
|
Scott and David
I appreciate your comments and analyses of those stocks. This is what I was wanting. I chose hose -particular ones because if their having been in long down trends. I had a suspicion that it might be too late to consider shorting them, which you confirmed graciously without saying “Why are you looking at these, DumDum?”
I particularly appreciate your detailed analysis of USU, David. It has given me some insights into some of the pitfalls associated with shorting. I always learn a great deal from your detailed analyses. (BTW about twenty years ago I knew a John Hall in Oklahoma City.)
I also like your take on the possible bullish aspect of USU and will add it to my watch list for possible buys. Is it possible (probable) that when it breaks the down sloping trend line that it may do so with gusto?
Scott and David
I appreciate your comments and analyses of those stocks. I chose hose -particular ones because if their having been in long down trends. I had a suspicion that it might be too late to consider shorting them, which you confirmed graciously without saying “Why are you looking at these, DumDum?”
I particularly appreciate your detailed analysis of USU, David. It has given me some insights into some of the pitfalls associated with shorting. I always learn a great deal from your detailed analyses. (BTW about twenty years ago I knew a John Hall in Oklahoma City.)
I also like your take on the possible bullish aspect of USU and will add it to my watch list for possible buys. Is it possible (probable) that when it breaks the down sloping trend line that it may do so with gusto?
|
|
Registered User
Joined: 6/6/2005
Posts: 1,157
|
Anytime Bcraig,
One of the many things I enjoy about this message board is that you will rarely, if ever, encounter rudeness associated with requests for understanding and/or insight. Good luck, and ask away. I learn something new with each post I read and certainly those I respond to.
Good luck!
David John Hall
|
|
Registered User
Joined: 4/18/2005
Posts: 4,090
|
"I appreciate your comments and analyses of those stocks. I chose hose -particular ones because if their having been in long down trends. I had a suspicion that it might be too late to consider shorting them, which you confirmed graciously without saying “Why are you looking at these, DumDum?”"----
no problem.. it helps me to think and articulate my way through these things. Often i'm flipping thgough charts and it catches me or not... and that is as far as I think on it.
Hey for many months I was the master at buying tops while thining I was following a trend. What I see hapening here is the inverse same.
|
|

Registered User
Joined: 3/1/2005
Posts: 34
|
I don't like to sell shorts; I believe buying put options profit from the downside with a lower risk.
|
|

Registered User
Joined: 10/7/2004
Posts: 2,181
|
bcraig,
Try adding to your tool set LR30 on price. It's a very simple but effective indicator to help you spot or confirm shorts/longs. LR30 under candle = support (do not short); LR30 over candle = resistance (consider short).
Of course, many other factors, but this told me right off the bat the basis for even beginning to consider your list. Interestingly, my thoughts lined up with Scott's analysis (didn't read every word but looked pretty much the same).
Again, it's not a magic wand, but it is very useful as a quick sighting tool.
|
|
Registered User
Joined: 9/22/2005
Posts: 849
|
Tobydad
Some time ago I picked up om the Lin-reg from a post by David John Hall. I particularly like the 63, 21, and 10 day regressions.
I like the 21 day for picking up divergences.
|
|

Registered User
Joined: 12/31/2005
Posts: 266
|
basically craig use 3 time frames in analysing stocks. longest time frame determines trend(trade with the trend, mostly), i.e. the weekly
next lower timeframe use to key or trade off, i.e. the daily
the smallest timeframe is used to examine the microtrend, and help time your trade. i.e. the hourly or 15 min.
consider going countertrend, when indicators, i.e. stoch, macd, are showing overextended on longerterm time frameie weekly, good longterm support is near, while divergences are showing up on time timeframe used to trade off,ie daily. then look for reversal formation on smallest timeframe to form, and consider buying breakout.
good luck.
|
|
Registered User
Joined: 4/18/2005
Posts: 4,090
|
David John hall.. did you get into this?
The current candle pattern is a "Springboard" which I've had good sucess with in the past. I've also been slapped silly buy it . context is the key... If you look at it and put this somewhere in an up trend with a bit of age behind it just lacks the equaly big or bigger reversal bar and It's a "fake and bake" ! In this context I think I's valid. I personaly hate seeing that so much is gone on one candle but ther could well be more.
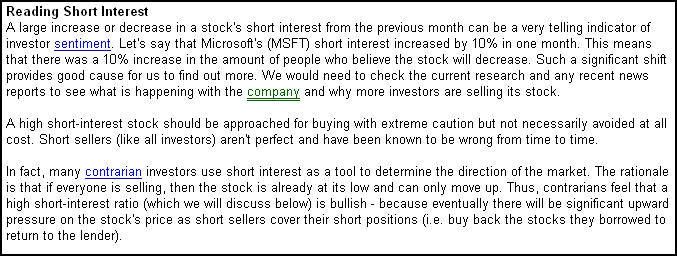
I alwayse seem to learn something from your posts. I am reading Fosbacks "Stock Market" logic... and a huge portion of it is commited to trying to guage general market reversals throughfundamental indicators. I think there is something there on the Short interst across the average of the component stocks as a general market measure. That bit you placed above seems to make a perfect sort of "market sense".. in the same way that the market sentiment index should be read in reverse (though at the midpoints the crowd of advisors will generaly be right). But it's senseable actually ... particularily in the above case... with the volume surges at the bottoms. this is quite interesting for a long entry.
|
|
Registered User
Joined: 6/6/2005
Posts: 1,157
|
Hey Scott,
No, I didn't. i can't remember why at the moment, but I think it had something to do with the long term down trendline not being broken. It's interesting how something can look one way on the short term chart and a completely different way on the longer term chart. Here is the trendline I saw on the daily chart.
So that kept me out of it. Price is approaching the down trendline again. Would that be a time to go long or short? i have no idea. I did look into the short interest ratio again and it looks like short interest has actually increased.
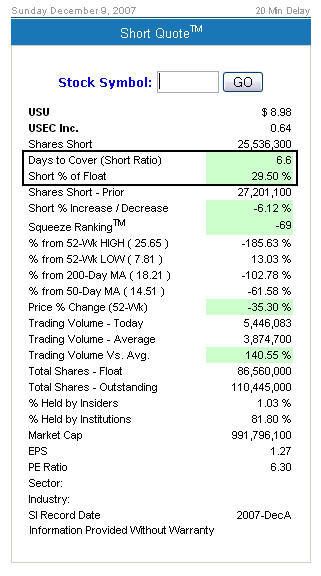
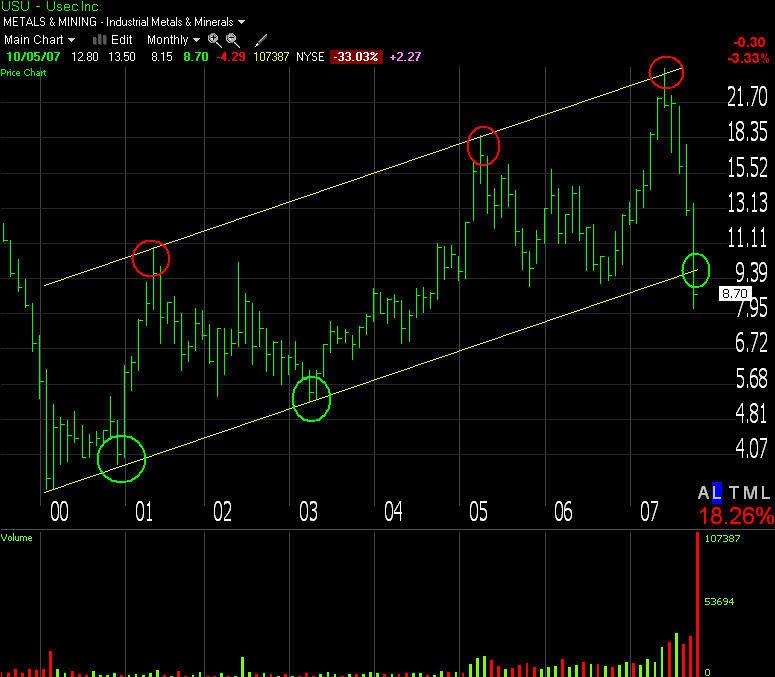
Then I looked at the monthly chart. That chart does not look good for new positions. But that's just my opinion. Of course, it also depends on which way you're going. Looking at that long term trendline on the daily chart i see that price did come back and reconnect with it...
And so short term you might get a trade back there, or wait to see what volume activity is like once/if price does get there to determine if that would be a good place to go long or short.
Good luck!
David John Hall
|
|
Registered User
Joined: 5/1/2007
Posts: 158
|
USU is a politically-connected company. For a long while it was run by Clinton administration insiders. Haven't looked at latest management changes. When I looked at it, it was taking bomb-grade uranium (US? Russian?) from actual warheads and converting them to peaceful use. Don't know who the purchasers were. Would be good to research, but I am leery of going either long or short a stock like this.
Maybe the market was Iranian reactors, and product is not getting shipped. Fundamentals do matter, especially in such a market. Latest big sale to Korea Hydro. Is that South Korea? Main competition French enrichment.
|
|
|
Guest-1 |