Registered User
Joined: 3/16/2006
Posts: 2,214
|
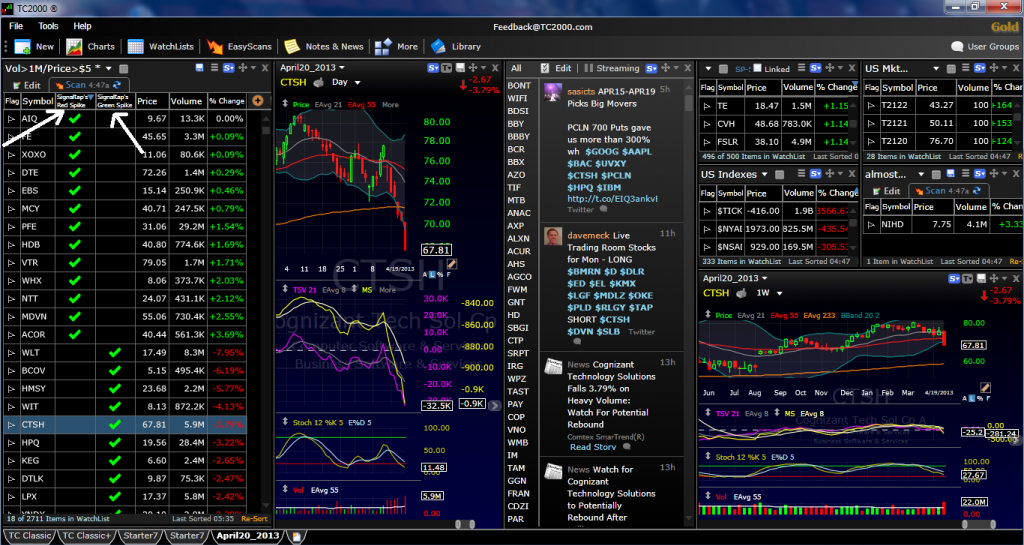
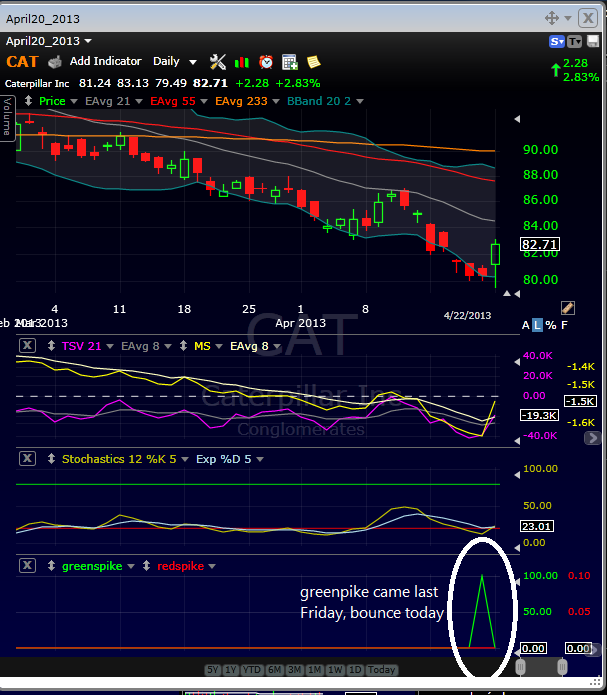
green spike oversold and ready to pop:
L<((3.05*MINL15.7)-MAXH7.3)/2 AND STOC12.5<10 AND L<L1
red spike overbought and read to comedown:
H>((2.95*MAXH15.7)-MINL7.3)/2 AND H>H1 AND STOC12.5>90 AND TSV3<TSV8

|
Registered User
Joined: 3/16/2006
Posts: 2,214
|
I've tried several times under "NEW" then "condition PCF formula" but it wont save my indicator and then paste it onto a chart, thanks in advance, Signaltap
|


Worden Trainer
Joined: 10/7/2004
Posts: 65,138
|
You need to enter them as Custom PCF % True Indicators instead of as Condition Formulas. Select Add Indicator from the top of the chart and choose Custom PCF % True Indicator from the list of indicators.
Adding & Moving Indicators
-Bruce
Personal Criteria Formulas
TC2000 Support Articles
|
Registered User
Joined: 3/16/2006
Posts: 2,214
|
thanks Bruce, I did it!

|


Worden Trainer
Joined: 10/7/2004
Posts: 65,138
|
You're welcome.
-Bruce
Personal Criteria Formulas
TC2000 Support Articles
|