Registered User
Joined: 3/16/2006
Posts: 2,214
|
First of all, here is the link on CROX short-term:

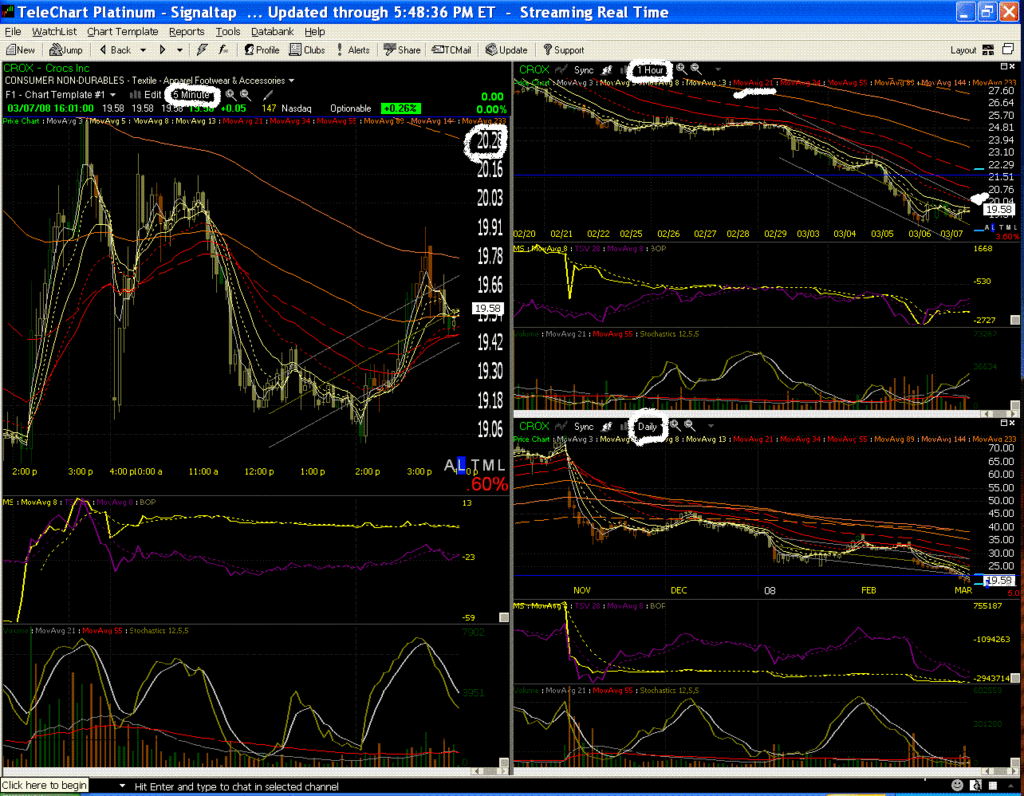
the image , so you can see a 5minute, hourly and Daily charts in one image
Looking closely, I think CROX is getting way oversold on the daily chart ( look @ stoch's) . Looking at a 5 min chart I see a possible low @ 19.06 (maybe in the a.m. Monday 3/10 ) and the 233 EMA is @ 20.28 to be the top for the next plunge! (eventually heading to $10-$11 area long-term)to corroborate this, look @ the 60 min chart and noticed that the 21 EMA is near that price too (20.21).
So, simply put, a short drop in price on monday @ near $19 flat , then a pop on low volume, then short again @ the 21 EMA hourly now @ 20.21 area (233 EMA / 5 min chart) to which will sink into new lows!
Thanks for your time , Signaltap ( TC Net club: Signaltap2, a free club) http://www.signaltap.com
|
Registered User
Joined: 12/31/2004
Posts: 57
|
Signaltap, you called that one right on the money. In with Aprils puts, marches are too close in. Spy puts are looking good for trading intraday.
|