| Welcome Guest, please sign in to participate in a discussion. | Search | Active Topics | |
Registered User
Joined: 4/3/2005
Posts: 91
|
Bought today at 7.81, not the best, but chart was looking very good to me.
|
|
Registered User
Joined: 4/3/2005
Posts: 91
|
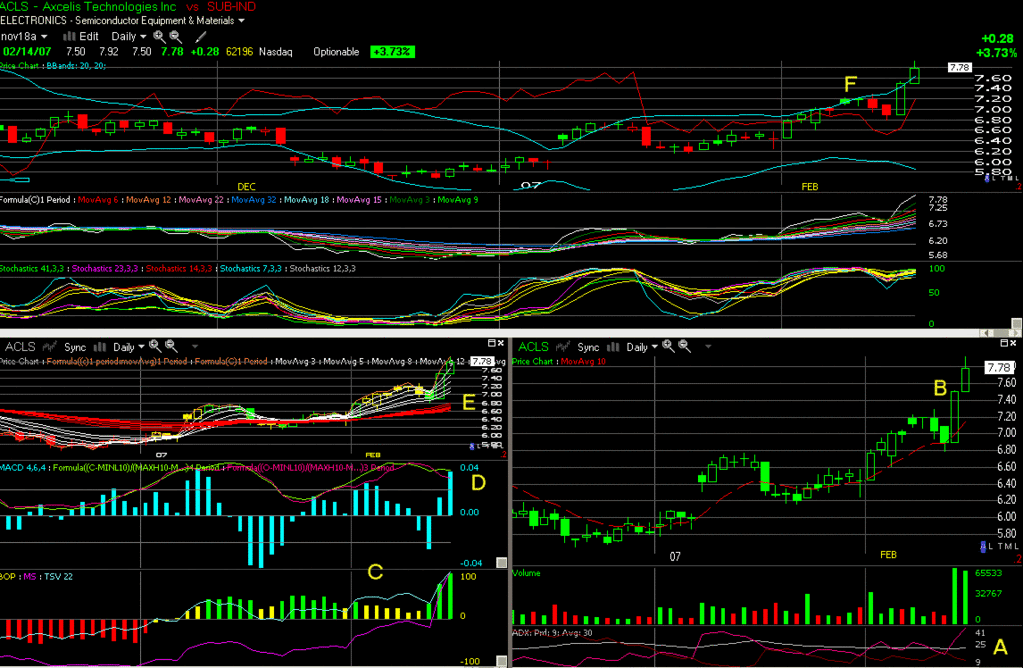
Tobydad in another thread asked for someone to put up trades for others to critique. aspll responded with GOAM, so in the spirit of sharing, I present ACLS which I purchased today. Below is the daily chart, with the indicators which caused me to try it. I don't know how this will work out, so I might look good or OK or bad, but I would do the same thing even if I didn't tell anyone. Some would find the chart cluttered, but it works for me :)

A) MDI+ ( fuschia color) sharply up
B) Candlesticks when I bought were looking better mid-day, but I don't consider todays candle as a shooting star as I feel the body is too large. "sometimes a cigar is just a cigar". Never the less,this along with (F) 52 wk resistance about 8.20, will make me watch closely and see if it bounces off or passes through tomorrow. So stop is at 7.45 currently.
C) BOP,MS,TSV all up
D) MACD is +
E) HNC ( Guppy) seems acceptable to me.
I will update when I change position. Hope this is interesting so others might put up case study :)
|
|

Registered User
Joined: 10/7/2004
Posts: 2,181
|
It's just made it over a resistance (now supporting) trendline drawn from the highs
of 2005 thru the highs of 2006 and on to now. Today's price has support from
yesterday's. A nice orderly climb should enable a 10% move upward over the next
few weeks. I'm guessing we'll see a pause at that point. A strong move over that resistance
at around 8.80 or so and on strong volume could mean a real nice
move up from there.
I appreciate jpendly and apsll for putting there trades out for us all to evaluate.
Offering my thoughts, receiving feedback (positive or negative, it does not matter)
and hearing (reading) the thoughts of others will certainly help me improve my game.
I encourage others to remark on why they like or dislike, feel comfortable or uncom-
fortable, etc on these "case studies".
|
|
Registered User
Joined: 4/3/2005
Posts: 91
|
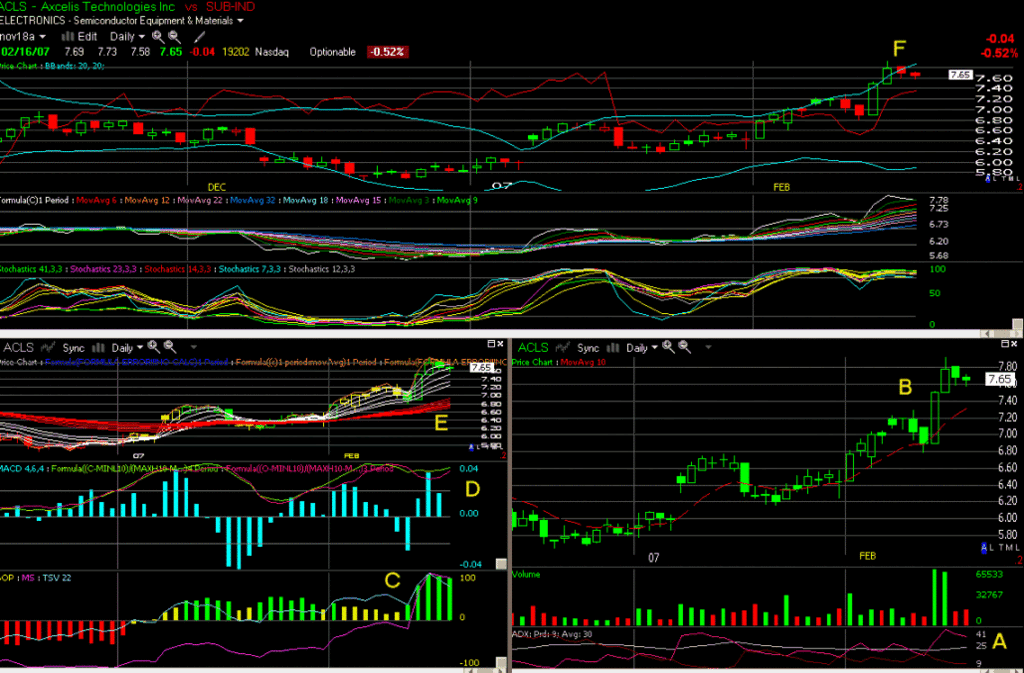
Sorry I didn't update yesterday, but very little happened IMO. so will continue today. I hope this is helping somebody a little bit,
as to how different people consider each change. All opinions are mine, but I would be happy for comments :) so I can learn also.

A) MDI+ moved down a little, but still high enough for me to have interest. Volume last 2 down days much less than 2 previous up days, a good sign IMO. I don't mind a breather period.
B) I DON'T like the developing candle pattern. Almost bailed out today, but thought I would wait as most indicators still favorable. If 3 black crows or other confirming down pattern occurs, I will probably exit.
C) BOP, TSV, MS still very good
D) MACD better than I thought it would be.
E) Multi EMA still orderly
F) The stock hit the upper Bollinger Band yesterday and bounced under it today. Sometimes I wonder if indicators mold a stock more than reflect it :)
Anyway, still in and waiting. Fundamentals seem even better as they have announced orders since the 14th. Good trading to all.
|
|
Registered User
Joined: 1/29/2005
Posts: 104
|
This stock is in an ascending wedge/triangle since Nov 05. It comes up to the same high (@8) and each low has been increasing. This is a powerful bullish signal if it continues. I'd look for the breakout about 8 to get into it. As to the short term look, it still seems to be in an uptrend, but it's in an overbought area right now.
t gapped up in early Jan and has taken a couple of breathers along the way. Right now, it could be taking another breather or it could move down to the support line. I learned that you can't predict what a stock will do, but you can watch and be prepared to act once it makes up its mind...
If I were long on ACLS, I'd stay long until it dropped through the low of Wed (7.5); if I weren't in it yet, I'd wait until it broke through 8 to get in.
Hope this helps.
Good trading!
|
|
Registered User
Joined: 11/11/2006
Posts: 359
|
Good Morning,IPENDLEY:
In reference to your post regarding ACLS and your request for feedback, I will therefore offer my humble observation.
Since its gap down of 12/8, ACLS has been in a quite well defined uptrend channel. As of 2/13, the upper channel trend line has been breached and the stock is retreating. This is consistant witn the previous high of 10/16/06, the left of the cup,if you will. This high is now the resistance and ACLS has not penetrated this. The two resistance points were quite close and appear to be quite strong.
I do not notice any particular weakness in any of the usual indicators. I do not notice any particularly encouraging signs of unusual strength, either.
The candlestick formation of the last two days may be the third day of a Mathold or Rising Three continuation pattern. Should ACLS break much below the low of the candle of 2/14, it would destroy the Continuation candle pattern, as well as the support offered by the upper trend line of the channel. I would not be surprised to see it fall to the lower trend line of the channel for support and reentry point.
Trade what you see and not what you believe. ACLS is acting normally for a stock that was unable to penetrate the resistance offered by its previous high.
A good thread
If you cannot stand up on your two hind legs, and rationally explain your actions and decisions to a group of strangers, you have probably not made good actions, or decisions. I do this looking out the window and rationalize aloud to myself why I am doing what I do. Sometimes, even hearing it from yourself, its hard to justify.
Good trading and I thank you for your invitation.
Mammon
|
|
Registered User
Joined: 4/3/2005
Posts: 91
|
lpark and mammon, thank you both very much. I do agree that the bottom of the 14th candle is an important line. It was the reason that I put my stop there. If it is penetrated, I will exit and put the stock on my "owned-stop" list and wait for better times. I also feel that it is in "twilight zone", not really scary nor up to the expectations of before, and I think all three of us rather agree that it might be taking a breather..Nison's candlestick book refers to the Rising three pattern as a "breather" also. The encouraging part is that the indicators haven't broken down badly, just lessened IMO.
This thread has taught me to FOCUS more on each stock and reduce the risk factors to acceptable levels. It is an interesting project for me and I would recommend that people try it at least once. It is very different than taking a tutorial class where the examples have already happened and hindsight is "always profitable" and easy to see. Mammon, I do LIKE your talking to the window. Thanks to both and good trading. Jim.
|
|
Registered User
Joined: 2/18/2007
Posts: 5
|
I agree with lpart, the stock should nicely consolidate on lower volume before committing. If the other resistance at $8.20 is won, we could potentially see a nice +20%.
Cheers
G.
|
|
Registered User
Joined: 4/3/2005
Posts: 91
|

I am still in, but normally wouldn't have been.
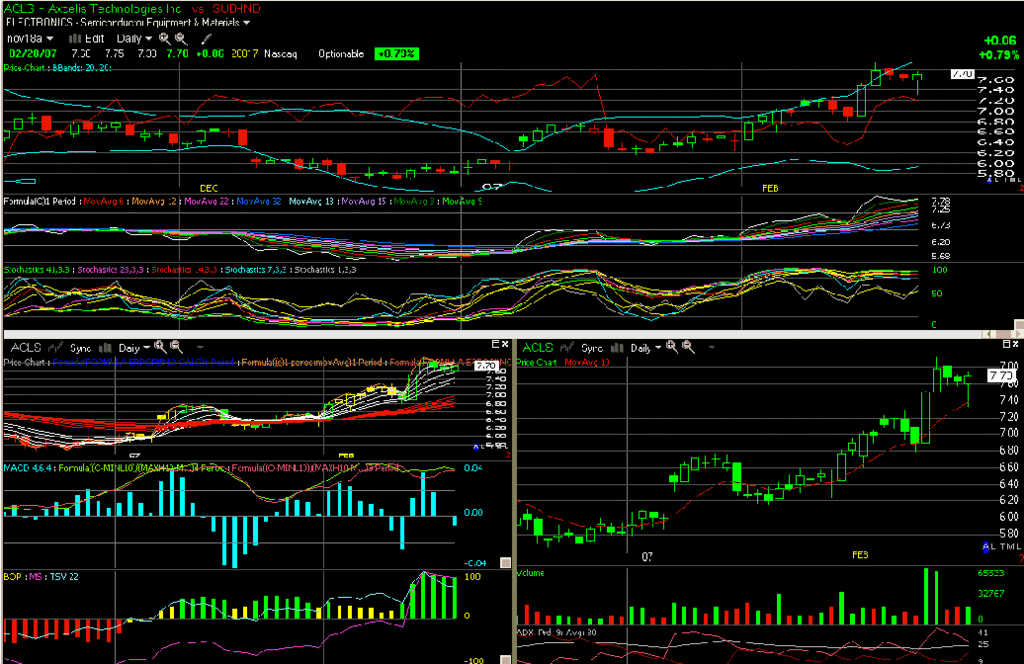
In the early trading, I saw ACLS starting to move down to my stop and decided to end it a little early and save a few points as I had lost my faith since it looked like it would violate any good candle pattern.So I had my order up to change to the current price and then an emergency call came and took my attention away from the order. Short story, by the time I realized I had not changed it, the pps had dropped to 7.33 and started up again, so I let it ride up and I will decide tomorrow. But since I would have stopped out,
I will close the thread. It has been fun. Hope it helped.
|
|
|
Guest-1 |