Registered User
Joined: 6/22/2008
Posts: 65
|
Is it possible to plot the value of the closing price - (say) 2*ATR as an horizontal line?
Thank you.
|

Administration
Joined: 9/30/2004
Posts: 9,187
|
Right click on the price scale and select Add Horizontal Pointer. Now right click on the pointer and select Block Diagram. Add and connect the blocks as illustrated below:
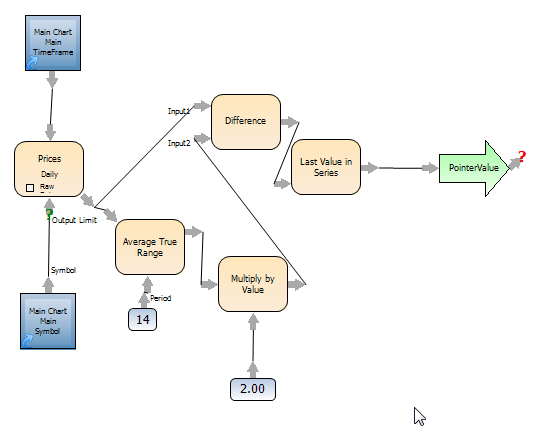
Attachments:
marcoATR.png - 23 KB, downloaded 1,167 time(s).
|