| griego |
|
Gold User, Member, TeleChart
|
| Registered User |
|
|
|
|
| Unsure |
|
| Friday, January 14, 2005 |
| Thursday, April 25, 2019 3:59:23 AM |
7
[0.00% of all post / 0.00 posts per day] |
|
Bruce:
Regarding your post below, is there a way you can e-mail me your configuration for this setup so that I can incorporate it into my program?
Griego
QUOTE (Bruce_L) I'm really not sure what is happening since when I have what appears to be an identical Block Diagram, I get a different coloring for what I think is the same span of time for the same symbol. You might want to try changing the Crossing Up Through back to an Above and the Crossing Down Through back to a Below as it should return the same results in this case.

|
Can you give me the pcf for Relative Strength not Wilder's RSI?
Thanks in advance.
|
|
Craig:
What would the pcf formula be if it were exponential?
JVG
|
|
I cannot figure it out.
|
I am trying to create a scan with a market capitalization of $500,000,000.00 or less. On the Volume pcf criteria, for the value, what do I use-- 500000000 or 5000000.
Thanks.
Griego
|
Thank you very much. Your help is greatly appreciated.
Griego
|
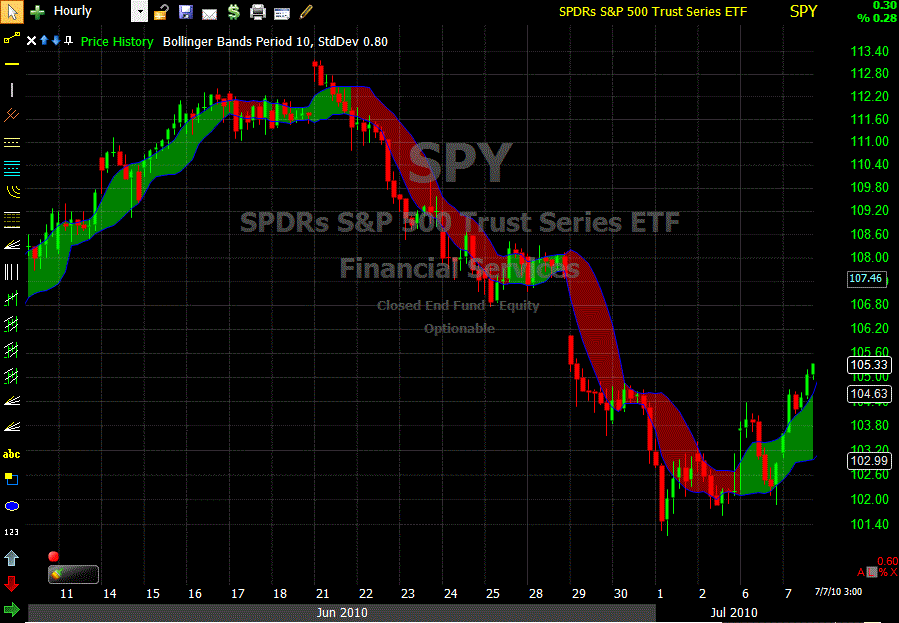
I am trying to set up Bollinger Bands in my Price Bars.
John Bollinger recommends a 20 day Moving Average with the outside of the bars being set 2 standard deviations above and below the moving average. How do I accomplish this with TC when it is asking me for a moving average and then the width of the bars? I do not understand what they mean by width.
Please help.
Griego
|
|