| shirodka2 |
|
Gold User, Member, TeleChart
|
| Registered User |
|
|
|
|
| Gender: |
|
| Thursday, April 14, 2016 |
| Friday, May 26, 2017 11:04:38 PM |
11
[0.00% of all post / 0.00 posts per day] |
|
|
Oh wow, I need to check out v17 properly, thanks!
|
|
Hi Bruce,
Could I request a PCF to calculate the average of the ATR(14) for the preceding 3 months (last 60 market days?) that returns a number that could be added as a column in a column set?
Many thanks!
Cheers,
Lawrence
|
|
It works perfectly now, many thanks Bruce!
|
|
Hi Bruce,
Thanks for the workaround! Following your instructions, I've added pair of indicators to mark out the gap downs and gap ups but the dots appear either way above or below the relevant candles rather than half way through the gaps. Any idea what I could be doing wrong?
Tks,
Lawrence
|
|
Hi Bruce,
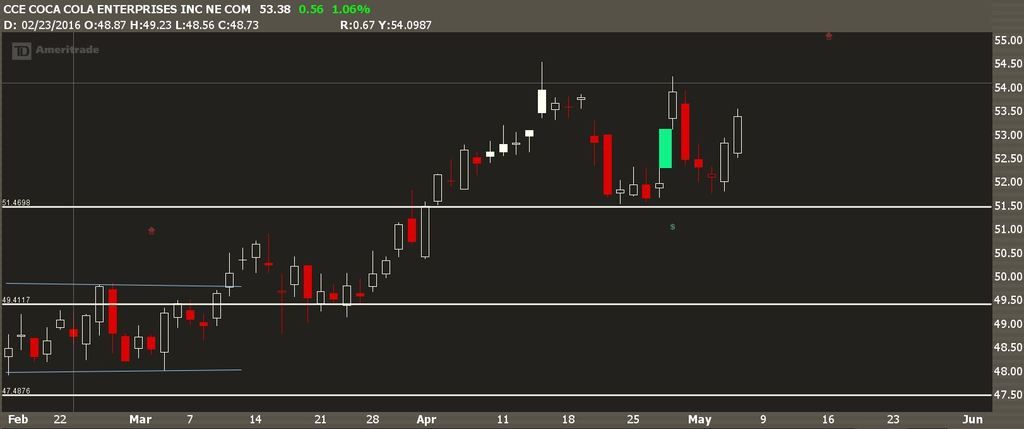
Referring to the chart below, price gaps are automatically highlighted in green. (Earnings with the $ symbol). I am supposing TC2000 doesn't have these features natively? These are very useful featurs to include if they don't already exist.
Tks,
Lawrence

|
|
Hi,
Is there a way to highligh price gaps on a chart, similarly to how ThinkorSwim does it?
Tks,
Lawrence
|
|
Oh I see. Tks anyway.
Cheers
Lawrence
|
|
Hi Bruce,
Would it be possible to create a PCF formula that checks if the next earnings release (i.e. the date in the next earnings watchlist column) is less than 7 days away from the current date?
Tks,
Lawrence
|
|
Thanks for clarifying Bruce.
Cheers,
Lawrence
|
|
Hi,
Would like to ask for the PCF formula to calculate the float turnover for a stock i.e. "Latest Float" / AVGV60?
Any help is much appreciated, tks!
Cheers,
Lawrence
|
|