| Welcome Guest, please sign in to participate in a discussion. | Search | Active Topics | |
Registered User
Joined: 6/25/2008
Posts: 4
|
Hi, I'm trying to screen stocks based on their highs and lows during different time frames. I have created two indicators, one in a day-chart and one in a 15 min chart. Each chart has its own copy of the following indicator:
Dim hi As Single, lo As Single
hi = Price.MaxHigh(Price.count - 1)
lo = Price.MinLow(Price.count - 1)
plot = (price.Close - lo) / (hi - lo)
I have then dragged each indicator to the watchlist to create sortable columns. THE PROBLEM: the numbers in the indicators don't agree with the numbers in the coumns. (Example: for stock LUV, the indicators read 0.36 and 0.20 respectively, while the column numbers say 0.46 and 0.90). Doing my own analysis, it looks like the indicator numbers are correct, the 0.36 and 0.20.
I can't figure out how to include the layout or a screenshot in this submittal.
|
|


Worden Trainer
Joined: 10/7/2004
Posts: 65,138
|
Add the following line to your RealCode to force the WatchList Column to use all of the data:
'# Cumulative
-Bruce
Personal Criteria Formulas
TC2000 Support Articles
|
|
Registered User
Joined: 6/25/2008
Posts: 4
|
Bruce, this works like a charm! Thanks
|
|
Worden Trainer
Joined: 10/7/2004
Posts: 65,138
|
You're welcome.
-Bruce
Personal Criteria Formulas
TC2000 Support Articles
|
|
Registered User
Joined: 11/26/2009
Posts: 1
|
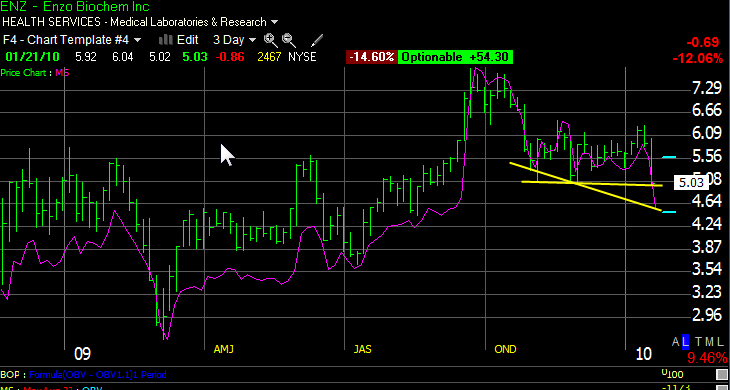
DW's note on ENZ posted on 01/21/2010 states that MS is in a leading downtrend (the weekly chart.).
What I see there is a leading uptrend in MS that began in July 2009. 1) Where and how am I wrong?
Is there a more or less definitive description somewhere on how to interprete the displays of TSV, MS, amd BOP. Their picture does change a lot with zoom in / out (+ / - ).
|
|
Administration
Joined: 9/30/2004
Posts: 9,187
|
I think he's referring to a more short term divergence between the price and MS since around early November.
 Attachments:
pa44519.png - 20 KB, downloaded 90 time(s).
|
|
|
Guest-1 |