
Registered User
Joined: 6/6/2005
Posts: 1,157
|
Hey everyone,
Last year I posted my method of dinding bullish triangles, pennants and wedges using telechart. I called this the dragon trade because that's what the charts looked like: fierce, profit generating dragons. To read the orignial thread, and to learn how to make the chart, check this out:
http://www.worden.com/training/default.aspx?g=posts&t=26559
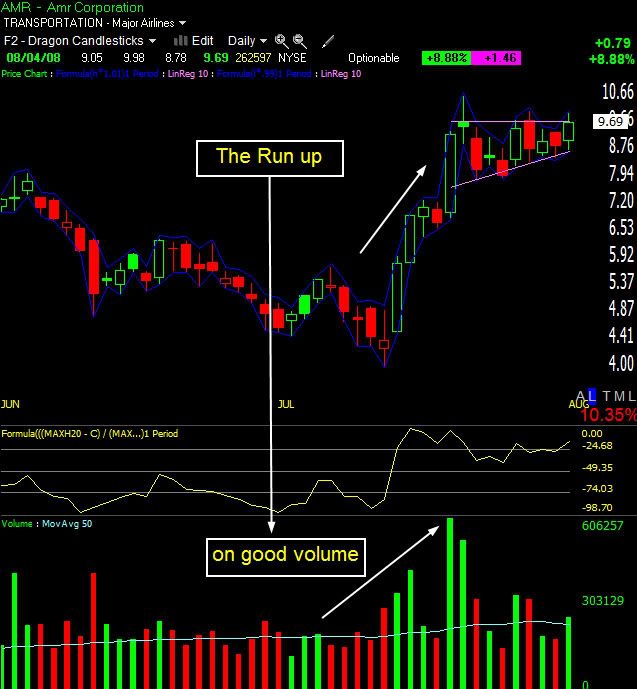
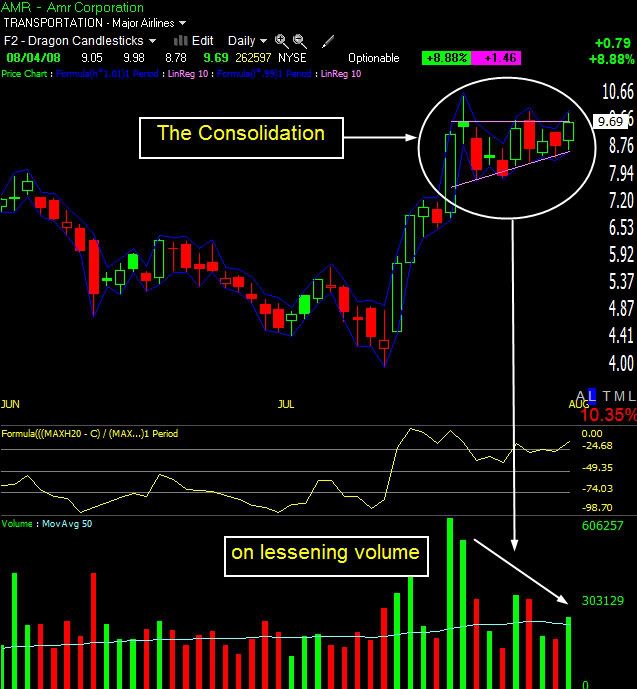
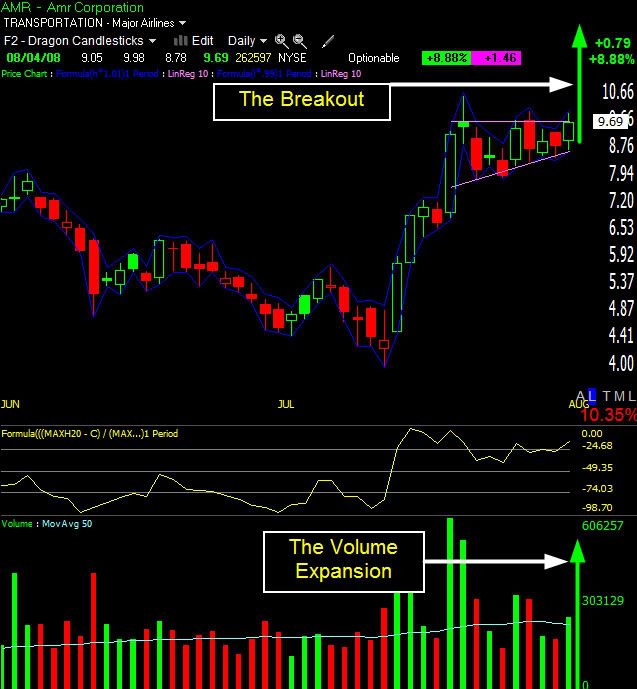
As a lot of these patterns are showing up again, I thought I'd bring them up again. For a quick refresher, here's what I'm looking for:
I run the scan on the russell 1000 and then keep an eye on th patterns I like.
This year I have added the negative slope on the 10 day volume linear refression as that will help find the consolidation patterns better and I believe it has. Here are a few stocks that meet the criteria:
dal
wfc
cbsh
ntrs
stt
nvr
As always, don't forget to place stops below the swing lows!
David John Hall
|
|

Registered User
Joined: 12/31/2005
Posts: 266
|
yup, thats the sector i've been watching closely, for longs. amr looks ready to explode.
|
|
Registered User
Joined: 10/7/2004
Posts: 426
|
David,
I especially like the excellent use of volume in your dragon patterns. Volume is something that everyone should understand and use in their trading. The Wordens also mention this in the daily Worden reports. Thank you for bringing this to our attention.
|
|
Registered User
Joined: 6/6/2005
Posts: 1,157
|
AMR behaving very well today.
David John Hall
|
|
Registered User
Joined: 12/31/2005
Posts: 266
|
look like breakouts to me. oil looks like it may test to the 200 dma. buy the pullbacks on Amr.
|
|
Registered User
Joined: 12/2/2004
Posts: 1,775
|
Good work there johndavidhall. I do indeed see your dragons:) And like Booker I also like your respect for volume.
|
|
Registered User
Joined: 10/7/2004
Posts: 426
|
Well, I sold AMR and DAL just before closing anticipating a correction in the markets this morning and luckily it worked out. Like driger says, buy the pullbacks. I just love surfing the waves.
|
|

Registered User
Joined: 10/7/2004
Posts: 2,181
|
David;
DMRC has a dragon-esque look, or does it? What are your thoughts. Big insider buying going on with this one.
|
|
Registered User
Joined: 6/6/2005
Posts: 1,157
|
Nice work, Booker! How great is it when trades come off well?
Hi tobydad,
Nice looking chart on DMRC. I'll have to check my dragon chart from home but looking at the technical pattern it does look like one. However, that big volume spike has me nervous. Normaly, I like to see a nice even build in volume, and then a decline into the consolidation. While this technically has those qualities, they are a little jumpier than I like. Also, I normally like a tighter consolidation area. One within the last 10 days where price is bouncing back and forth between support/resistance, building steam.With DMRC we have a roughly 20 day consolidation look to it.
On this, also, I see a stop around the 13.30 level. that's the last major swing low and a good 9%, so i'd position with that in mind. I will for sure look at my telechart dragon profile when I get home.
Also, booker, you may be interested in this: I created several pcf's for these rules last night and ran a backtest to favorable results. Of course, the patterns wern't always as perfect as doing the sort-by's and selecting from eye, but some were right on.
The results were 55% positive annualized at 55% per year. Not earth shattering but a start. I will be looking a little deeper into the pcfs I used and when I have them I will post them for all.
David John Hall
|
|
Registered User
Joined: 10/7/2004
Posts: 426
|
Tobydad, nice find and I hope you have success with this trade. The volume is a little too small for me or I would be interested. Thanks for mentioning it.
David, yes indeed I would like to see your PCF when you are ready to post it. I do like the 55% numbers.
|
|

 Gold Customer Gold Customer
Joined: 12/19/2004
Posts: 108
|
David John Hall~
Thanks for posting your "Dragon" charting. I have aquestions as I followed your link and did the custom indicators you mention as well as the regression lines however i notice my chart didn't quite look like yours when following AMR. I had trouble configuring the Regressions as they didn't match well and also the Custom indicator parameters overlapped each other at multiple points. Iwondering if you would be kind enough to share a little more insight?
Yes I would like to saee those PCFs also.
Got a questions... wondering what your take is on SQNM? The news sounds pretty good once they getting everything lined up. it has had a nice run the last two months, but right now i feel it is in Pullback mode. I'm looking a support at around $18 . before buying back in. What your take?
|
|
Registered User
Joined: 6/9/2007
Posts: 68
|
DJH, thanks for starting this Dragon thread again. I had missed it the first time around. This is why I continue to read the forum, to get great ideas like this. I think this could be a great method and want to try it out. I tried to duplicate your chart and watchlist, but am having a problem getting my LinReg 10's to look like yours. I tried to copy exactly what you show on your chart. As per your post I went back to August 4 for AMR. Everything looks OK except the LR10. Mine have crossed on about 7/24. The 'high' LR is too low, and the 'low' LR is too high. I wish I could show you the chart but don't know how. Any thoughts?
|
|
Registered User
Joined: 10/7/2004
Posts: 2,181
|
OK, let's try QLGC. How does that look?
|
|
 Platinum Customer Platinum Customer
Joined: 10/7/2004
Posts: 95
|
djr311,
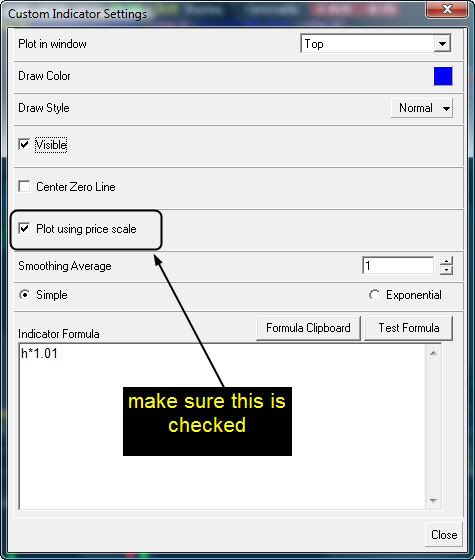
You might want to check that in your custom indicators that the "Plot using price scale" box is checked, otherwise the plots will be off on the chart.
Mike
|
|
Registered User
Joined: 6/6/2005
Posts: 1,157
|
Hi tobydad,
Yes, qlgc was actually on my list last night. Although last night's picks did not perform as well as the night before.
Here's the chart...
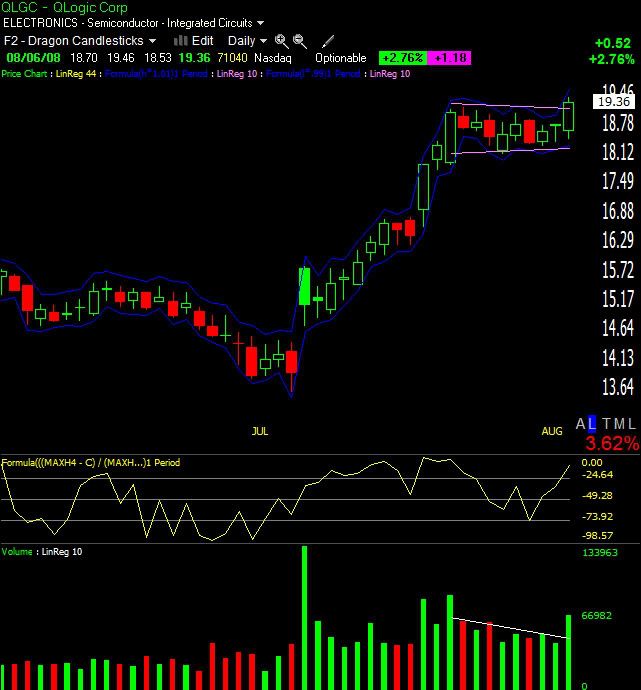
djr, be sure you are checking this box as MichaelR suggested...
jjhart52,
Thanks. Looking at sqnm it doesn't look like it's a dragon pattern. Based on the way I trade, i wouldn't consider it unless it returned to new highs .
David John Hall
|
|
Registered User
Joined: 10/7/2004
Posts: 2,181
|
WARNING!: Man typing without contacts.
So David, are these considered day trades or set ups for swing trades or both? How do you see/use them? Do you just base your involvement with them based upon what they give you to work with?
|
|
Registered User
Joined: 6/6/2005
Posts: 1,157
|
Hey Tobydad -- I see them as potential setups for swing trades lasting between 1 and 5 days.
What I am learning about myself and my trading (and this might apply to other traders as well) is that set ups and patterns aren't written in stone, but a particular set up can and will help map a particular market. If a certain set up follows through in a similar fashion you can get an idea of what to expect as far as targets. stops, movement.
All of this is worth its weight in gold in all markets as they are, most of the time, uncertain at best. I have also found that general index confirmation helps with followthrough. The trickiest part about this set up is the confirmation of the move as breakouts fail 70% of the time. For instance, this morning qlgc gapped down. This would immediately take it off the radar. If it still looks good tonight it would be considered again for tomorrow.
But the good part is the winners really do run.
David John Hall
|
|
Registered User
Joined: 6/9/2007
Posts: 68
|
MikeR and DJH, thanks to you both. You were correct that I did not have the box checked. Thanks again.
|
|
Platinum Customer
Joined: 10/7/2004
Posts: 95
|
Tobydad,
I would second DJH comments relative to overall market direction. My observation is that most stocks trade in the direction of the overall market, so trying to buy bullish breakouts when the market is going down is much more difficult and has many more and larger failures.
Mike
|
|
Registered User
Joined: 6/6/2005
Posts: 1,157
|
The good news is that I'm working on a sleeping dragon pattern which should be good for a few breakdown shorts and would simply be a bear flag breakdown. I just like the dragon because it gives a story, paints a picture, and helps visuazation (for me). And yes, I like drawing with crayons as well. :)
David John Hall
|
|
Registered User
Joined: 3/5/2008
Posts: 13
|
Davidjohnhall, I notice that a few different banking sectors are showing the same dragon pattern. is this a good sign that our economy is getting stronger in your opinion. I also notice that precious metals and oil are on the decline as two thirds of the Morning Star industry groups are on the rise. This coul be a major change in the market direction. I have been reading your posts for a while now and respect your opinion. Could you share some thought on my observations?
Sam
|
|
Registered User
Joined: 6/6/2005
Posts: 1,157
|
Thanks Permabull, I appreciate your compliment. One thing I always try and do is listen to and take the signals that the market gives me. Sure, I like to play the "what if" game and sometimes get a bit hypothetical and esoteric, but why not. It's my job to keep my mind open to all possibilities and one way I do that is to look at all the angles.
I have not checked the sector charts with the dragon, but that is an excellent idea. I imagine that if the same patterns are showing up in sector charts then what you are seeing is a positive for those sectors. but as always, confirmation of new highs with strong volume is needed.
Also, the weekly trend of the market is still down. I measure this by a 10 week and 50 week moving average on the s&p500.
Here's the chart:
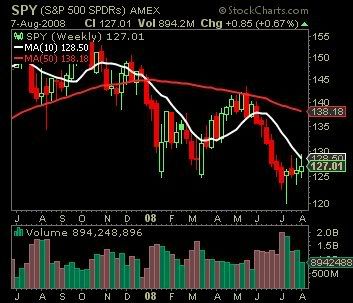
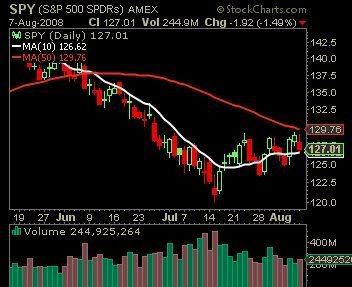
As you can see, the moving averages for this long term veiw are currently aligned to the negative. On the daily it's clear we're reaching another inflection point.
If a change is top happen technically, of any lasting value it will have to start here. When it comes to matters like this I have a little mantra I repeat to myself:
Market, sector, stock
Market, sector, stock
Believe it or not this little mantra has keepen me out of trouble many times.
First, look at the market. What is it doing? What is the last signal you were given? For instance, according to these two charts, everyone should be short or in cash.
But...
As you know from watching oil this last few months, there are sectors and stocks that perform no matter what market we're in. Because of this I do not cut myself off from going long in a down market, but I do make sure I factor in the added risk of knowing that 4 to 1 stocks move in unison with the trend of the general market and it is easier to make money by following it. I didn't believe this until I participated in the interesting numbers thread.
That said, I am seeing strength in the health care sector, the biotech sector, and for some reason the toys and games sector and resort hotels.
I also run a reversal scan against sectors each night and see that airlines and southwest regional banks are leaning reversals down there. Although I don't have to tell you how risky value hunting in and around the banks can be in this climate.
So that would encapsulate my thoughts. Dominant trend:down but reaching an inflection point. Either you think a turn is coming and you're looking at strong stocks. Or you think there's more of the same coming so you're looking at weak sectors. Either way, i try my best to stay alert and look for the most opportunity with a style of trading that matches my personality, while highlighting my strengths and managing my weaknesses. Needless to say, some days are better than others.
Good luck everyone!
David John Hall
|
|
Registered User
Joined: 10/7/2004
Posts: 2,181
|
This looks to me like a variation of the theme; but nonetheless, displays the power of the dragon-like charts. David, am I off to far on that assessemnt? I don't want to sidetrack your thread.
|
|
Gold Customer
Joined: 11/11/2006
Posts: 359
|
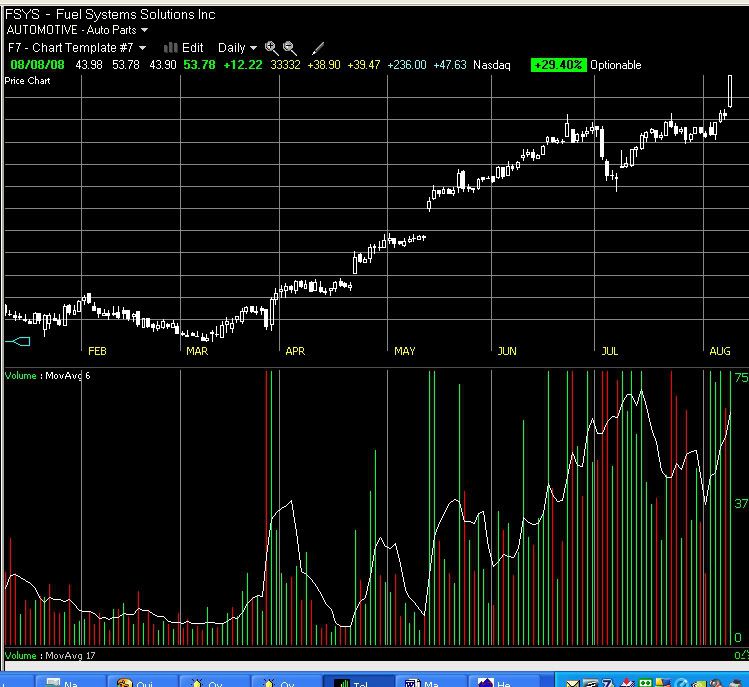
Well, Tobydad, at the risk of further garbling up the thread, I like FSYS myself. It presented on two different scans. It meets about all of the Darvas conditions: Current all time high, current yearly high coming off of a drawback from yearly/all time high.
Volume was up on the breakout.
Upper resistance was broken after four points of contact since June.
Sir Fan Pattern set-up demonstrates that the stock is in a good uptrend, as well as several others.
Including, incidentially, the K39 set-up that I occasionally babble about.
I am a little scared that Fridays breakout was a little too much of a good thing.............
Mammon
|
|
Registered User
Joined: 6/6/2005
Posts: 1,157
|
You're correct tobyday, although I would call this more of a master dragon. As the head spans a month and a half or so. But as I said, the dragon is just a colorfully dresed pennant or triangle breakout. Nice chart, tobydad. And it is my firm belief that some of the best discussions come from thread derailment.
Here's how I see the breakout:
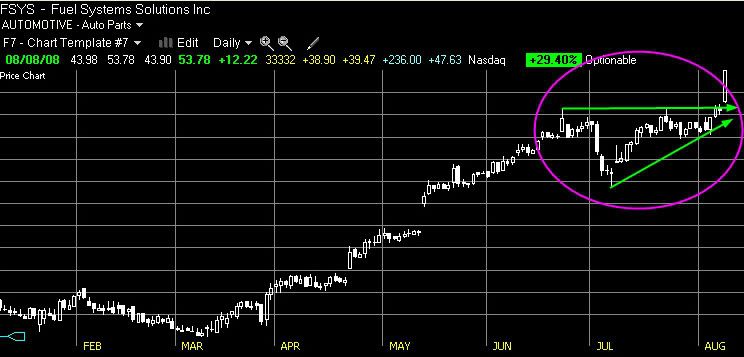
Lots of support around the 34.50 area.
David John Hall
|
|
Registered User
Joined: 10/7/2004
Posts: 2,181
|
QUOTE (mammon)
I am a little scared that Fridays breakout was a little too much of a good thing.............
Mammon
My concern precisely. Beautiful chart but in this market? Hmmmm....
|
|
Registered User
Joined: 10/7/2004
Posts: 426
|
QUOTE (tobydad) QUOTE (mammon)
I am a little scared that Fridays breakout was a little too much of a good thing.............
Mammon
My concern precisely. Beautiful chart but in this market? Hmmmm....
New autos are not in favor right now, so I would expect the the auto parts business to be robust. Nice pick tobydad.
|
|
Registered User
Joined: 10/7/2004
Posts: 2,181
|
How about AMGN? I picked this on 7/17. Been good so far. It looks like it might be a good dragon.
|
|
Registered User
Joined: 10/7/2004
Posts: 2,181
|
Well, this is another fine mess you've gotten me into, David. Now I'm seeing dragons everywhere! Look at DAN...Awakening dragon?
|
|
Registered User
Joined: 10/7/2004
Posts: 2,181
|
By the way, we don't want to be premature on longs in this market, but W's have been very powerful indicators for the last 18 months or so (or maybe I've become more aware of them?). This seems to be forming one above the most recent 6 month resistance trendline.
|
|
Registered User
Joined: 10/7/2004
Posts: 2,181
|
Another dragon sighting, sire. GWR is puffing smoke from his fiercesome nostrils and the smoke has ascended to a new ATH. Perhaps he will be one of those, as I have dubbed them, Magic Dragons. You know, the ones with the floating heads.
Some of them we behead and their head falls to the ground. Others are enchanted and when we behead them, their head is released from the bonds of this earth and floats heavenward.
|
|
Registered User
Joined: 6/6/2005
Posts: 1,157
|
lol tobydad! You have ne lol'ing left and right. Sorry about dragging you into this mess. It does get tiring battling those fire breahting beasts! Looking at the charts of GWR and DAN I would have to say GWR looks better but it looks like another one of those longer term magic dragons you are now finding everywhere.
this has raised the thought, why not look for fractals. I will see if there is a benefit to first looking for weekly dragons and then on those weeklies, looking for dailies.
Keep up th good fight, tobydad!
|
|
|
Guest-1 |