| thephantomtrader |
|
Gold User, Member, TeleChart
|
| Registered User |
|
|
|
|
| Unsure |
|
| Monday, December 17, 2007 |
| Wednesday, August 23, 2017 7:28:18 PM |
108
[0.04% of all post / 0.02 posts per day] |
|
|
Heiken Ashi Bars - Easyscan from Daily Chart |
Rate this Topic:  |
|
|
|
|
thephantomtrader |
|
Posted : 08 June 2017 17:50:23 |
 |
|
 Gold Customer Gold Customer
Joined: 17/12/2007
Posts: 107 |
Can you give me PCF for Heiken Ashi Bars as follows:-
Todays's (Day 0) Heiken Ash Bar is green and higher than yesterday's
Yesterday's (Day 1) Hieken Ashi Bar is higher (green) than previous day (Day 2)
In summary Day 0 is > Day 1, Day 1 is > Day 2
Thank you.
|
|
|
Can you give me PCF for Heiken Ashi Bars as follows:-
Todays's (Day 0) Heiken Ash Bar is green and higher than yesterday's
Yesterday's (Day 1) Hieken Ashi Bar is higher (green) than previous day (Day 2)
In summary Day 0 is > Day 1, Day 1 is > Day 2
Thank you.
|
|
Bruce,
Many thanks for the clarification.
QUOTE (Bruce_L)
It really doesn't matter in the slightest. You can use whatever colors you want as long as you know which one is shorter and which one is longer. It is just a matter of visualization.
That said, in at least some of the pictures I have seen the green moving average is the shorter of the two moving averages. So the 2 period moving average "should" be green and the 7 period moving average "should" be red as is shown in the images and not as described in the instructions.
|
|
Hi,
Sorry to inconvenience you but I would appreciate your help as follows:-
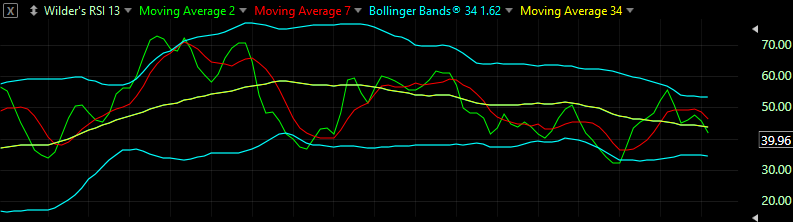
In the chart you published to me yesterday the 2-period simple moving average of RSI 13 is green and 7-period simple moving average of RSI 13 is red. Your settings (listed below) are the opposite, i.e red and green respectively.
QUOTE (StockGuy)
I've found a few different explanations of TDI. The one I could easily reproduce is as follows.
Plot Wilder's RSI, period 13 and set the plot opacity to 0 so it's not visible.
Add a 2-period simple moving average of RSI 13 (red) IS GREEN CORRECT?
Add a 7-period simple moving average of RSI 13 (green) IS RED CORRECT?
Add Bollinger Bands to RSI, period 34, Std Dev 1.62 and check the Plot Center Line option (light blue)
The source I found showed the center line of the bands a different color than the bands which isn't possible in TC2000. As an alternative, you could uncheck the Plot Center Line option on the bands and add a 34 period moving average to RSI (yellow)
|
|
Hi,
In the chart below 2-period simple moving average of RSI 13 is green and 7-period simple moving average of RSI 13 is red. Which is correct? Your settings are the opposite, i.e red and green respectively.
QUOTE (StockGuy)
I've found a few different explanations of TDI. The one I could easily reproduce is as follows.
Plot Wilder's RSI, period 13 and set the plot opacity to 0 so it's not visible.
Add a 2-period simple moving average of RSI 13 (red)
Add a 7-period simple moving average of RSI 13 (green)
Add Bollinger Bands to RSI, period 34, Std Dev 1.62 and check the Plot Center Line option (light blue)
The source I found showed the center line of the bands a different color than the bands which isn't possible in TC2000. As an alternative, you could uncheck the Plot Center Line option on the bands and add a 34 period moving average to RSI (yellow)
|
|
Ref: Traders Dynamic Index
Many thanks for your help.
|
|
Hi,
Do you have a formula for the following:-
The Traders Dynamic Index uses trend direction, momentum and market volatility to determine market conditions. This indicator uses relative strength index, simple moving average, double exponential moving average and standard deviation to generate five time-series.
The function displays those time-series and returns the TDI or traders dynamic index.
The parameters of the different indicators can be updated directly from the function formula. The default settings are:
RSI: 13 (Relative strength index)
SMA: 7 (Simple moving average)
DEMA: 34 (Double exponential moving average)
STDDEV: 34 (Standard deviation)
|
|
Thats it.
Thanks Bruce. Apologies again for the confusion.
|
|
Hi Bruce,
Sorry about that I get confused trying to navigate my way around these discussion forums.
Bascically I want to set up alerts similar to the Heiken Ashi chart signals, ie corresponding to standard colours on these charts, namely red bar when bearish and green when bullish.
Thanks
|
|
To whom it may concern.
Hi,
This is my third attempt to contact a trainer.
Can you provide me with a 2 hour and 4 hour pcf for Heiken Ashi that I can use to create an alert when value falls below previous 2 and 4 hour bar and also rises above 2 and 4 hour bar.
Finally can you include the Heiken Ashi formula.
Thanks
|
|