| Welcome Guest, please sign in to participate in a discussion. | Search | Active Topics | |
Registered User
Joined: 3/16/2006
Posts: 2,214
|
|
|
Registered User
Joined: 3/16/2006
Posts: 2,214
|
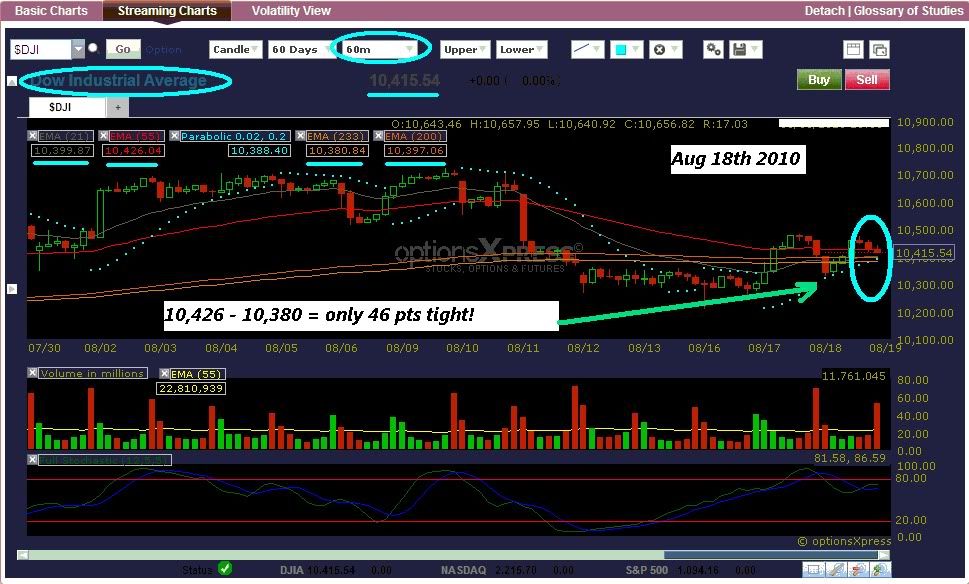
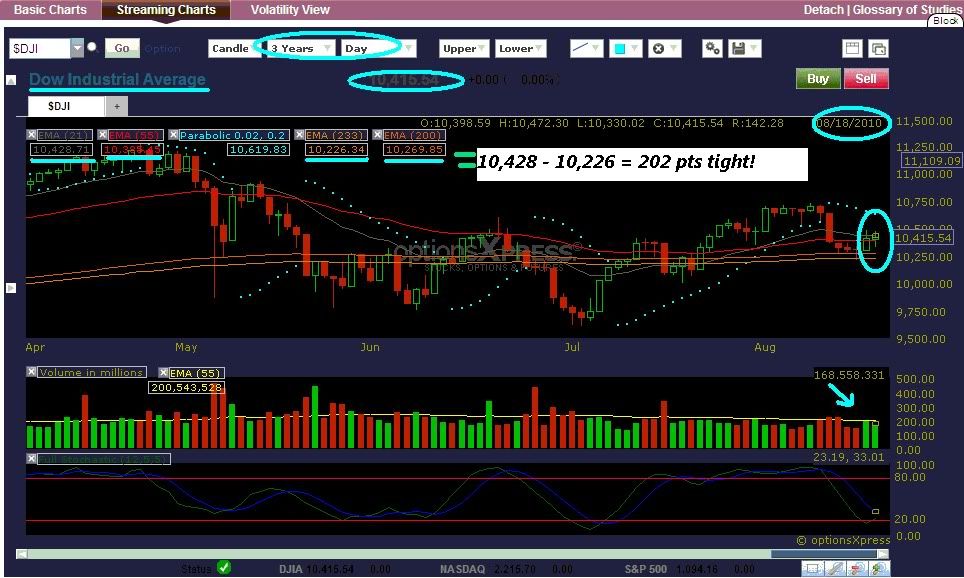
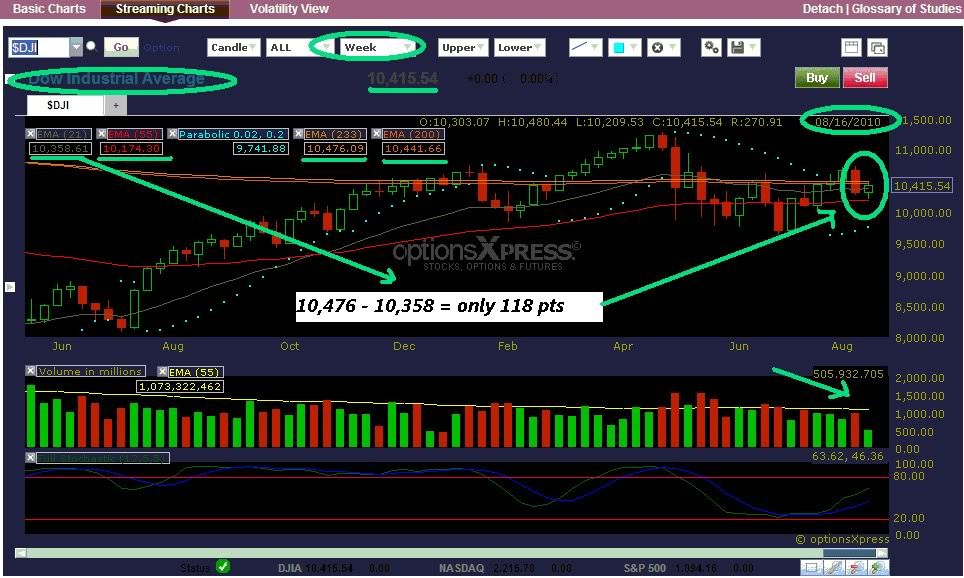
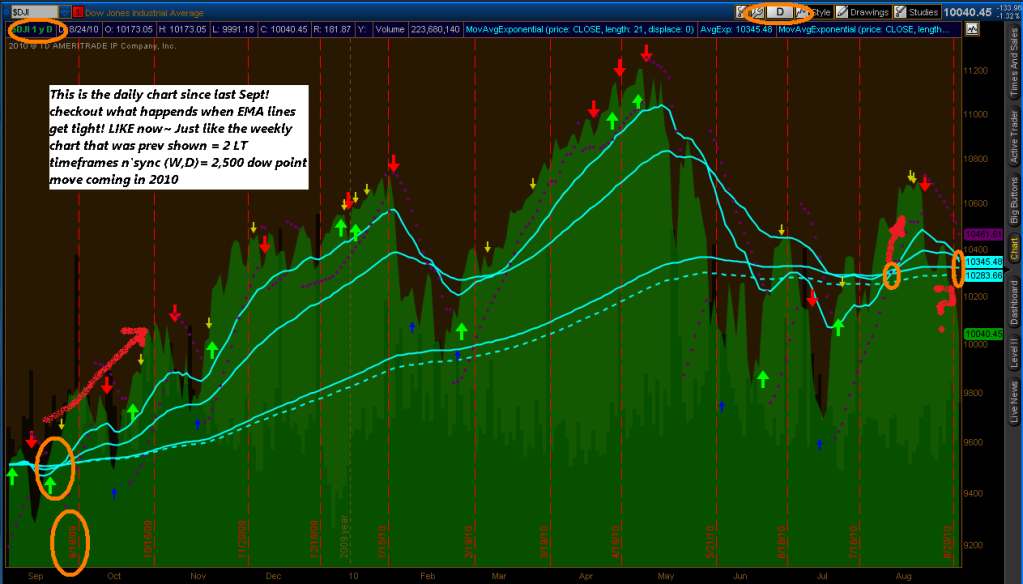
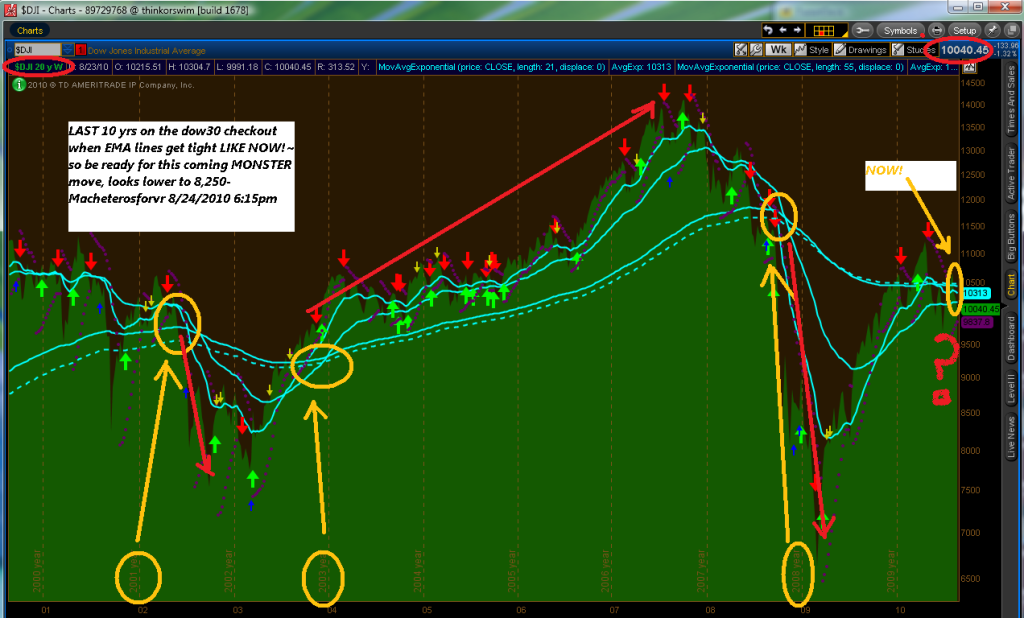
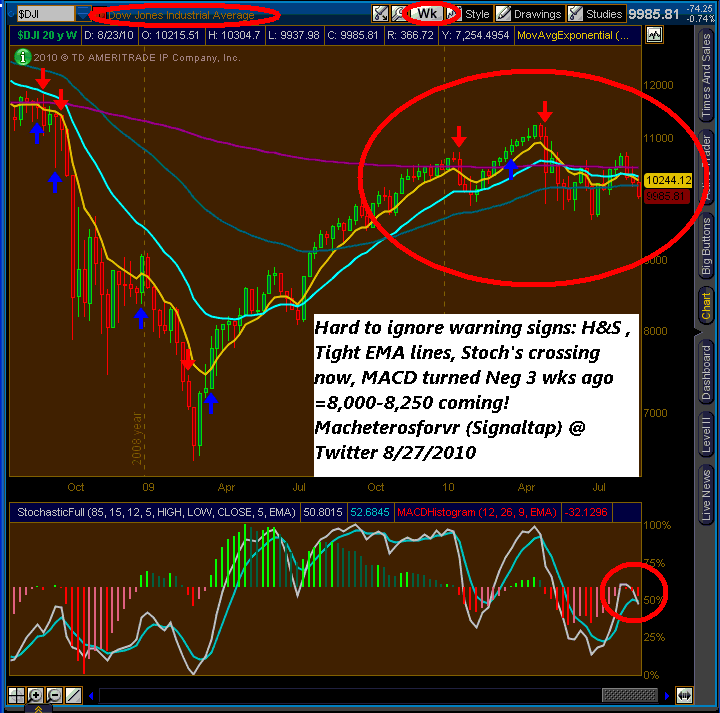
= this coming move of appx 2000-2500 dow30 pts will close 2010. Could go either way 12,415 for bulls or 8,415 for bears. Looking closely @ the weekly chart it seems that is heading lower, look @ volume last 5 weeks (market nervous in the summer duldrums) be ready Signaltap or aka Macheterosforvr in Twitter - Aug 19th 2010
|
|
Registered User
Joined: 5/1/2007
Posts: 158
|
I don't think that austerity in Europe will lead to higher stock prices in U.S.
Of course, I will have to see Greek austerity before I believe it. Reminds me of 1840-1860 in U.S. OPEC reminds me of Spain in the 1500s.
I expect to see a series of one-term Presidents in the U.S., and something similar in Europe and Japan.
Canada would be a safe haven because of resources and the Hong Kong immigration of the late 1990s.
It's already been called - first deflation, then hyperinflation, then oligarchs (some countries military, others religious, U.S. both major parties slouching towards fascism). Economy will move positively when we prelim into WW3, kick up the global birth rate, or get energy/raw materials from space. Rooting for 2 and 3. Western economies cannot grow with birth rates of 1.20 per woman.
Short term - destagflation - housing and other assets down, commodities holding absolute price better than equities. When 10-year bond yields up 8% off the lows, equities collapse. Key political event near term - EC fracturing. Think Berlin Wall, but we are still in Andropov time.
|
|
Registered User
Joined: 3/16/2006
Posts: 2,214
|
|
|
Registered User
Joined: 3/16/2006
Posts: 2,214
|
|
|
Registered User
Joined: 6/8/2007
Posts: 31
|
ABS(C < C9 AND C < C8 AND C < C7 AND C < C6 AND C < C5 AND C < C4 AND C < C3 AND C < C2 AND C < C1)*L
Can you any one explain this formula
|
|
Registered User
Joined: 10/7/2004
Posts: 886
|
QUOTE (kshere75) ABS(C < C9 AND C < C8 AND C < C7 AND C < C6 AND C < C5 AND C < C4 AND C < C3 AND C < C2 AND C < C1)*L
Can you any one explain this formula
I don't think so... it doesn't make any sense.
The statement within the parenthesis evaluates to "true" if the closing price of today the lowest close of the last 10 days. If it's not, it's value is false.
The "ABS" part of the statement says "takes the absolute value of what's inside the paranthesis." Taking the absolute value of a "true" or "false" boolean value has no meaning.
The " *L " portion of the statement says "multiply what precedes the " *" sign by the low price for today. Forgetting the absolute value of a boolean issue, you can't multiply "true" or "false" by a numerical value. (true * 5.37 = ?)
Where did you see this statement, and in what context was it? I don't see any connection to the rest of this discussion thread.
Bob
|
|
 Gold Customer Gold Customer
Joined: 11/22/2006
Posts: 100
|
The formula came from Diceman demonstrating how to put a Percent True Indicator in the price pane.
The Percent True Spike will touch the Price Bar at its Low.
ABS(boolean formula)*L.
It was just another one of Diceman's great contribution.
QUOTE (kshere75) ABS(C < C9 AND C < C8 AND C < C7 AND C < C6 AND C < C5 AND C < C4 AND C < C3 AND C < C2 AND C < C1)*L
Can you any one explain this formula
|
|
Gold Customer
Joined: 11/22/2006
Posts: 100
|
Here's the discussion where it was mentioned.
http://forums.worden.com/Default.aspx?g=posts&t=42329
QUOTE (william4567) The formula came from Diceman demonstrating how to put a Percent True Indicator in the price pane.
The Percent True Spike will touch the Price Bar at its Low.
ABS(boolean formula)*L.
It was just another one of Diceman's great contributions.
QUOTE (kshere75) ABS(C < C9 AND C < C8 AND C < C7 AND C < C6 AND C < C5 AND C < C4 AND C < C3 AND C < C2 AND C < C1)*L
Can you any one explain this formula
|
|
Registered User
Joined: 10/7/2004
Posts: 886
|
Well.... thank you very much for the information william4567, and my apologies to diceman and kshere75.
I'm surprised the ABS(boolean) doesn't throw any data integrity check error. Logically I would think that it should (it does in StockFinder).
I personally don't understand why it does work, unless it is exploiting a datat integrity loophole in the Telechart "formula compiler." I don't know why it would allow such a statement as ABS(boolean) on purpose.
Needless to say, I'm surprised this works, but kudo's to diceman for figuring out that it does.
Bob
|
|
Registered User
Joined: 1/28/2005
Posts: 6,049
|
QUOTE (bobre1) Well.... thank you very much for the information william4567, and my apologies to diceman and kshere75.
I'm surprised the ABS(boolean) doesn't throw any data integrity check error. Logically I would think that it should (it does in StockFinder).
I personally don't understand why it does work, unless it is exploiting a datat integrity loophole in the Telechart "formula compiler." I don't know why it would allow such a statement as ABS(boolean) on purpose.
Needless to say, I'm surprised this works, but kudo's to diceman for figuring out that it does.
Bob
When you put a true/false inside ABS() it will equal 1 when true and zero when false.
Price is the only thing you can scale in telechart.
(most indicators fill the screen on their own scale)
Using *L, the indicator will equal the low when true.
Most would like to see it go to the low rather than cover the price bar.
(at least I do) (a % true goes to the top of the screen)
You just have to remember that you are creating an indicator (not % true)
and you have to remember to use "plot using price scale".
That indcator was a modification of one supplied by Ben for a 10 day low.
(so it plots to the low)
Thanks
diceman
|
|
Registered User
Joined: 6/8/2007
Posts: 31
|
Thanks
All Gentleman for explanation
Appreciate your help and input
Koti
|
|

Registered User
Joined: 2/5/2006
Posts: 1,148
|
still getting tighter

|
|
Registered User
Joined: 3/16/2006
Posts: 2,214
|
|
|
Registered User
Joined: 3/16/2006
Posts: 2,214
|
 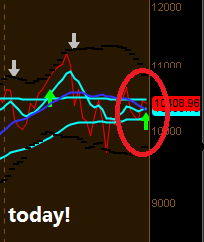 a green arrow +++ MACD Histo crossover came on the wkly dow30 chart!= HIGHER dow30 towards 11,278 to 11,500 area , then will figure it out! a green arrow +++ MACD Histo crossover came on the wkly dow30 chart!= HIGHER dow30 towards 11,278 to 11,500 area , then will figure it out!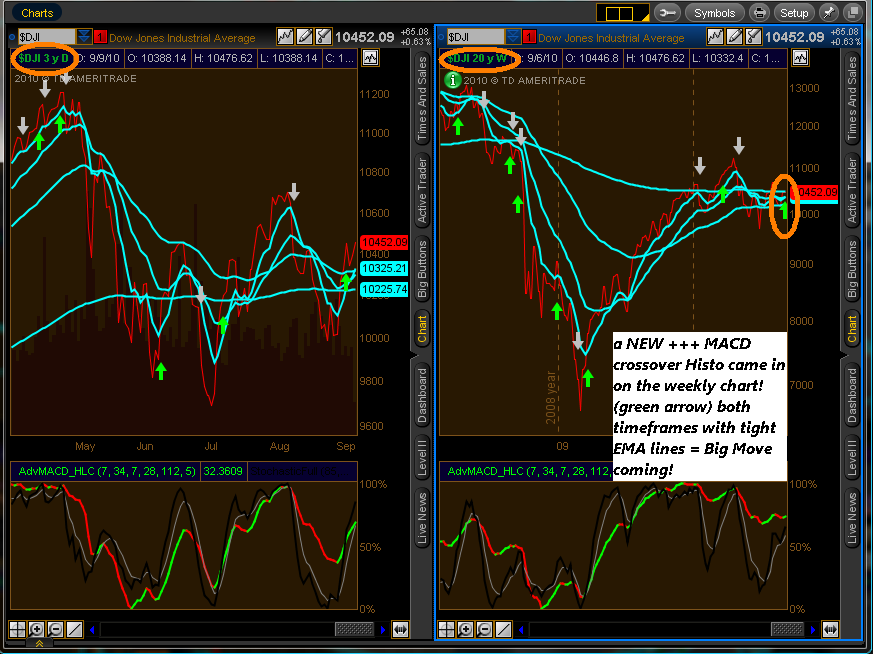
|
|
|
Guest-1 |