| Welcome Guest, please sign in to participate in a discussion. | Search | Active Topics | |
Registered User
Joined: 10/27/2005
Posts: 71
|
Hi guys,
How can I sort my list by % cahnge relative to a date range of an index.
Example:
If I want to sort my list by % change compared to % change on the SPX from 7/13 to 8/5 ????
I would also like the ability to change the index its compared to and change the date??
Please let me know how I can do this with telechart or stock finder
Thanks in advance
mark
|
|


Worden Trainer
Joined: 10/7/2004
Posts: 65,138
|
I can't think of a practical automated method of doing this in TeleChart.
The simplest way I can think of to do this in StockFinder involves a fairly simple modification of the Mimic TeleChart's % Change Custom Date Sort Chart Shared by jas0501. I'm going to try and contact him by email for permission to make and distribute a Chart with these modifications.
-Bruce
Personal Criteria Formulas
TC2000 Support Articles
|
|
Registered User
Joined: 10/27/2005
Posts: 71
|
Looking forward to it Bruce, thanks
M
|
|


Worden Trainer
Joined: 10/7/2004
Posts: 65,138
|
I want to start by thanking jas0501 for permission to modify the Chart and for mentioning that a newer version was available in a Blocks.com Blog post. You should be able to Open the attached Chart directly into a running copy of StockFinder.
If you Drag and Drop one of the RS % Indicators to the Watchlist and select Raw Value, it should display the results as a Watchlist Column. Left-clicking on the Watchlist Column Header should sort the Watchlist by the Relative Strength.
You can change the Relative Strength Symbol by unpinning the Price for Symbol Pane and then left-clicking on the Price for Symbol Indicator to bring up the Main tab of its Edit window (the Symbol setting is on the right side).Attachments:
Custom_Date_Sort_w_RS.sfChart - 85 KB, downloaded 752 time(s).
-Bruce
Personal Criteria Formulas
TC2000 Support Articles
|
|
Registered User
Joined: 12/31/2005
Posts: 2,499
|
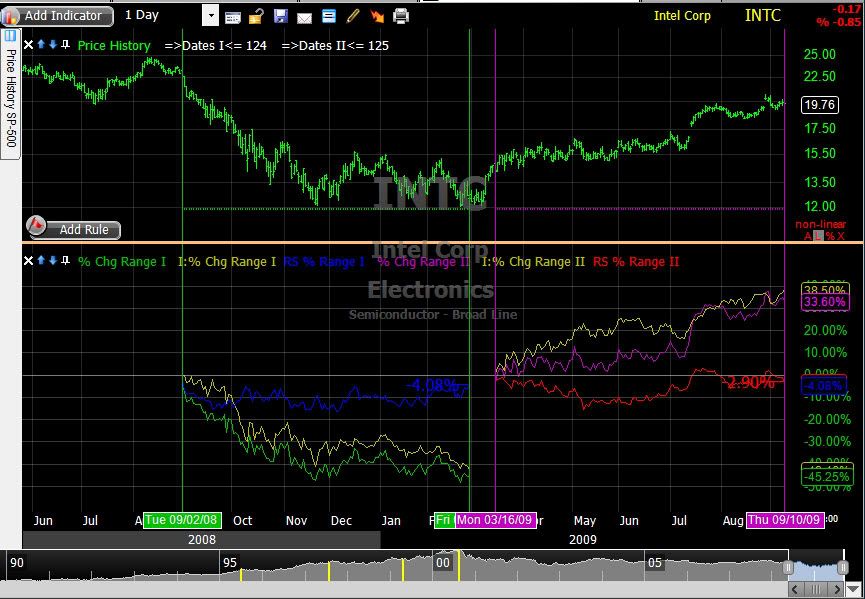
Thought a screenshot would help clarify the utility. The chart has 2 betweenDates pointer pairs, green and purple, allow display of the values between the data pointers and display of the last values between the date pointers as watchlist columns.

|
|
Registered User
Joined: 12/22/2006
Posts: 23
|
Jas0501,
I've trying to follow along on your blog, but how do you create a new block for the BetweenDates function?
|
|
|
Guest-1 |