Registered User
Joined: 5/16/2014
Posts: 57
|
What if I told you, you don't need overlay, indciators, or classical technical analysis to trade??
|
|
Registered User
Joined: 10/2/2016
Posts: 2
|
continue...
|
|

Registered User
Joined: 6/30/2017
Posts: 1,227
|
BurntFeet, that's what they call a tease :) ... turn and run the other way.
|
|
Registered User
Joined: 5/16/2014
Posts: 57
|
Sorry...for teh weekly delay.
I only use candlesticks in charting and inside bars on all time frames. The best Example i can show you is NTES from Fiday. I used multiple time frames, sometimes on very small time frames or combination of larger, analytical time frames.
I would recommend having separate 1, 2, 3 and 5 minute charts ready when reading this post.
During the open it can be very fast and with NTES price moved very fast. This high volatility is good for this type of trading but there are times when you don't need to be a ninja and can step back but the principles are the same. I take a long poistion on the break of insde bars high and opposite for a short. My stop would be the bottom of the inside bar for a long or top for a short position. But sometimes if something trades through my entry i just exit...hehe
This is one the conditions i use for inside bars.
(100 * L1) \ 1 <= (100 * L) \ 1 AND (100 * H) \ 1 <= (100 * H1) \ 1
Here is another
L1<=L and H<=H1
I use it within the PCF% true indicator so it is visual but i have to know the bars high and lows. So set up your charts with one the formulas so you can track the passage below.
At the open NTES ran about 8 bucks, which I totally missed but at 9:32 and 9:33 on the one minute chart the price action remained within that opening bars range. Also, the 3rd minute stayed in the 2nd minutes range(inside bar). I purchased a couple of 100 shares through 346.98( 9:33 close) and some more through the highs(348.30) of the inside bar on the 2 minute chart after close at 9:34 I offer half for sale at 352..73 and the rest 353.47 for a near measure move from the 2 minute inside bar's low.
This is one the conditions i use for inside bars.
(100 * L1) \ 1 <= (100 * L) \ 1 AND (100 * H) \ 1 <= (100 * H1) \ 1
Here is another
L1<=L and H<=H1
I use it within the PCF% true indicator so it is visual but i have to know the bars high and lows.
NTES cont'd
The price action proceeded to consolidate and after 15 minutes of trading the price sold off the highs. At the 9:45 close and on the 5 time frame there now formed another inside bar. It was clearly within the previous 5 minute candlestick. It would be very prudent to wait for the break of the high of 5 minute inside bars high to make a purchase but your stop would be the lows of the same bar. However, on the 2 and 3 minute frames there were additional opportunites to take additional long postions instead of awaing for the highs of teh 5 minute bar.
On the 2 minute TF there were two inside bars back to back, and on the 3 Minute TF there was one inside bar. These TF's closed before the 5 minute TF highs was taken. So, in theory you can take a smaller postion when price trades through the two samller TF's and when the inside 5 TF high is taken you can add.
In addition, on the 15 minute chart a new time frame opened at 9:45 and as long as price traded and stayed about the opening price you can stay long
This is what i did but i just offered everyting at 357.73 and called in a morning. There similar opportunites with NTES during the day. At 10:30c there was an inside 5minute whcih broke to the downside but i didn't hit it. If it were to revesrse off that inside bar the price would of plumbeted but it didn't. The stock was up big and it was fiercly strong. I took a small postion through that 5 minute hammer and waited. I let it trade in teh direct of teh trend at took my profits.
On the 2 minute time frame and 3 minue time frames there
|
|
Registered User
Joined: 5/16/2014
Posts: 57
|
DCIX
I did not trade DCIX on Friday, 11/17, but the 30 minute chart demonstrates the power of inside bars or in other words, an equilibriums. Inside bars are eqiluilriums between buyer and sellers where one side could not move the price to new highs or lows. It's a two bar or multi bar pattern and teh 30 minute pattern in DCIX had taken 90 minutes to form. Either longs finally gave up supporting the price or weren't strong enough to push it higher, or sellers just were more dominat. Either way the equiliblium formed and that was the "tell". You cannot deny the inside bar or dispute it's formation in the first 90 minutues of trading.
|
|
Registered User
Joined: 6/30/2017
Posts: 1,227
|
I've done a bit with inside bars on a daily timeframe.
Multiple timeframe inside bars is an interesting idea :)
 

|
|
Registered User
Joined: 5/16/2014
Posts: 57
|
Once you begin scanning for them they are everywhere...
BABA 11/24 at 11am close, inside 30 and up. I opened a long postion on teh break of inside 3 and it was the opening of the new 30 minute tiem frame.
BABA weeekly chart. inside week then it broke to the downside but teh this week it counter the break by taking thr weekly highs. The new entry was though 187.88. I traded it throught teh inside 15/30 and up combo on Monday. Didn't make much bc it collapse. But Tues at 11am close i took some on teh insdie 30 and up.
Amzn today
I waited for for 2 and 3 minute time frame candle stick bars to close.
the 2 TF minute was inside and down but tehere was counter to that move through 1163.88 whcih coube be an entry.
The 3 minute insdie bar and up broke the inside bars high of 1164.19.
So there were a combination of two separate time frames trading in the same direction and there were no red bars on the 5 TF until 9:50 close.
|
|
Registered User
Joined: 5/16/2014
Posts: 57
|
Some worthy observzstions:
NTES inside 30 and up this am
TSLA inside 5 at 10:10am
IRBT inside 5 at 9:55
FB inside day was taken around 9:55 am. Didnt have to taker that signal but your it consolidated at the point and form an equilibrium ont eh 15 and 5 minute charts at 10:15c. So, there was another combo, take teh 5 add on the 15
|
|
Registered User
Joined: 5/16/2014
Posts: 57
|
there are many ways to make money trading stocks. I use to use a moving averages, RSI, BB, and i intermittenly use Averages. However, I accepted this strategy and I believe everyone should add this method to their trading.
The problem with cassical tech analysis, traders are alwasy looking at the chart pattern and the margin to the right and disregarding the x axis on the bottom of the chart. Another issues with traders is they need to see a patttern; wedge, flags, cup and handles, head and shoulders, etc. Well, this strategy removes the need for multiple chart patterns and concentrates on time and two other tenents, time frame continuty and Broaden formations.
Basically, time frame continuity TFC is when price is moving in one direction along the major time frames. For example, NVDA monthly open and last weekly open were postive, and the daily id postive too. So, along the MWD Time Frames the continuity is toward the upside. ALso, NVDA is currently inside week and day. If the prices trades higher it have to take the price through those equilibriums and it will still have full tiem frame continuity. Therefore, TFC is when theprice is higer than it opend for the Month week daily and 60
Broaden Formation
Price trades through a series of higher high and lower lows. It's basically a pattern but it price can trade along it's vecotrs or within its body
This is where i learned it and where i trade everyday.
https://www.youtube.com/watch?v=1GYvsdKlA5A
|
|
Registered User
Joined: 10/2/2016
Posts: 2
|
Thanks for the tip!
It looks familiar to a triangle breakout strategy, don't you think so?
Also it could be great if you post a couple of screenshots with your thought process for some tickers.
Cheers!
|
|
Registered User
Joined: 5/16/2014
Posts: 57
|
|
|
Registered User
Joined: 5/16/2014
Posts: 57
|
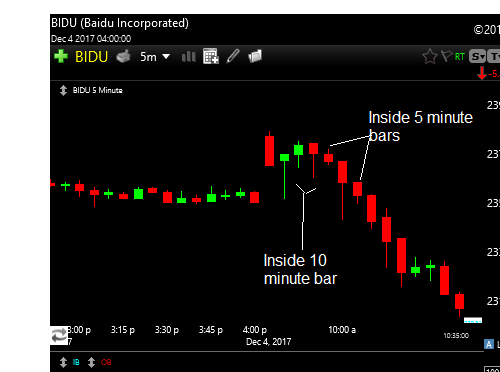
Inside 10 minute bars.
In the previous screen shot two 5 minute bars were counted imposing as the 1st inside 10 minute bar. It's clearer in this screen shot to teh 10 inute bat at 9:50 close and again at 10:30 close.

|
|
Registered User
Joined: 5/16/2014
Posts: 57
|
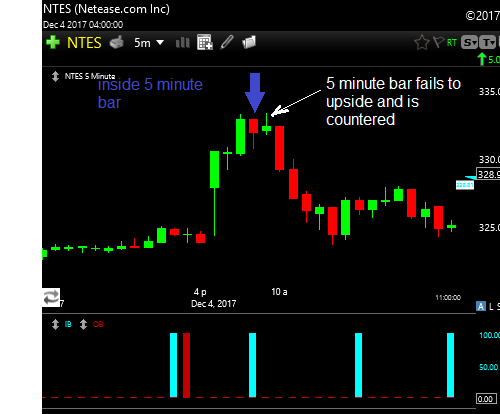
NTES 5 minute chart. There's an inside 5 minute bar at 9:50 close. Traders attempted to trade it up but it failed. The very next bar counters that insie bar and up attempt pattern and traps all the longs which ignite the selling to the downside. Also, on the daily chart, NTES was an inside and inside day and up pattern. Two daily bars trap within Wednesday bars range.
|
|
Registered User
Joined: 5/16/2014
Posts: 57
|
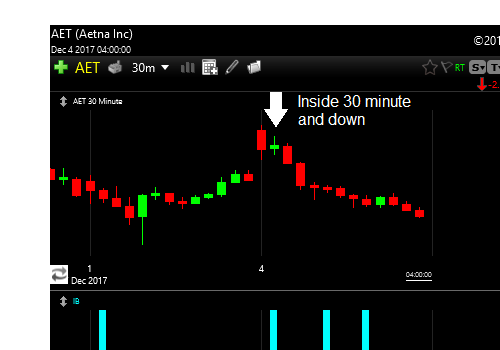
AET 30 minute Chart using multiple time frames Inside 30 minute bar and then trades down. There was an inside bar on the 5 minute charts which closed at 10:30, at which you could of igniated a psotion and then add trhough the 30 minute break.
|
|
Registered User
Joined: 5/16/2014
Posts: 57
|
I added the "inside bar" condtion as a PCF% true indicator on the bottom of the chart. I just learned how to add pics to the posts, so i'll be posting screenshots as an addiotnal aid . Some will be older but most won't.
|
|
Registered User
Joined: 5/16/2014
Posts: 57
|
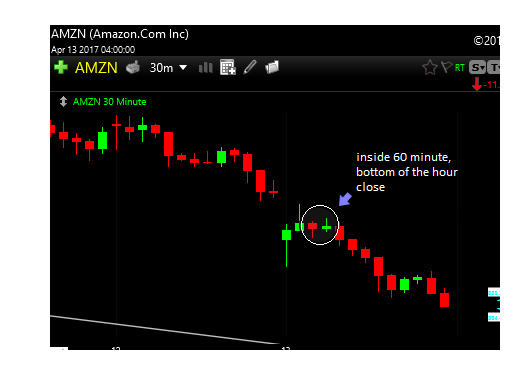
Older AMZN pic, I also use the bottom of the hour 60 minute time frame but on a 30 minute chart. So, the two circled 30 minute bars represents the bottom of the hour open and close and it ranges is clearly within the previous 60 minute bar. I break of the break of that hourly time frames is your entry with the high being your stop. A lot of teh time on smaller time frames there insdie bars and you can use a combination of these actionable signal for your entries and stops.
|
|
Registered User
Joined: 5/16/2014
Posts: 57
|
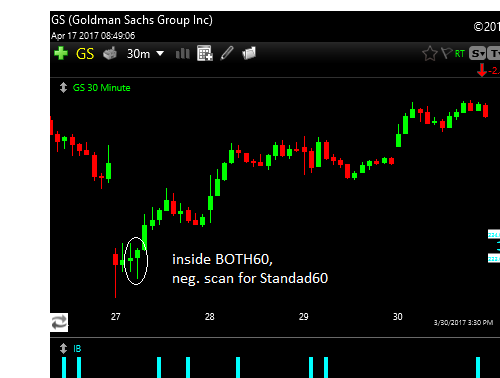
Another example of the bottom of the hour 60 time frame using 30 minute chart. There was no inside 60 minute bar on the standard time frame but the bottom of the hour time(BOTH) was postive. It appears there might of been an inside 30 that broke to the downside but it traded right back up before the BOTHs range wsa taken out. Classical consolidation and then break out?
|
|
Registered User
Joined: 5/16/2014
Posts: 57
|
TRV weekly. Inside week and up. You had all week to chase the price to the long side.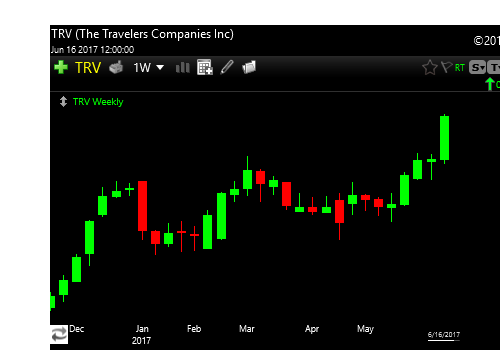
|
|
Registered User
Joined: 5/16/2014
Posts: 57
|
so much for photobucket, I cant even see my screenshots
|
|
|
Guest-1 |