Registered User
Joined: 2/17/2008
Posts: 132
|
i guess we'll find out what happens tomorrow, but did anyone buy longs before the close today? here's my reasons for thinking we might have a rally tomorrow:
1. we're right on a support level, of S&P 680
2. VIX didn't go up as much as expected, not even as high as earlier in the week
3. its a friday - i know this hasn't been too reliable lately though
4. jobs report out, which despite being terrible, has coincided with violent rallies in the recent past
and my reasons we might go down tomorrow:
1. everything is going to hell!
what are your opinions about where we are at right now?
|
|
Registered User
Joined: 2/17/2008
Posts: 132
|
i should say that i dipped my toes into ERX just before the close. i guess i'll find out how stupid i am tomorrow...
|
|

Registered User
Joined: 2/5/2006
Posts: 1,148
|
yo 11, momma needs a new pair of shoes. lol.
not my style.
i'd rather wait for some sort of a reversal on some timeframe.
support? what support, were at multiyear lows.
good luck
|
|
Registered User
Joined: 1/30/2009
Posts: 267
|
My thinking also. 680 Support? Can you post a chart to show us? I want back as far as 2001 and we are below everything now. I guess we all know where the bottom is.....0. I would never trade this long until I see a positive trend reversal.
|
|
Registered User
Joined: 2/17/2008
Posts: 132
|
the support level of 680 is tenuous i agree, but there is one at this level going back several years, as indicated on another trading video forum website!
|
|
Registered User
Joined: 12/5/2008
Posts: 81
|
This market has definitely been a devil.
Today's low on the S&P was 666.
That being said, I wonder if we have touched the bottom of the market.
It may be time to start buying, at least short term.
Also, I wonder if there is any significance to the fact that yesterday's date was 3-6-9.
So what do you guys think of these plays:
SAFM
LEAP
USO
PCS
ARST
ORCC
|
|
Registered User
Joined: 9/25/2007
Posts: 1,506
|
I saw on MSN ... where Cramer has called the "bottom" at 5320 ....
The same guy who in early October of 2007 said that we were going to 14,500 by the end of the year ....
And who in early October 2008 ... said to sell every rally ...
It's fun watching those guys bounce back and forth ...

|
|

Registered User
Joined: 6/6/2005
Posts: 1,157
|
I'm with you reality. I guess they have to fill up air time somehow. Can you imagine if they actually stuck to a plan? The all we would here is...the market is in a down trend. And we're short. Yep, still in a downtrend. Still short. And still in a downtrend...and STILL short.
The bottom looks to me more like 3,300 but what do I know. I'm just following the market. For the record my guesses have been wrong most of the time in this bear market. Luckily I am trading what is actually happening and pay very little attention to my guesses.
David John Hall
|
|
Registered User
Joined: 2/21/2007
Posts: 797
|
so when it hits 5325 we all go long. Thanks for the GREAT info reality. I'll be sure to empty the bank account just before that. Then i'll have plenty in my trading account. I wonder if Cramer will cover our losses at that point. It shouldn't be any problem, he's great at bragging how much his hedge fund is worth.
|
|
Registered User
Joined: 9/25/2007
Posts: 1,506
|
QUOTE (davidjohnhall) I'm just following the market.
Amen to that !
David ...
If I remember correctly, you also often like to look at line charts ... to reduce the "noise" caused by slippage, etc ...
My opinion and a dollar still isn't worth squat ... particularly if it's a US Dollar ...
But this trendline is interesting ...

|
|
Registered User
Joined: 12/5/2008
Posts: 81
|
No more leads guys, until you comment on the current list above.
|
|
Registered User
Joined: 6/6/2005
Posts: 1,157
|
Yes, very interesting, and a major possibility (in my opinion). Which also might by me a bag of chips if someone loaned me the cost of a bag of chips. Here's the long term chart I was looking at. Looks like almost a peaceful return to the trendline.
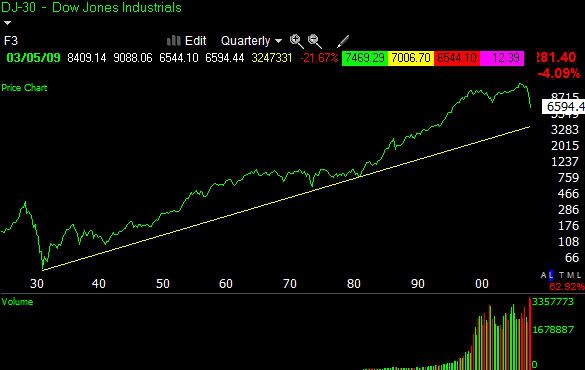
It could always bounce and travel sideways as the trendline moves high and meet somewhere in the middle. Or shoot right through.
David John Hall
|
|
Registered User
Joined: 9/25/2007
Posts: 1,506
|
We look at the supercycle in slightly different perspectives ...
You're looking at an absolute linear regression trendline ...
And I look at it from the standpoint of a "mean" ... and deviations from the mean ...
Drawn as I have below ... you can see how the second line seemed to act as support for the most recent consolidation ...
But ... you can also see how these lines were active in the 29-32 decline ...
For whatever it's worth ...


|
|
Registered User
Joined: 9/25/2007
Posts: 1,506
|
We look at the supercycle in slightly different perspectives ...
You're looking at an absolute linear regression trendline ...
And I look at it from the standpoint of a "mean" ... and deviations from the mean ...
Drawn as I have below ... you can see how the second line seemed to act as support for the most recent consolidation ...
But ... you can also see how these lines were active in the 29-32 decline ...
For whatever it's worth ...
|
|
Registered User
Joined: 6/6/2005
Posts: 1,157
|
Very interesting, perspective reality! I like the standard deviations idea. I wonder what our chances are of hitting the bottom blue line. On another forum I discussed how in creating trading systems you're taught to look for your biggest loss and anticipate it returning and to always trade with that in mind. Certainly, I think we could be in a situation where we may be witnessing that biggest loss playing out. There's no rule that says the largest loss or decline from highs (29-33) has to remain the largest loss. Whichever way this turns out, I am learning a tremendous amount about markets and cycles and bear markets and psychology during these last months.
David John Hall
|
|
Registered User
Joined: 9/25/2007
Posts: 1,506
|
QUOTE (davidjohnhall) There's no rule that says the largest loss or decline from highs (29-33) has to remain the largest loss.
There certainly isn't ...
And the rate of decline of this current market appears to be slightly outpacing that of the decline that began in September of 1929 ...
QUOTE (davidjohnhall) I am learning a tremendous amount about markets and cycles and bear markets and psychology during these last months.
David John Hall
I think that we all are David ...
It is one thing to read & study something ... generally from a limited number of perspectives ...
But to live it !!
That's an experience ...
With all of that said ... you asked what the odds might be of hitting that lower trendline ...
I haven't got a clue ... but I can tell you this ...
It would be an almost exact retest of the 1987 low ... allowing for the probable time to get there ...
|
|
Registered User
Joined: 9/25/2007
Posts: 1,506
|
BTW ... one last point David ...
IF we were to retest the 1987 bottom ... of DJIA 1616 ... it would represent about an 89% decline from the top of 14198 ...
Virtually IDENETICAL to the 1929-1932 decline ...
|
|
Registered User
Joined: 2/21/2007
Posts: 797
|
89% as much as i respect your intellectual responses, reality, i sure hope that you are wrong here.
|
|
Registered User
Joined: 9/25/2007
Posts: 1,506
|
QUOTE (johnlc) 89% as much as i respect your intellectual responses, reality, i sure hope that you are wrong here.
Please don't take that as a prediction John ...
As I prefaced it with "I haven't got a clue ..."
I was simply pointing out that IF that were to happen ... that the decline would be no better ... or no worse ... than what we experienced the last time that a huge credit bubble burst ... and the entire financial system had to be deleveraged ...
Of course .... back then we were unwinding 10:1 leverage ... and now, in many cases, we're unwinding 40:1 leverage ...
Like David said ... we follow the market ...
|
|
Registered User
Joined: 2/5/2006
Posts: 1,148
|
QUOTE (davidjohnhall) Yes, very interesting, and a major possibility (in my opinion). Which also might by me a bag of chips if someone loaned me the cost of a bag of chips. Here's the long term chart I was looking at. Looks like almost a peaceful return to the trendline.
It could always bounce and travel sideways as the trendline moves high and meet somewhere in the middle. Or shoot right through.
David John Hall
interesting, to think i posted a supercycle chart similiar to this several months ago, and the forum geniuses laughed. go figure.
notice a touch of the lower trendline would be in area of a 62% retracement of the run from 1932-2007.
|
|
Registered User
Joined: 12/5/2008
Posts: 81
|
QUOTE (Tootsie) This market has definitely been a devil.
Today's low on the S&P was 666.
That being said, I wonder if we have touched the bottom of the market.
It may be time to start buying, at least short term.
Also, I wonder if there is any significance to the fact that yesterday's date was 3-6-9.
So what do you guys think of these plays:
SAFM
LEAP
USO
PCS
ARST
ORCC
Well my picks didn't do all that bad in 7 days. Let's see how they fared between 3/6 and 3/13:
SAFM 34.01 Now 35.19 Up 3.45%
LEAP 29.57 Now 35.92 Up 21.47%
USO 27.99 Now 27.63 Down 1.29% (The only ETF in this list)
PCS 14.36 Now 16.85 Up 17.34%
ARST 11.43 Now 11.80 Up 3.24%
ORCC 3.20 Now 3.84 Up 20.00%
I think I can do better though.
|
|
Registered User
Joined: 9/25/2007
Posts: 1,506
|
Looks like about a 10.7% average gain ...
Versus the S&P 500 at only 10.68% ....
|
|
|
Guest-1 |