| Welcome Guest, please sign in to participate in a discussion. | Search | Active Topics | |
Registered User
Joined: 8/24/2007
Posts: 5
|
Hi all,
I am very new to Telechart and have a few questions. I am actually a financial advisor by trade and have always traded stocks based on fundamentals only. I have decided to learn Technical Analysis. I am working my way through all the material on this site, a course on TA and a couple of books on TA.
I have some questions about the current chart on ALVR.

I have attempted to draw the support and resistance lines. Do they look right to you all? I know this is very basic, but I want to make sure i drew them correctly. Also, is the best way to draw support and resistance in TC, to draw two horizontal trendlines?
Based on the TA course I am watching, in this current pattern, the resistance line normally becomes the new support line. So based on that, would you all agree that anything between 1.09 and 1.12 or so would be a good entry point? Also, I would be inclined to set a tight stop loss.
What are your thoughts?
Thanks in advance.
|
|
Registered User
Joined: 1/28/2005
Posts: 6,049
|
This is a chart of PFSW.
Your assumptions are correct provided that is the
pattern you are intending to trade.
The pattern you have drawn is what is known as
a rectangle.
(notice as a conformation of the breakout
the increase in volume)
---------------------------------------------------------------
Other interpretations of the chart:
Some might look to buy on a break of a downward
trend line from the early 2007 top and the May 2007
high.
(this would have produced a buy on 7/09/07)
-----------------------------------------------------------------
Some would view the area after 7/26/07 as a mini
rectangle. With a high and low of 1.05 and .91.
------------------------------------------------------------------
Some may view the period from July 2007
to mid August a triangle shape. With an upward
line from the late June to mid august period and
a relatively flat line from the 7/13/07 high to the
mid august highs.
-----------------------------------------------------------------
One way to control risk is to size your position
based on account value.
Lets say you planned to enter at 1.09 and your stop was set at recent lows of .94.
If you had a $50,000 account and wanted to
risk 1% of account value. (typically the value
would be set at 2% or less)
$50,000*1%= $500
Your stop loss would risk .15 (1.09-.94=.15)
500/.15= 3333.33 shares
So rounding down you could buy 3300 shares.
(using a closer stop or wider stop would cause
you to buy more or less shares to keep your
risk at $500)
---------------------------------------------------------------
Notice that there is a isolated low on 8/29/07.
(a low where both lows on either side of it
are higher) Many would view this as the next
logical support area and would raise an
initial stop to that zone.
------------------------------------------------------------
These are all general points of view. Ultimately
your trading style/timeframe/aggressiveness
will be the determining factors in how
you trade this.
My comments are related to basic chart
reading and I'm not rating the fundamentals
of the company.
------------------------------------------------------------
Thanks
diceman
|
|

Registered User
Joined: 4/18/2005
Posts: 4,090
|
In general you have drawn them the way I draw them.
If you are new to TA I would strongly suggest Don Wordens books AND I think you can take some time off your learning curve with a few of his videos. Moneystream and TSV I thought were great. I feel like it improved my trading. I haven't seen his stock picking series but his "Uncovering Resiliant stocks in todays market" was nice and perfectly suited to the current market sutuation we are facing... in terms of having been through a moderate correction recently..... Interesting aproach. In a nut shell he shows how to divide a market down swing into small er segments and rank the best performers over the seperate segments
Back to trendlines. yes draw them with the trendline function. Hot key is "D" and the "shift button" will controll it to horizontal. I find trend lines to be a general guide. don't be suprised if price pierces it slightly ocasionaly. I subtract a little extra for my actual stop loss. If the Risk Reward is bad then I either skip the trade or rethink the aproach and use a tighter stop.
|
|
Registered User
Joined: 4/18/2005
Posts: 4,090
|
Oh, some people use moving averages as trendlines. diceman has an interesting formula for an automatic trendline and Linear regressino chanels can be an interesting aproach as well. I think the Wordens use this frequently.
|
|
Registered User
Joined: 12/21/2004
Posts: 902
|
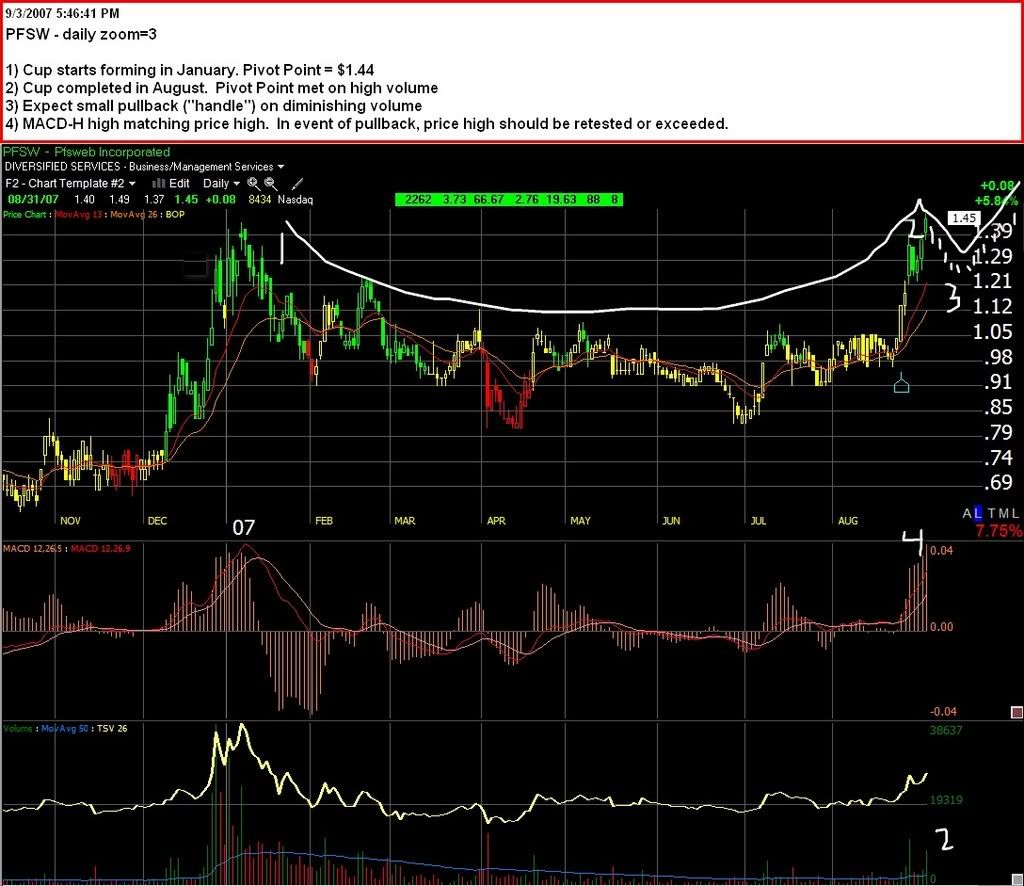
Look at a weekly chart or open up the daily chart to zoom=3 and you'll see that this has just completed a "cup" pattern starting in January. The January high of $1.44 is the "pivot point". Often once a cup is completed, there is a small pullback on diminishing volume called the "handle", which often results in a very profitable breakout from the handle. The cup and handle is one of the most popular chart patterns.
The handle can take 7-10 days, maybe more. The handle shouldn't really drop back more than halfway between the pivot point the level of the cup base. I wouldn't expect it to drop back to the $1.09-1.12 area, if you wait for that, you'll miss the trade.
The entry level in the cup-and-handle is once the price passes the pivot point again after the handle is completed, hopefully on large volume. The pivot itself, or below it, or the low point of the handle, can be your stops.
Since you are new to technical analysis, allow me to give a small lesson on a technical indicator that applies on this chart. Set up a MACD-Histogram ("MACD-H") indicator with "normal" settings - 12,26,9 )or see the chart below). MACD-H is a measure of trend strength.
We (or I should say, "I") often talk on here about the "Elder Dictum", based on a premise discussed by Dr Alexander Elder in "Come Into My Trading Room" that states that when price and MACD-H both hit multi-month highs, that strong momentum is created, and, in the event of a pull-back, the price high can generally be expected to be retested or exceeded. This applies on this chart.
In the event that a handle is created, one play might be entry at the low point of the handle, with the confidence that the price high at the top of the handle will at least be retested for X% gain. The stop here would be just below the low point of the handle. Or you can play the cup-and-handle from the pivot point. I would NOT wait for price to drop back to the $1.09-1.12 range.
http://i201.photobucket.com/albums/aa54/hohandy/2007-09-03_175406.jpg
|
|
Registered User
Joined: 12/21/2004
Posts: 902
|
|
|
 Gold Customer Gold Customer
Joined: 10/7/2004
Posts: 264
|
I'll give you another take on it. You really only determined a support (demand) area between say $0.80 and $1.10. They only thing you really know for sure is that at $1.10 there was more demand for the stock than supply and thus prices moved up. The trade would be to wait for a move back down to that support (demand) level and buy a reversal out of that level with your stop below that level.
If you don't want to wait that long, there is another support (demand) level between $1.21 and $1.35. Good luck.
|
|
|
Guest-1 |