| j2d2 |
|
Gold User, Member, Platinum User, TeleChart
|
| Registered User |
|
|
|
|
| Unsure |
|
| Friday, January 14, 2005 |
| Wednesday, July 17, 2013 9:27:35 PM |
21
[0.01% of all post / 0.00 posts per day] |
|
QUOTE (Winnie) Hi j2d2,
How did you copy and paste the images into your post? I have a trial copy of SnagIt, with SnagIt I can copy and paste an image into Word or any other document but can't paste it into this forum. I searched for an answer here but found none, so if you or anyone else knows how this is accomplished, please let me know, it would be greatly appreciated.
Thanks
Winnie
Hello Winnie: I am not familiar with SnagIt. I use PrintKey Pro which is basic screen capture software and very likely similar to what you are using. My software allows me to capture the whole screen or just selected parts that I am interested in. Then I select a format, usually gif or jpeg, and save the image in a separate folder on my hard drive. From that point it is basically the same procedure that you would follow for adding an avatar/icon to your posts on this forum. In simple terms, you need to find a place on the internet where you can upload your picture to a permanent location and then you come back to this forum and create a post that points to where you stored it. This is usually referred to as finding yourself a web host. So do a Google search on web hosting sites or internet host sites and read what you can expect to get from the top ten hosting sites in terms of space, reliability and ease of use. Then decide if you really need that much space and reliability and look at some of the places that offer a limited amount of free or relatively free space for limited use and limited budgets. If you need more information please ask one of the trainers who are certainly more qualified than I at explaining how things work on their forum.
Regards,
j2d2
|
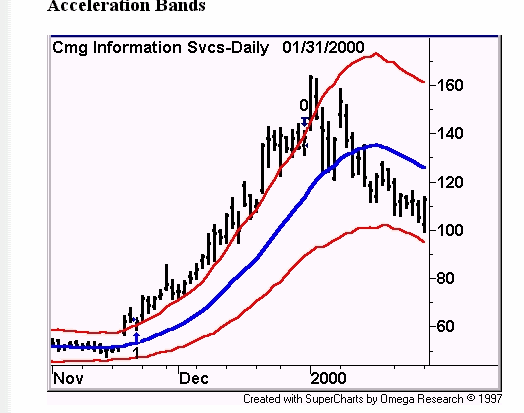
Since pictures are worth a thousand words (which likely includes a few formulae also, I looked on the Price Headley web site to see what his examples on acceleration bands actually looked like. I found this picture of CMGI from the 1999 time frame. He describes his buy signal as three closes above the upper band which came in the third week of November. The sell signal depicted here is the first close below the upper band which transpired it appears during the last week of December. The buy and sell are marked with a 1 and a 0.

Then I looked on other web sites and found the same basic code that Bruce first posted with the notation that is was Metastock code:
Acceleration Bands
{For upper band}
Upperband:=(H*(1+2*((((H-L)/((H+L)/2))*1000)*0.001)));
Mov(Upperband, 20, S );
{For lower band}
Lowerband:=(L*(1-2*((((H-L)/((H+L)/2))*1000)*0.001)));
Mov(Lowerband, 20, S );
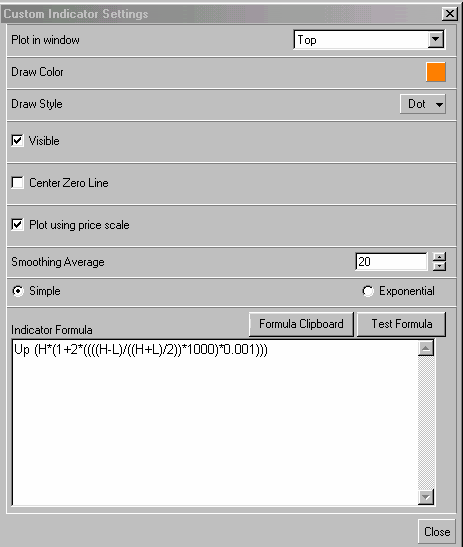
So I used this code in the following TC-format as a custom indicator for the upper acceleration band:

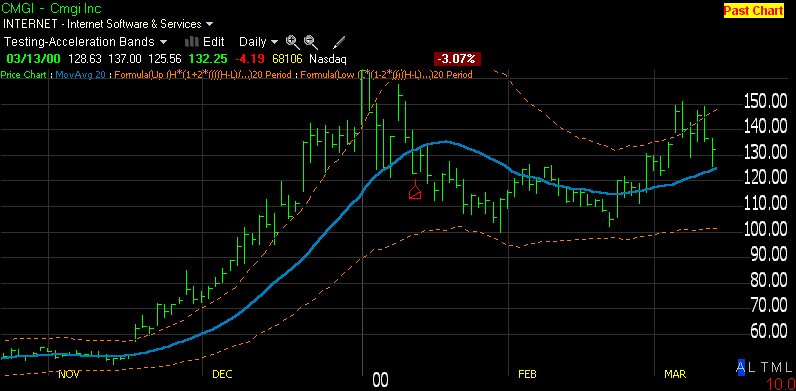
A second custom indicator was constructed for the lower band with the above code and a 20 bar SMA was added. This is the result....

Comparing my TC chart with the example found on the Price Headley site I find the buy and sell points to be close enough (in this example they appear in the same positions as the one example) should anyone choose to use this template for further testing. I would add the caveat that a test using a sample size of ONE is not to be considered as a proof of anything.
Regards,
j2d2
|
QUOTE (Craig_S) Tick is price... so I don't understand.
Hi Crag: I got here using the search feature because I had a similar question about whether or not tick volume was available in the Platinum version of TeleChart. If you had not removed the reference to where it was that mc2 saw the demo I could tell you for certain what he was talking about. However, for clarification, what I believe he was asking is for each individual stock, every transaction happens on an up tick (at the offer price) or a down tick (at the bid price). In this sense, tick volume is the number of shares traded on up ticks vs. the number of shares traded on down ticks. During the day you would have a running total for each stock of the difference between the number of shares traded on up ticks and down ticks. This number either positive or negative is normally referred to as the tick volume. Based upon the symbol TICK available in the Worden system which applies to the overall markets and not to individual stocks I would have to say that the answer to the original question is that tick volume is not currently available in any edition of TeleChart. However, if I am mistaken and there is something of this nature in Platinum that is not available in the Gold edition I would like to know about it.
Thanks,
j2d2
|
Hello All: Doug's answer to kolaskcj's question is technically correct, but lacking in insight. I recommend that kolaskcj go to the online help file and look under money stream until he finds the historical comments by Don Worden on Evolution of Cumulative MoneyStream and Balance of Power. MoneyStream evolved from the ashes of Tick Volume which Worden says is now a Zombie named Money Flow. There is one paragraph there that states that MoneyStream "embodies" price and volume but also makes an automatic adjustment when volume is not available. Mr. Worden further states that MoneyStream is similar to three separate versions of money flow including that by Chaikin but with a correction for what Mr. Worden considers to be a "logical error". For those willing to spend some time searching for a common logical error in the various formulae available for calculating money flows, you should at least gain a bit of insight into what it is that would provide CMS with the ability to contradict price. And if nothing else, you will learn a bit of history in the undertaking.
Regards,
j2d2
|
QUOTE (ctomjones) When I test the formula, C1 >=7 and <=8, I get a pop up that says: error in formula syntax and below that a message that says: market days needed to calculate 2 What is wrong with my formula? - Tom
Hi Tom: The answer to your specific question about the syntax error is that you did not repeat the C1 in your formula. Try using C1>=7andC1<=8
Regards,
j2d2
|
OK...silly me. Should have done a search first. I have already found the answer provided to the first person who asked the same question.
Sorry to have bothered you.
--j2d2--
|
In the noted report, Sir Knowledgeable Skeptic stated...."The Worden Reletive Strength moving average crossover system is idealy suited for longer term time frames".
To what exactly is being referred to by this statement and where does one look to find more information on this subject?
Thanks,
j2d2
|
Hey Guys: I am also not all that convinced of the relative usefullness of Twiggs Money Flow as an indicator. I have been content to use the following PCF for Money Flow Index and live with any problems resulting from volume spikes. As to your policy of removing all references to places of origin for posted material whether in the form of a URL or not, I am in agreement with Jim Murphy as to it being counterproductive to what is being done here. However it is your Forum so censor whatever you please.
This is the PCF I have been using for a 10 day Money Flow Index as a custom indicator. Of course it could easily be expanded to include any number of days desired.
100-(100/(1+
(((((H+L+C)/3)*V)>(((H1+L1+C1)/3)*V1)AND(((H+L+C)/3)*V))+
((((H1+L1+C1)/3)*V1)>(((H2+L2+C2)/3)*V2)AND(((H1+L1+C1)/3)*V1))+
((((H2+L2+C2)/3)*V2)>(((H3+L3+C3)/3)*V3)AND(((H2+L2+C2)/3)*V2))+
((((H3+L3+C3)/3)*V3)>(((H4+L4+C4)/3)*V4)AND(((H3+L3+C3)/3)*V3))+
((((H4+L4+C4)/3)*V4)>(((H5+L5+C5)/3)*V5)AND(((H4+L4+C4)/3)*V4))+
((((H5+L5+C5)/3)*V5)>(((H6+L6+C6)/3)*V6)AND(((H5+L5+C5)/3)*V5))+
((((H6+L6+C6)/3)*V6)>(((H7+L7+C7)/3)*V7)AND(((H6+L6+C6)/3)*V6))+
((((H7+L7+C7)/3)*V7)>(((H8+L8+C8)/3)*V8)AND(((H7+L7+C7)/3)*V7))+
((((H8+L8+C8)/3)*V8)>(((H9+L9+C9)/3)*V9)AND(((H8+L8+C8)/3)*V8))+
((((H9+L9+C9)/3)*V9)>(((H10+L10+C10)/3)*V10)AND
(((H9+L9+C9)/3)*V9)))/(((((H+L+C) /3)*V)<(((H1+L1+C1)/3)*V1)AND
(((H1+L1+C1)/3)*V))+
((((H1+L1+C1)/3)*V1)<(((H2+L2+C2)/3)*V2)AND(((H2+L2+C2)/3)* V2))+
((((H2+L2+C2)/3)*V2)<(((H3+L3+C3)/3)*V3)AND(((H2+L2+C2)/3)*V2))+
((((H3+L3+C3)/3)*V3)<(((H4+L4+C4)/3)*V4)AND(((H3+L3+C3)/3)*V3))+
((((H4+L4+C4)/3)*V4)<(((H5+L5+C5)/3)*V5)AND(((H4+L4+C4)/3)*V4))+
((((H5+L5+C5)/3)*V5)<(((H6+L6+C6)/3)*V6)AND(((H5+L5+C5)/3)*V5))+
((((H6+L6+C6)/3)*V6)<(((H7+L7+C7)/3)*V7)AND(((H6+L6+C6)/3)*V6))+
((((H7+L7+C7)/3)*V7)<(((H8+L8+C8)/3)*V8)AND(((H7+L7+C7)/3)*V7))+
((((H8+L8+C8)/3)*V8)<(((H9+L9+C9)/3)*V9)AND(((H8+L8+C8)/3)*V8))+
((((H9+L9+C9)/3)*V9)<(((H10+L10+C10)/3)*V10)AND(((H9+L9+C9)/3)*V9)))))
|
Hi Doug:
I first looked on (removed by Moderator) to find a link with a reference to 'Twiggs' which led me to (removed by moderator)where I found the following description....
Twiggs Money Flow makes two basic improvements to the Chaikin Money Flow formula:
Twiggs Money Flow substitutes true range for the daily high and low and then applies exponential smoothing, separately, to the sum of AD and the divisor:
Calculate True Range High and True Range Low:
True Range High (TRH) is the greater of:
High [today] and
Closing price [yesterday]
True Range Low (TRL) is the lesser of:
Low [today] and
Closing price [yesterday]
Calculate AD using True Range High and True Range Low:
AD = {(Close - TRL) - (TRH - Close)} / {TRH - TRL} * Volume
Apply exponential smoothing* to AD:
Calculate AD[21] as the sum of AD for the first 21 days
On the next day, multiply AD[21] by 20/21 and add AD for day 22
Repeat this process for each subsequent day**.
*Welles Wilder's Indicators
TMF uses Welles Wilder's formula for calculating an exponential moving average:
1/14 of today's data + 13/14 of yesterday's average is a 14-day exponential moving average.
If you refer to Exponential Moving Averages you will see that this equates to a normal 27-day exponential moving average.
Example
Adjust Wilder's time period (n=15) to a normal EMA time period:
EMA time period = (n + 1) / 2 = (15 + 1) / 2 = 8 days
Do the same with the divisor:
Calculate V[21] as the sum of volume for the same 21 day period as in 3. above
On the next day, multiply V[21] by 20/21 and add Volume for day 22
Repeat this process for each subsequent day**
**Exponential Smoothing
Some observant readers have questioned why Step 3 is not divided by 21 days, to create an exponential moving average. The same applies to Step 4.
You will note that Step 5 divides the result of Step 3 by Step 4. Division of the numerator (Step 3) and the denominator (Step 4) by 21 is therefore redundant: the one offsets the other.
This leads to another question: Why are AD (Step 3) and Volume (Step 4) not divided by 21?
If we take Step 4 as an example, V[21] is the sum of 21 days of volume. If we want to add the next days Volume, we must remove one days Volume from V[21], to keep the total constant at 21 days. We do this by multiplying V[21] by the fraction 20/21.
Divide AD[21] by V[21]:
Twiggs Money Flow = AD[21] / V[21]
_____________
There is more information on this posted at (Removed by Moderator)should you wish to refer to the original. I have not personally attempted to put this into a PCF as I know that there are several posters on this forum who can do a much more professional job with it than I ever could.
Regards,
j2d2
|
|
Thanks Doug for the practical demonstration of what the three variables of the stoch actually represent. It is a real shame that so many who know how to use it do not have the ability to explain it to others in a form that is as understandable as what you have done here.
|
|